Making the most detailed tweet map ever by Eric Fisher.
From the post:
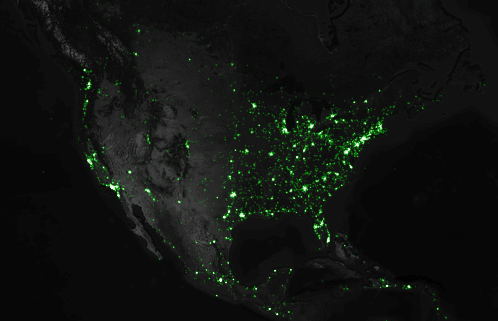
I’ve been tracking geotagged tweets from Twitter’s public API for the last three and a half years. There are about 10 million public geotagged tweets every day, which is about 120 per second, up from about 3 million a day when I first started watching. The accumulated history adds up to nearly three terabytes of compressed JSON and is growing by four gigabytes a day. And here is what those 6,341,973,478 tweets look like on a map, at any scale you want.
[Static screenshot of a much cooler interactive map at original post.]
I’ve open sourced the tools I used to manipulate the data and did all the design work in Mapbox Studio. Here’s how you can make one like it yourself.
…
Eric gives a detailed account of how you can start tracking tweets on your own!
This rocks! If you use or adapt Eric’s code, be sure to give him a shout out in your code and/or documentation.