Another Word For It Patrick Durusau on Topic Maps and Semantic Diversity

October 14, 2013

Astrophysics Source Code Library…

Filed under: Algorithms,Astroinformatics,Programming,Software — Patrick Durusau @ 4:25 pm

Astrophysics Source Code Library: Where do we go from here? by Ms. Alice Allen.

From the introduction:

This week I am featuring a guest post by Ms. Alice Allen, the Editor of the the Astrophysics Source Code Library, an on-line index of codes used in astronomical research and that have been referenced in peer-reviewed journal articles. The post is essentially a talk given by Ms. Allen at the recent ADASS XXIII meeting. The impact of the ASCL is growing – a poster by Associate Editor Kim DuPrie at ADASS XXIII showed that there are now 700+ codes indexed, and quarterly page views have quadrupled from Q1/2011 to 24,ooo. Researchers are explicitly citing the code in papers that use the software, the ADS is linking software to papers about the code, and the ASCL is sponsoring workshops and discussion forums to identify obstacles to code sharing and propose solutions. And now, over to you, Alice: (emphasis in original)

Alice describes “success” as:

Success for us is this: you read a paper, want to see the code, click a link or two, and can look at the code for its underlying assumptions, methods, and computations. Alternately, if you want to investigate an unfamiliar domain, you can peruse the ASCL to see what codes have been written in that area.

Imagine having that level of “success” for data sets or data extraction source code.
October 7, 2013

From The Front Lines of ADASS XXIII

Filed under: Astroinformatics,BigData — Patrick Durusau @ 4:04 pm

Bruce Berriman has been posting summaries of the 23rd Annual Astronomical Data Analysis and Software Systems (ADASS) is being held September 29th through Oct 3rd in Wailkoloa, Hawaii.

From The Front Lines of ADASS XXIII – Day One

From The Front Lines of ADASS XXIII – Day Two Morning

From The Front Lines of ADASS – Day 3 Morning

More posts to appear here.

The program with links to abstracts.

It wasn’t called “big data” back in the day but astronomers were early users of what is now called “big data.”

Enjoy!

September 27, 2013

IVOA Newsletter – September 2013

Filed under: Astroinformatics,BigData — Patrick Durusau @ 1:59 pm

IVOA [International Virtual Observatory Alliance] Newsletter – September 2013 by Mark G. Allen, Deborah Baines, Sarah Emery Bunn, Chenzou Cui, Mark Taylor, & Ivan Zolotukhin.

From the post:

The International Virtual Observatory Alliance (IVOA) was formed in June 2002 with a mission to facilitate the international coordination and collaboration necessary for the development and deployment of the tools, systems and organizational structures necessary to enable the international utilization of astronomical archives as an integrated and interoperating virtual observatory. The IVOA now comprises 20 VO programs from Argentina, Armenia, Australia, Brazil, Canada, China, Europe, France, Germany, Hungary, India, Italy, Japan, Russia, South Africa, Spain, Ukraine, the United Kingdom, and the United States and an inter-governmental organization (ESA). Membership is open to other national and international programs according to the IVOA Guidelines for Participation. You can read more about the IVOA and what we do at http://ivoa.net/about/.

What is the VO?

The Virtual Observatory (VO) aims to provide a research environment that will open up new possibilities for scientific research based on data discovery, efficient data access, and interoperability. The vision is of global astronomy archives connected via the VO to form a multiwavelength digital sky that can be searched, visualized, and analyzed in new and innovative ways. VO projects worldwide working toward this vision are already providing science capabilities with new tools and services. This newsletter, aimed at astronomers, highlights VO tools and technologies for doing astronomy research, recent papers, and upcoming events.

Astroninformatics has a long history of dealing with “big data,” although it didn’t have a marketing name.

Astronomical “big data” is being shared and accessed around the world.

What about your “big data?”

September 24, 2013

Data Visualization at IRSA

Filed under: Astroinformatics,Graphics,Visualization — Patrick Durusau @ 4:40 pm

Data Visualization at IRSA by Vandana Desai.

From the post:

The Infrared Science Archive (IRSA) is part of the Infrared Processing and Analysis Center (IPAC) at Caltech. We curate the science products of NASA’s infrared and submillimeter missions, including Spitzer, WISE, Planck, 2MASS, and IRAS. In total, IRSA provides access to more than 20 billion astronomical measurements, including all-sky coverage in 20 bands, spanning wavelengths from 1 micron to 10 mm.

One of our core goals is to enable optimal scientific exploitation of these data sets by astronomers. Many of you already use IRSA; approximately 10% of all refereed astronomical journal articles cite data sets curated by IRSA. However, you may be unaware of our most recent visualization tools. We provide some of the highlights below. Whether you are a new or experienced user, we encourage you to try them out at irsa.ipac.caltech.edu.

Vandana reviews a number of new visualization features and points out additional education resources.

Even if you aren’t an astronomy buff, the tools and techniques here may inspire a new approach to your data.

Not to mention being a good example of data that is too large to move. Astronomers have been developing answers to that problem for more than a decade.

Might have some lessons for dealing with big data sets.

August 27, 2013

Astropy: A Community Python Package for Astronomy

Filed under: Astroinformatics,Python — Patrick Durusau @ 7:13 pm

Astropy: A Community Python Package for Astronomy by Bruce Berriman.

From the post:

The rapid adoption of Python by the astronomical community was starting to make it a victim of its own success, with fragmented development of Python packages across different groups. Thus began the Astropy project began in 2011, with an ambitious goal to coordinate Python development across various groups and simplify installation and usage for astronomers. These ambitious goals have been met and are summarized in the paper Astropy: A Community Python Package for Astronomy, prepared by the Astropy Collaboration. The Astropy webpage provides download and build instructions for the current release, version 0.2.4, and complete documentation. It is released under a “3-clause” BSD-type license – the package may be used for any purpose, as long as the copyright is acknowledged and warranty disclaimers are given.

Get the paper and the code. Both will repay your study well.

The only good Python story I know was from a programmer who lamented the ability of Python to scale.

He wrote a sample program in Python for a customer, anticipating they would return for the production version.

But the sample program handled their needs so well, they had no need for the production version.

I am sure Python was due some of the credit but the programmer is a James Clark level programmer so his skills contributed to the result as well.

August 17, 2013

Parallel Astronomical Data Processing with Python:…

Filed under: Astroinformatics,Parallel Programming,Python — Patrick Durusau @ 3:52 pm

Parallel Astronomical Data Processing with Python: Recipes for multicore machines by Bruce Berriman.

From the post:

Most astronomers (myself included) have a high performance compute engine on their desktops. Modern computers now contain multicore processors, whose development was prompted by the need to reduce heat dissipation and power consumption but which give users a powerful processing machine at their fingertips. Singh, Browne and Butler have recently posted a preprint on astro-ph, submitted to Astronomy and Computing, that offers recipes in Python for running data parallel processing on multicore machines. Such machines offer an alternative to grids, clouds and clusters for many tasks, and the authors give examples based on commonly used astronomy toolkits.

The paper restricts itself to the use of CPython’s native multiprocessing module, for two reasons: much astronomical software is written in it, and it places sufficiently strong restrictions on managing threads launched by the OS that it can make parallel jobs run slower than serial jobs (not so for other flavors of Python, though, such as PyPy and Jython). The authors also chose to study data parallel applications, which are common in astronomy, rather than task parallel applications. The heart of the paper is a comparison of three approaches to multiprocessing in Python, with sample code snippets for each:
(…)

Bruce’s quick overview will give you the motivation to read this paper.

Astronomical data is easier to process in parallel than some data.

Suggestions on how to transform other data to make it easier to process in parallel?

August 7, 2013

Extremely Large Images: Considerations for Contemporary Approach

Filed under: Astroinformatics,Semantics — Patrick Durusau @ 6:53 pm

Extremely Large Images: Considerations for Contemporary Approach by Bruce Berriman.

From the post:

This is the title of a paper by Kitaeff, Wicenec, Wu and Taubman recently posted on astro-ph. The paper addresses the issues of accessing and interacting with very large data-cube images that will be be produced by next generation of radio telescopes such as the Square Kilometer Array (SKA), the Low Frequency Array for Radio Astronomy (LOFAR) and others. Individual images may be TB-sized, and one SKA Reference Mission Project, “Galaxy Evolution in the Nearby Uni-verse: HI Observations,” will generate individual images of 70-90 TB each.

Data sets this large cannot reside on local disks, even with anticipated advances in storage and network technology. Nor will any new lossless compression techniques that preserve the low S/N of the data save the day, for the act of decompression will impose excessive computational demands on servers and clients.

(emphasis added)

Yes, you read that correctly: “generate individual images of 70-90 TB each.”

Looks like the SW/WWW is about to get a whole lot smaller, comparatively speaking.

But the data you will be encountering will be getting larger. A lot larger.

Bear in mind that the semantics we associate with data will be getting larger as well.

Read that carefully, especially the part about “…we associate with data…”

Data may appear to have intrinsic semantics but only because we project but do not acknowledge the projection of semantics.

The more data we have, the more space there is for semantic projection, by everyone who views the data.

Whose views/semantics do you want to capture?

Visualizing Astronomical Data with Blender

Filed under: Astroinformatics,Image Processing,Visualization — Patrick Durusau @ 6:42 pm

Visualizing Astronomical Data with Blender by Brian R. Kent.

From the post:

Astronomy is a visually stunning science. From wide-field multi-wavelength images to high-resolution 3D simulations, astronomers produce many kinds of important visualizations. Astronomical visualizations have the potential for generating aesthetically appealing images and videos, as well as providing scientists with the ability to inspect phase spaces not easily explored in 2D plots or traditional statistical analysis. A new paper is now available in the Publications of the Astronomical Society of the Pacific (PASP) entitled “Visualizing Astronomical Data with Blender.” The paper discusses:
(…)

Don’t just skip to the paper, Brian’s post has a video demo of Blender that you will want to see!

July 24, 2013

Big and Far Away Data

Filed under: Astroinformatics,BigData — Patrick Durusau @ 3:26 pm

Astronomer uses Kepler telescope’s data in hunt for spacecraft from other worlds by Peter Brannen.

From the post:

In the field of planet hunting, Geoff Marcy is a star. After all, the astronomer at the University of California at Berkeley found nearly three-quarters of the first 100 planets discovered outside our solar system. But with the hobbled planet-hunting Kepler telescope having just about reached the end of its useful life and reams of data from the mission still left uninvestigated, Marcy began looking in June for more than just new planets. He’s sifting through the data to find alien spacecraft passing in front of distant stars.

He’s not kidding — and now he has the funding to do it.

Great read!

BTW, if you want to search older data (older than Kepler) for alien spacecraft, consider the digitized Harvard College Observatory Astronomical Plate Stacks. The collection runs from 1885-1993. Less than ten (10%) of it has been digitized and released.

July 10, 2013

Data Sharing and Management Snafu in 3 Short Acts

Filed under: Archives,Astroinformatics,Open Access,Open Data — Patrick Durusau @ 1:43 pm

As you may suspect, my concerns are focused on the preservation of the semantics of the field names, Sam1, Sam2, Sam3, but also with the field names that will be generated by the requesting researcher.

I found this video embedded in: A call for open access to all data used in AJ and ApJ articles by Kelle Cruz.

From the post:

I don’t fully understand it, but I know the Astronomical Journal (AJ) and Astrophysical Journal (ApJ) are different than many other journals: They are run by the American Astronomical Society (AAS) and not by a for-profit publisher. That means that the AAS Council and the members (the people actually producing and reading the science) have a lot of control over how the journals are run. In a recent President’s Column, the AAS President, David Helfand proposed a radical, yet obvious, idea for propelling our field into the realm of data sharing and open access: require all journal articles to be accompanied by the data on which the conclusions are based.

We are a data-rich—and data-driven—field [and] I am advocating [that authors provide] a link in articles to the data that underlies a paper’s conclusions…In my view, the time has come—and the technological resources are available—to make the conclusion of every ApJ or AJ article fully reproducible by publishing the data that underlie that conclusion. It would be an important step toward enhancing and sharing our scientific understanding of the universe.

Kelle points out several reasons why existing efforts are insufficient to meet the sharing and archiving needs of the astronomical community.

Suggested reading if you are concerned with astronomical data or archives more generally.

July 2, 2013

A resource for fully calibrated NASA data

Filed under: Astroinformatics,Data — Patrick Durusau @ 12:46 pm

A resource for fully calibrated NASA data by Scott Fleming, an astronomer at Space Telescope Science Institute.

From the post:

The Mikulski Archive for Space Telescopes (MAST) maintains, among other things, a database of fully calibrated, community-contributed spectra, catalogs, models, and images from UV and optical NASA missions. These High Level Science Products (HLSPs) range from individual objects to wide-field surveys from MAST missions such as Hubble, Kepler, GALEX, FUSE, and Swift UVOT. Some well-known surveys archived as HLSPs include CANDELS, CLASH, GEMS, GOODS, PHAT, the Hubble Ultra Deep Fields, the ACS Survey of Galactic Globular Clusters. (Acronym help here: DOOFAS). And it’s not just Hubble projects: we have HLSPs from GALEX, FUSE, and IUE, to name a few, and some of the HLSPs include data from other missions or ground-based observations. A complete listing can be found on our HLSP main page.

How do I navigate the HLSP webpages?

Each HLSP has a webpage that, in most cases, includes a description of the project, relevant documentation, and previews of data. For example, the GOODS HLSP page has links to the current calibrated and mosaiced FITS data files, the multi-band source catalog, a Cutout Tool for use with images, a Browse page where you can view multi-color, drizzled images, and a collection of external links related to the GOODS survey.

You can search many HLSPs based on target name or coordinates. If you’ve ever used the MAST search forms to access HST, Kepler, or GALEX data, this will look familiar. The search form is great for checking whether your favorite object is part of a MAST HLSP. You can also upload a list of objects through the “File Upload Form” link if you want to check multiple targets. You may also access several of the Hubble-based HLSPs through the Hubble Legacy Archive (HLA). Click on “advanced search” in green, then in the “Proposal ID” field, enter the name of the HLSP product to search for, e.g., “CLASH”. A complete list of HLSPs available through the HLA may be found here where you can also click on the links in the Project Name column to initiate a search within that HLSP.

(…)

More details follow on how to contribute your data.

I suggest following @MAST_News for updates on data and software!

June 30, 2013

Data Discovery Tool (version 1.5) [VAO]

Filed under: Astroinformatics — Patrick Durusau @ 1:39 pm

Data Discovery Tool (version 1.5)

From the post:

The VAO has released a new version of the Data Discovery Tool (v1.5) on June 21, 201[3]. With this tool you can find datasets from thousands of astronomical collections known to the VO and over wide areas of the sky. This includes thousands of astronomical collections – photometric catalogs and images – and archives around the world.

New features of the Data Discovery Tool include:

  • The AstroView all-sky display no longer requires Flash or any other browser plug-in.
  • All source metadata is preserved when data, such as catalogs or image lists, are exported from the DDT to a VOTable.
  • Scatter plots are available for any result tables that have at least two numeric columns.
  • More accurate footprint displays for cases where the image data resource provides more than the minimum set of image metadata.

I corrected the release date in the text. It originally read “2012,” which is incorrect.

Astronomy is an interesting area of “big data” and where there are some common semantics (celestial coordinates) but semantic diversity (publications) is also present.

It also has a long traditional of freely sharing data and making it possible to process very large data sets without transfer of the data.

Not a bad model.

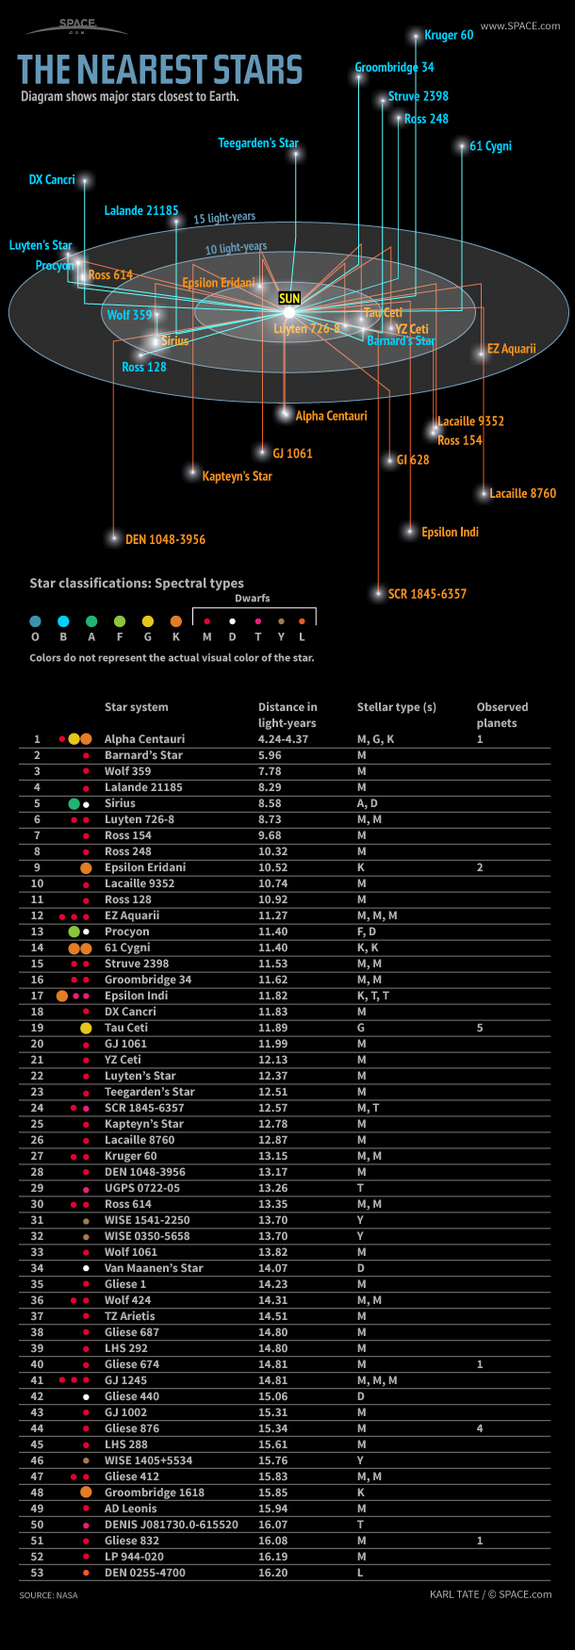
Nearest Stars to Earth (infographic)

Filed under: Astroinformatics,Graphics,Visualization — Patrick Durusau @ 1:30 pm

Learn about the nearest stars, their distances in light-years, spectral types and known planets, in this SPACE.com infographic.
Source SPACE.com: All about our solar system, outer space and exploration

I first saw this at The Nearest Stars by Randy Krum.

Curious if you see the same issues with the graphic that Randy does?

This type of display isn’t uncommon in amateur astronomy zines.

How would you change it?

My first thought was to lose the light year rings.

Why? Because I can’t rotate them visually with any degree of accuracy.

For example, how far do you think Kruger 60 is from Earth? More than 15 light years or less? (Follow the Kruger 60 link for the correct answer.)

If it makes you feel better, my answer to that question was wrong. 😉

Take another chance, what about SCR 1845-6357? (I got that one wrong as well.)

The information is correctly reported but I mis-read the graphic. How did you do?

June 27, 2013

Dissecting FITS files – The FITS extension & Astronomy

Filed under: Astroinformatics — Patrick Durusau @ 6:03 pm

Dissecting FITS files – The FITS extension & Astronomy by Rahul Poruri.

From the post:

FITS is a very common extension used in astronomy.

It stands for Flexible Image Transport System.

Literally any image or spectrum produced by any observatory or telescope in this world (or orbiting this world) will eventually be converted from RAW CCD format into a FITS file! I still don’t know how it caught on or what the advantages of the FITS extension are over the other types like .txt or .asc (ASCII) but hey, it’s the convention and i’d (and any one interested in pursuing Astronomy seriously) should learn how to go about using FITS files i.e accessing them, understanding the data structure in a FITS file and performing operations on them.

Astronomical data is usually pictures in one color. Yes. Only one color.

Yes. Everything you know IS a lie. All of the colored pictures of nebulae, star forming regions, the galaxy and what not are actually false-color images where images of the same object observed at different wavelengths are clubbed together – stacked – to create a false color image. Usually the color red stands for a H Balmer emission line, green corresponds to OII lines (singly ionized oxygen) etc etc. Because the H Balmer lines are at lower energy i.e higher wavelength in comparison to the OII lines, it is convenient to represent emission from the H nebulae as red!

A very good summary of tools for working with the FITS file format.

Knowledge of the FITS format is essential if you want to venture into astroinformatics.

Astronomy and Computing

Filed under: Astroinformatics — Patrick Durusau @ 1:03 pm

Astronomy and Computing

A new journal on astronomy and computing. Potentially a source of important new techniques and algorithms for data processing.

The first volume is online for free but following issues will be behind an Elsevier pay wall.

I will try to keep you advised of interesting new articles.

I first saw this at Bruce Berriman’s Astronomy and Computing: A New Peer Reviewed Astronomy Journal.

June 17, 2013

ADA* – Astronomical Data Analysis

Filed under: Astroinformatics,BigData,Data Analysis — Patrick Durusau @ 2:27 pm

From the conference page:

Held regularly since 2001, the ADA conference series is focused on algorithms and information extraction from astrophysics data sets. The program includes keynote, invited and contributed talks, as well as posters. This conference series has been characterized by a range of innovative themes, including curvelet transforms, compressed sensing and clustering in cosmology, while at the same time remaining closely linked to front-line open problems and issues in astrophysics and cosmology.

ADA6 2010

ADA7 2011

Online presentations, papers, proposals, etc.

Astronomy – Home of really big data!

June 11, 2013

IEEE Computer: Special Issue on Computing in Astronomy

Filed under: Astroinformatics,Topic Maps — Patrick Durusau @ 9:39 am

IEEE Computer: Special Issue on Computing in Astronomy

From the post:

Edited by Victor Pankratius (MIT) and Chris Mattmann (NASA)
Final submissions due: December 1, 2013
Publication date: September 2014

Computer seeks submissions for a September 2014 special issue on computing in astronomy.

Computer science has become a key enabler in astronomy’s ability to progress beyond the processing capacity of humans. In fact, computer science is a major bottleneck in the quest of making new discoveries and understanding the universe. Sensors of all kinds collect vast amounts of data that require unprecedented storage capacity, network bandwidth, and compute performance in cloud environments. We are now capable of more sophisticated data acquisition, analysis, and prediction than ever before, thanks to progress in parallel computing and multicore technologies. Social media, open source, and distributed scientific communities have also shed light on new methods for spreading astronomical observations and results quickly. The field of astroinformatics is emerging to unite interdisciplinary efforts across several communities.

This special issue aims to present high-quality articles to the computer science community that describe these new directions in computing in astronomy and astroinformatics. Only submissions describing previously unpublished, original, state-of-the-art research that are not currently under review by a conference or journal will be considered.

Appropriate topics include, but are not limited to, the following:

  • Collecting and processing big data in astronomy
  • Multicore systems, GPU accelerators, high-performance computing, clusters, clouds
  • Data mining, classification, information retrieval
  • Computational astronomy, simulations, algorithms
  • Astronomical visualization, graphics processing, computer vision
  • Crowdsourcing and social media in astronomical data collection
  • Computing aspects of next-generation instruments, sensor networks
  • Astronomical open source software and libraries
  • Automated searches for astronomical objects or phenomena, such as planets, pulsars, organic molecules
  • Feature and event recognition in complex multidimensional datasets
  • Analysis of cosmic ray airshower data of various kinds
  • Computing in antenna arrays, very long baseline interferometry

The guest editors are soliciting three types of contributions: (1) regular research articles describing novel research results (full page l ength, 5,000 words); (2) experience reports describing approaches, instruments, experiments, or missions, with an emphasis on computer science aspects (half the page length of a regular article, 2,500 words); and (3) sidebars serving as summaries or quick pointers to projects, missions, systems, or results that complement any of the topics of interest (600 words).

Articles should be original and understandable to a broad audience of computer science and engineering professionals. All manuscripts are subject to peer review on both technical merit and relevance to Computer’s readership. Accepted papers will be professionally edited for content and style.

For additional information, contact the guest editors directly: Victor Pankratius, Massachusetts Institute of Technology, Haystack Observatory (http://www.victorpankratius.com); and Chris Mattman, NASA JPL (http://sunset.usc.edu/~mattmann).

Paper submissions are due December 1, 2013. For author guidelines and information on how to submit a manuscript electronically, visit http://www.computer.org/portal/web/peerreviewmagazines/computer

A great opportunity to combine two fun interests: astronomy and topic maps!

The deadline of December 1, 2013 will be here sooner than you think. Best to start drafting now.

May 11, 2013

Data-rich astronomy: mining synoptic sky surveys [Data Bombing]

Filed under: Astroinformatics,BigData,Data Mining,GPU — Patrick Durusau @ 10:11 am

Data-rich astronomy: mining synoptic sky surveys by Stefano Cavuoti.

Abstract:

In the last decade a new generation of telescopes and sensors has allowed the production of a very large amount of data and astronomy has become, a data-rich science; this transition is often labeled as: “data revolution” and “data tsunami”. The first locution puts emphasis on the expectations of the astronomers while the second stresses, instead, the dramatic problem arising from this large amount of data: which is no longer computable with traditional approaches to data storage, data reduction and data analysis. In a new, age new instruments are necessary, as it happened in the Bronze age when mankind left the old instruments made out of stone to adopt the new, better ones made with bronze. Everything changed, even the social structure. In a similar way, this new age of Astronomy calls for a new generation of tools and, for a new methodological approach to many problems, and for the acquisition of new skills. The attempts to find a solution to this problems falls under the umbrella of a new discipline which originated by the intersection of astronomy, statistics and computer science: Astroinformatics, (Borne, 2009; Djorgovski et al., 2006).

Dissertation by the same Stefano Cavuoti of: Astrophysical data mining with GPU….

Along with every new discipline comes semantics that are transparent to insiders and opaque to others.

Not out of malice but economy. Why explain a term if all those attending the discussion understand what it means?

But that lack of explanation, like our current ignorance about the means used to construct the pyramids, can come back to bite you.

In some cases far more quickly than intellectual curiosity about ancient monuments by the tin hat crowd.

Take the continuing failure of data integration by the U.S. intelligence services for example.

Rather than the current mule-like resistance to sharing, I would data bomb the other intelligence services with incompatible data exports every week.

Full sharing, for all they would be able to do with it.

Unless they had a topic map.

May 9, 2013

Crowdsourced Astronomy…

Filed under: Astroinformatics,Crowd Sourcing — Patrick Durusau @ 10:52 am

Crowdsourced Astronomy – A Talk By Carolina Ödman-Govender by Bruce Berriman.

From the post:

This is a talk given by Carolina Ödman-Govender, given at the re:publica 13 meeting, on May 8 2013. She gives a fine general introduction to the value of crowdsourcing in astronomy, and invites people to get in touch with her if they want get involved.

Have you considered crowdsourcing for development of a topic map corpus?

April 9, 2013

Astrophysical data mining with GPU…

Filed under: Astroinformatics,BigData,Data Mining,Genetic Algorithms,GPU — Patrick Durusau @ 10:02 am

Astrophysical data mining with GPU. A case study: genetic classification of globular clusters by Stefano Cavuoti, Mauro Garofalo, Massimo Brescia, Maurizio Paolillo, Antonio Pescape’, Giuseppe Longo, Giorgio Ventre.

Abstract:

We present a multi-purpose genetic algorithm, designed and implemented with GPGPU / CUDA parallel computing technology. The model was derived from our CPU serial implementation, named GAME (Genetic Algorithm Model Experiment). It was successfully tested and validated on the detection of candidate Globular Clusters in deep, wide-field, single band HST images. The GPU version of GAME will be made available to the community by integrating it into the web application DAMEWARE (DAta Mining Web Application REsource), a public data mining service specialized on massive astrophysical data. Since genetic algorithms are inherently parallel, the GPGPU computing paradigm leads to a speedup of a factor of 200x in the training phase with respect to the CPU based version.

BTW, DAMEWARE (DAta Mining Web Application REsource, http://dame.dsf.unina.it/beta_info.html.

In case you are curious about the application of genetic algorithms in a low signal/noise situation with really “big” data, this is a good starting point.

Makes me curious about the “noise” in other communications.

The “signal” is fairly easy to identify in astronomy, but what about in text or speech?

I suppose “background noise, music, automobiles” would count as “noise” on a tape recording of a conversation, but is there “noise” in a written text?

Or noise in a conversation that is clearly audible?

If we have 100% signal, how do we explain failing to understand a message in speech or writing?

If it is not “noise,” then what is the problem?

April 7, 2013

Visuals as Starting Point for Analysis

Filed under: Astroinformatics,BigData — Patrick Durusau @ 4:02 pm

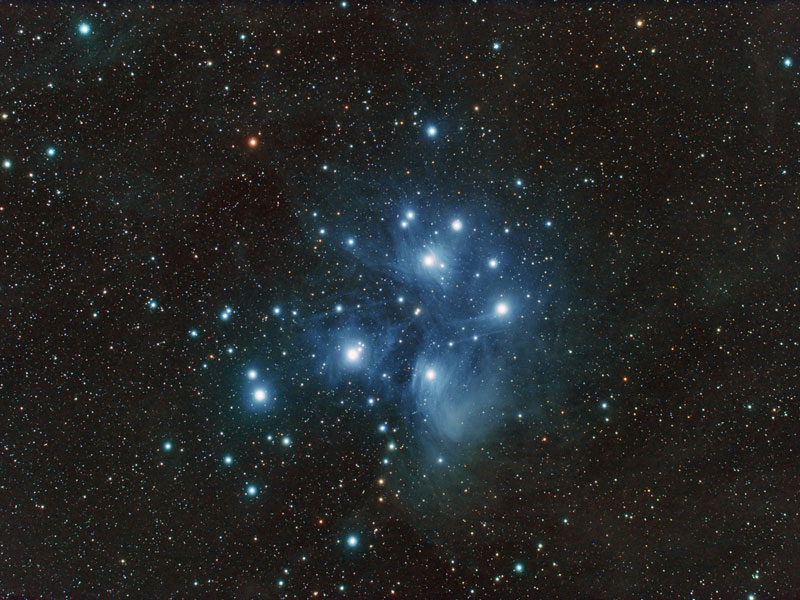
In Stat models to solve astronomical mysteries – application to business data Mirko Krivanek uses this image:

Pleiades

to argue that big data analysis could profit from signal amplification.

In astronomy, multiple measures are taken and then combined to amplify a weak signal.

I suspect the signal in astronomy is easier to separate from the noise than in big data.

Perhaps not.

It is certainly an idea that bears watching.

Not to mention documenting amplification your analysis.

Like “boosting” a search term, what is the basis for amplification is a computational artifact?

April 5, 2013

Lazy D3 on some astronomical data

Filed under: Astroinformatics,D3,Graphics,Ontology,Visualization — Patrick Durusau @ 6:03 am

Lazy D3 on some astronomical data by simonraper.

From the post:

I can’t claim to be anything near an expert on D3 (a JavaScript library for data visualisation) but being both greedy and lazy I wondered if I could get some nice results with minimum effort. In any case the hardest thing about D3 for a novice to the world of web design seems to be getting started at all so perhaps this post will be useful for getting people up and running.

astronomy ontology

The images above and below are visualisations using D3 of a classification hierarchy for astronomical objects provided by the IVOA (International Virtual Observatory Alliance). I take no credit for the layout. The designs are taken straight from the D3 examples gallery but I will show you how I got the environment set up and my data into the graphs. The process should be replicable for any hierarchical dataset stored in a similar fashion.

Even better than the static images are various interactive versions such as the rotating Reingold–Tilford Tree, the collapsible dendrogram and collapsible indented tree . These were all created fairly easily by substituting the astronomical object data for the data in the original examples. (I say fairly easily as you need to get the hierarchy into the right format but more on that later.)

Easier to start with visualization of standard information structures and then move onto more exotic ones.

April 2, 2013

STScI’s Engineering and Technology Colloquia

Filed under: Astroinformatics,GPU,Image Processing,Knowledge Management,Visualization — Patrick Durusau @ 5:49 am

STScI’s Engineering and Technology Colloquia Series Webcasts by Bruce Berriman.

From the post:

Last week, I wrote a post about Michelle Borkin’s presentation on Astronomical Medicine and Beyond, part of the Space Telescope Science Institute’s (STScI) Engineering and Technology Colloquia Series. STScI archives and posts on-line all the presentations in this series. The talks go back to 2008 (with one earlier one dating to 2001), are generally given monthly or quarterly, and represent a rich source of information on many aspects of engineering and technology. The archive includes, where available, abstracts, Power Point Slides, videos for download, and for the more recent presentations, webcasts.

Definitely a astronomy/space flavor but also includes:

Scientific Data Visualization by Adam Bly (Visualizing.org, Seed Media Group).

Knowledge Retention & Transfer: What You Need to Know by Jay Liebowitz (UMUC).

Fast Parallel Processing Using GPUs for Accelerating Image Processing by Tom Reed (Nvidia Corporation).

Every field is struggling with the same data/knowledge issues, often using different terminologies or examples.

We can all struggle separately or we can learn from others.

Which approach do you use?

March 19, 2013

Knowledge Discovery from Mining Big Data [Astronomy]

Filed under: Astroinformatics,BigData,Data Mining,Knowledge Discovery — Patrick Durusau @ 10:17 am

Knowledge Discovery from Mining Big Data – Presentation by Kirk Borne by Bruce Berriman.

From the post:

My friend and colleague Kirk Borne, of George Mason University, is a specialist in the modern field of data mining and astroinformatics. I was delighted to learn that he was giving a talk on an introduction to this topic as part of the Space Telescope Engineering and Technology Colloquia, and so I watched on the webcast. You can watch the presentation on-line, and you can download the slides from the same page. The presentation is a comprehensive introduction to data mining in astronomy, and I recommend it if you want to grasp the essentials of the field.

Kirk began by reminding us that responding to the data tsunami is a national priority in essentially all fields of science – a number of nationally commissioned working groups have been unanimous in reaching this conclusion and in emphasizing the need for scientific and educational programs in data mining. The slides give a list of publications in this area.

Deeply entertaining presentation on big data.

The first thirty minutes or so are good for “big data” quotes and hype but the real meat comes at about slide 22.

Extends the 3 V’s (Volume, Variety, Velocity) to include Veracity, Variability, Venue, Vocabulary, Value.

And outlines classes of discovery:

  • Class Discovery
    • Finding new classes of objects and behaviors
    • Learning the rules that constrain the class boundaries
  • Novelty Discovery
    • Finding new, rare, one-in-a-million(billion)(trillion) objects and events
  • Correlation Discovery
    • Finding new patterns and dependencies, which reveal new natural laws or new scientific principles
  • Association Discovery
    • Finding unusual (improbable) co-occurring associations

A great presentation with references and other names you will want to follow on big data and astroinformatics.

March 11, 2013

Big Bang Meets Big Data

Filed under: Astroinformatics,BigData — Patrick Durusau @ 1:10 pm

Big Bang Meets Big Data

From the post:

Pretoria, South Africa, March 11, 2013: Square Kilometer Array (SKA) South Africa, a business unit of the country’s National Research Foundation is joining ASTRON, the Netherlands Institute for Radio Astronomy, and IBM in a four-year collaboration to research extremely fast, but low-power exascale computer systems aimed at developing advanced technologies for handling the massive amount of data that will be produced by the SKA, which is one of the most ambitious science projects ever undertaken.

The SKA is an international effort to build the world’s largest and most sensitive radio telescope, which is to be located in Southern Africa and Australia to help better understand the history of the universe. The project constitutes the ultimate Big Data challenge, and scientists must produce major advances in computing to deal with it. The impact of those advances will be felt far beyond the SKA project-helping to usher in a new era of computing, which IBM calls the era of cognitive systems.

FLICKR IMAGES: http://www.flickr.com/photos/ibm_research_zurich/sets/72157629212636619
VIDEO: https://www.youtube.com/watch?v=zU7KNRpn6co

When the SKA is completed, it will collect Big Data from deep space containing information dating back to the Big Bang more than 13 billion years ago. The aperture arrays and dishes of the SKA will produce 10 times the global internet traffic*, but the power to process all of this data as it is collected far exceeds the capabilities of the current state-of-the-art technology.

Just in case you are interested in “big data” writ large. 😉

There will be legacy data from optical and radio astronomy instruments, to say nothing of the astronomical literature, to curate along side this data tsunami.

March 2, 2013

Kepler Data Tutorial : What can you do?

Filed under: Astroinformatics,Data,Data Analysis — Patrick Durusau @ 4:55 pm

Kepler Data Tutorial : What can you do?

The Kepler mission was designed to hunt for planets orbiting foreign stars. When a planet passes between the Kepler satellite and its home star, the brightness of the light from the star dips.

That isn’t the only reason for changes in brightness but officially, Kepler has to ignore those other reasons. Unofficially, Kepler has encouraged professional and amateur astronomers to search the Kepler data for other reasons for light curves.

As I mentioned last year, Kepler Telescope Data Release: The Power of Sharing Data, a group of amateurs discovered the first system with four (4) suns and at least one (1) planet.

The Kepler Data Tutorial introduces you to analysis of this data set.

February 26, 2013

AstroML: data mining and machine learning for Astronomy

Filed under: Astroinformatics,Data Mining,Machine Learning — Patrick Durusau @ 1:53 pm

AstroML: data mining and machine learning for Astronomy by Jake Vanderplas, Alex Gray, Andrew Connolly and Zeljko Ivezic.

Description:

Python is currently being adopted as the language of choice by many astronomical researchers. A prominent example is in the Large Synoptic Survey Telescope (LSST), a project which will repeatedly observe the southern sky 1000 times over the course of 10 years. The 30,000 GB of raw data created each night will pass through a processing pipeline consisting of C++ and legacy code, stitched together with a python interface. This example underscores the need for astronomers to be well-versed in large-scale statistical analysis techniques in python. We seek to address this need with the AstroML package, which is designed to be a repository for well-tested data mining and machine learning routines, with a focus on applications in astronomy and astrophysics. It will be released in late 2012 with an associated graduate-level textbook, ‘Statistics, Data Mining and Machine Learning in Astronomy’ (Princeton University Press). AstroML leverages many computational tools already available available in the python universe, including numpy, scipy, scikit- learn, pymc, healpy, and others, and adds efficient implementations of several routines more specific to astronomy. A main feature of the package is the extensive set of practical examples of astronomical data analysis, all written in python. In this talk, we will explore the statistical analysis of several interesting astrophysical datasets using python and astroML.

AstroML at Github:

AstroML is a Python module for machine learning and data mining built on numpy, scipy, scikit-learn, and matplotlib, and distributed under the 3-clause BSD license. It contains a growing library of statistical and machine learning routines for analyzing astronomical data in python, loaders for several open astronomical datasets, and a large suite of examples of analyzing and visualizing astronomical datasets.

The goal of astroML is to provide a community repository for fast Python implementations of common tools and routines used for statistical data analysis in astronomy and astrophysics, to provide a uniform and easy-to-use interface to freely available astronomical datasets. We hope this package will be useful to researchers and students of astronomy. The astroML project was started in 2012 to accompany the book Statistics, Data Mining, and Machine Learning in Astronomy by Zeljko Ivezic, Andrew Connolly, Jacob VanderPlas, and Alex Gray, to be published in early 2013.

The book, Statistics, Data Mining, and Machine Learning in Astronomy by Zeljko Ivezic, Andrew Connolly, Jacob VanderPlas, and Alex Gray, is not yet listed by Princeton University Press. 🙁

I have subscribed to their notice service and will post a note when it appears.

February 18, 2013

VOStat: A Statistical Web Service… [Open Government, Are You Listening?]

Filed under: Astroinformatics,Statistics,Topic Maps,VOStat — Patrick Durusau @ 11:59 am

VOStat: A Statistical Web Service for Astronomers

From the post:

VOStat is a simple statistical web service that lets you analyze your data without the hassle of downloading or installing any software. VOStat provides interactive statistical analysis of astronomical tabular datasets. It is integrated into the suite of analysis and visualization tools associated with the Virtual Observatory (VO) through the SAMP communication system. A user supplies VOStat with a dataset and chooses among ~60 statistical functions, including data transformations, plots and summaries, density estimation, one- and two-sample hypothesis tests, global and local regressions, multivariate analysis and clustering, spatial analysis, directional statistics, survival analysis , and time series analysis. VOStat was developed by the Center for Astrostatistics (Pennsylvania State University).

The astronomical community has data sets that dwarf any open government data set and they have ~ 60 statistical functions?

Whereas in open government data, dumping data files to public access is considered being open?

The technology to do better already exists.

So, what is your explanation for defining openness as “data dumps to the web?”


PS: Have you ever thought about creating a data interface that hold mappings between data sets, such as a topic map would produce?

Would papering over agency differences in terminology assist users in taking advantage of their data sets? (Subject to disclosure that is happening.)

Would you call that a “TMStat: A Topic Map Statistical Web Service?”

(Disclosure of the basis for mapping being what distinguishes a topic map statistical web service from a fixed mapping between undefined column headers in different tables.)

February 8, 2013

VOPlot and Astrostat

Filed under: Astroinformatics,BigData — Patrick Durusau @ 5:16 pm

VOPlot and Astrostat Releases from VO-India.

From the post:

The VO-India team announces the release of VOPlot (v1.8). VOPlot is a tool for visualizing astronomical data. A full list of release features is available in the change log. The team has also released AstroStat (v1.0 Beta). AstroStat allows astronomers to use both simple and sophisticated statistical routines on large datasets. VO-India welcomes your suggestions and comments about the product at voindia@iucaa.ernet.in.

It’s the rainy season where I live so “virtual” astronomy is more common than “outside” astronomy. 😉

If you don’t do either one, the software is relevant to big data and its processing.

February 7, 2013

Seamless Astronomy

Filed under: Astroinformatics,Data,Data Integration,Integration — Patrick Durusau @ 10:33 am

Seamless Astronomy: Linking scientific data, publications, and communities

From the webpage:

Seamless integration of scientific data and literature

Astronomical data artifacts and publications exist in disjointed repositories. The conceptual relationship that links data and publications is rarely made explicit. In collaboration with ADS and ADSlabs, and through our work in conjunction with the Institute for Quantitative Social Science (IQSS), we are working on developing a platform that allows data and literature to be seamlessly integrated, interlinked, mutually discoverable.

Projects:

  • ADS All-SKy Survey (ADSASS)
  • Astronomy Dataverse
  • WorldWide Telescope (WWT)
  • Viz-e-Lab
  • Glue
  • Study of the impact of social media and networking sites on scientific dissemination
  • Network analysis and visualization of astronomical research communities
  • Data citation practices in Astronomy
  • Semantic description and annotation of scientific resources

A project with large amounts of data for integration.

Moreover, unlike the U.S. Intelligence Community, they are working towards data integration, not resisting it.

I first saw this in Four short links: 6 February 2013 by Nat Torkington.

« Newer PostsOlder Posts »

Powered by WordPress