Colorized Math Equations by Kalid Azad.
From the post:
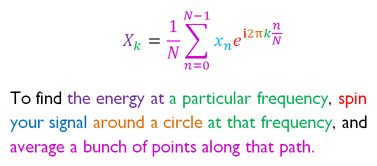
Years ago, while working on an explanation of the Fourier Transform, I found this diagram:
(source)
Argh! Why aren’t more math concepts introduced this way?
Most ideas aren’t inherently confusing, but their technical description can be (e.g., reading sheet music vs. hearing the song.)
My learning strategy is to find what actually helps when learning a concept, and do more of it. Not the stodgy description in the textbook — what made it click for you?
The checklist of what I need is ADEPT: Analogy, Diagram, Example, Plain-English Definition, and Technical Definition.
Here’s a few reasons I like the colorized equations so much:
- The plain-English description forces an analogy for the equation. Concepts like “energy”, “path”, “spin” aren’t directly stated in the equation.
- The colors, text, and equations are themselves a diagram. Our eyes bounce back and forth, reading the equation like a map (not a string of symbols).
- The technical description — our ultimate goal — is not hidden. We’re not choosing between intuition or technical, it’s intuition for the technical.
Of course, we still need examples to check our understanding, but 4/5 ain’t bad!
…
Azad includes a LaTeX template that he uses to create colorized math equations.
Consider the potential use of color + explanation for algorithms. Being mindful that use of color presents accessibility issues that will require cleverness on your part.
Another tool for your explanation quiver!