Steven Nelson writes of plans to block DC traffic:
…
Protest plans often are overambitious and it’s unclear if there will be enough bodies or sacrificial vehicles to block roadways, or people willing to risk arrest by doing so, though Carrefour says the group has coordinated housing for a large number of out-of-town visitors and believes preliminary signs point to massive turnout.
….(Anti-Trump Activists Plan Road-Blocking ‘Clusterf–k’ for Inauguration)
Looking at a map of the ninety-one (91) Metro rail stations, you may feel discouragement at Steven’s question of “enough bodies or sacrificial vehicles to block roadways….”
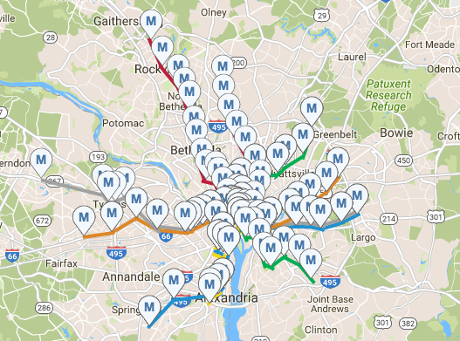
(Screenshot of map from https://www.wmata.com/schedules/maps/, Rail maps selected, 30 December 2016.)
Steve’s question and data science
Steven’s question is a good one and it’s one data science and public data can address.
For a feel of the larger problem of blockading all 91 Metro Rail stations, download and view/print this color map of Metro stations from the Washington Metropolitan Area Transit Authority.
For every station where you don’t see:

you will need to move protesters to those locations. As you already know, moving protesters in a coordinated way is a logistical and resource intensive task.
Just so you know, there are forty-three (43) stations with no parking lots.
Data insight: If you look at the Metro Rail map: color map of Metro stations, you will notice that all the stations with parking are located at the outer stations of the Metro.
That’s no accident. The Metro Rail system is designed to move people into and out of the city, which of necessity means, if you block access to the stations with parking lots, you have substantially impeded access into the city.
Armed with that insight, the total of Metro Rail stations to be blocked drops to thirty-eight (38). Not a great number but less than half of the starting 91.
Blocking 38 Metro Rail Stations Still Sounds Like A Lot
You’re right.
Blocking all 38 Metro Rail stations with parking lots is a protest organizer’s pipe dream.
It’s in keeping with seeing themselves as proclaiming “Peace! Land! Bread!” to huddled masses.
Data science and public data won’t help block all 38 stations but it can help with strategic selection of stations based on your resources.
Earlier this year, Dan Malouff posted: All 91 Metro stations, ranked by ridership.
If you put that data into a spreadsheet, eliminate the 43 stations with no parking lots, you can then sort the parking lot stations by their daily ridership.
Moreover, you can keep a running total of the riders in order to calculate the percentage of Metro Rail riders blocked (assuming 100% blockage) as you progress down the list of stations.
The total daily ridership for those stations is 183,535.
You can review my numbers and calculations with a copy of Metro-Rail-Ridership-Station-Percentage.xls
Strategic Choice of Metro Rail Stations
Consider this excerpt from the spreadsheet:
| Station | Avg. # | Count | % of Total. |
|---|---|---|---|
| Silver Spring | 12269 | 12269 | 6.68% |
| Shady Grove | 11732 | 24001 | 13.08% |
| Vienna | 10005 | 34006 | 18.53% |
| Fort Totten | 7543 | 41549 | 22.64% |
| Wiehle | 7306 | 48855 | 26.62% |
| New Carrollton | 7209 | 56064 | 30.55% |
| Huntington | 7002 | 63066 | 34.36% |
| Franconia-Springfield | 6821 | 69887 | 38.08% |
| Anacostia | 6799 | 76686 | 41.78% |
| Glenmont | 5881 | 82567 | 44.99% |
| Greenbelt | 5738 | 88305 | 48.11% |
| Rhode Island Avenue | 5727 | 94032 | 51.23% |
| Branch Avenue | 5449 | 99481 | 54.20% |
| Takoma | 5329 | 104810 | 57.11% |
| Grosvenor | 5206 | 110016 | 59.94% |
The average ridership as reported by Dan Malouff in All 91 Metro stations, ranked by ridership comes to: 652,183. Of course, that includes people who rode from one station to transfer to another one. (I’m investigating ways/data to separate those out.)
As you can see, blocking only the first four stations Silver Spring, Shady Grove, Vienna and Fort Totten, is almost 23% of the traffic from stations with parking lots. It’s not quite 10% of the total ridership on a day but certainly noticeable.
The other important point to notice is that with public data and data science, the problem has been reduced from 91 potential stations to 4.
A reduction of more than an order of magnitude.
Not a bad payoff for using public data and data science.
That’s all I have for you now, but I can promise that deeper analysis of metro DC public data sets reveals event locations that impact both the “beltway” as well as Metro Rail lines.
More on that and maps for the top five (5) locations, a little over 25% of the stations with parking traffic, next week!
If you can’t make it to #DisruptJ20 protests, want to protest early or want to support research on data science and protests, consider a donation.
Disclaimer: I am exploring the potential of data science for planning protests. What you choose to do or not to do and when, is entirely up to you.