Visualizing Chess Data With ggplot by Joshua Kunst.
Sales of traditional chess sets peak during the holiday season. The following graphic does not include sales of chess gadgets, chess software, or chess computers:
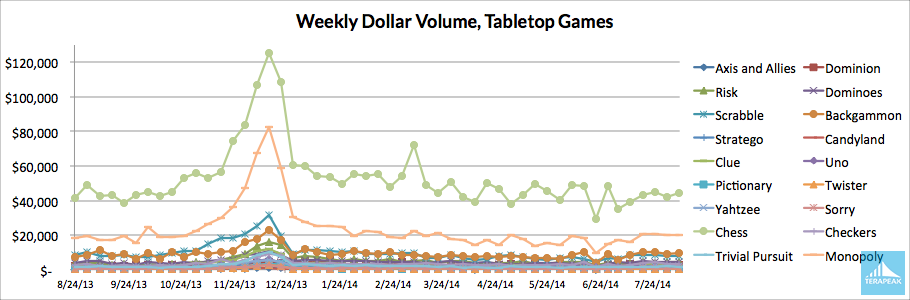
(Source: Terapeak Trends: Which Tabletop Games Sell Best on eBay? by Aron Hsiao.)
Joshua’s post is a guide to using and visualizing chess data under the following topics:
- The Data
- Piece Movements
- Survival rates
- Square usage by player
- Distributions for the first movement
- Who captures whom
Joshua is using public chess data but it’s just a short step to using data from your own chess games or those of friends from your local chess club. 😉
Visualize the play of openings, defenses, players + openings/defenses, you are limited only by your imagination.
Give a chess friend a visualization they can’t buy in any store!
PS: Check out: rchess a Chess Package for R also by Joshua Kunst.
I first saw this in a tweet by Christophe Lalanne.