The 27 Worst Charts Of All Time by Walter Hickey.
Walter starts his post with:
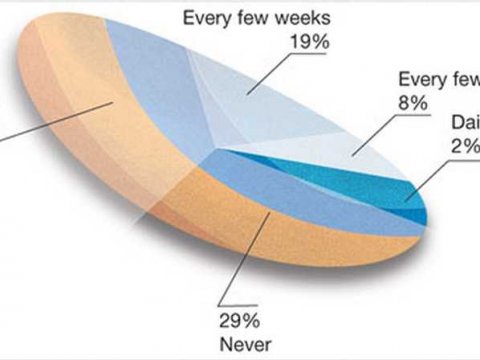
Impressively bad. Yes?
See Walter’s post for twenty-six (26) other examples of what not to do.
The 27 Worst Charts Of All Time by Walter Hickey.
Walter starts his post with:
Impressively bad. Yes?
See Walter’s post for twenty-six (26) other examples of what not to do.
No comments yet.
RSS feed for comments on this post.
Sorry, the comment form is closed at this time.
Powered by WordPress