Integer sequence discovery from small graphs by Travis Hoppe and Anna Petrone.
Abstract:
We have exhaustively enumerated all simple, connected graphs of a finite order and have computed a selection of invariants over this set. Integer sequences were constructed from these invariants and checked against the Online Encyclopedia of Integer Sequences (OEIS). 141 new sequences were added and 6 sequences were appended or corrected. From the graph database, we were able to programmatically suggest relationships among the invariants. It will be shown that we can readily visualize any sequence of graphs with a given criteria. The code has been released as an open-source framework for further analysis and the database was constructed to be extensible to invariants not considered in this work.
See also:
Encyclopedia of Finite Graphs “Set of tools and data to compute all known invariants for simple connected graphs”
Simple-connected-graph-invariant-database “The database file for the Encyclopedia of Finite Graphs (simple connected graphs up to order 10)”
From the paper:
A graph invariant is any property that is preserved under isomorphism. Invariants can be simple binary properties (planarity), integers (automorphism group size), polynomials (chromatic polynomials), rationals (fractional chromatic numbers), complex numbers (adjacency spectra), sets (dominion sets) or even graphs themselves (subgraph and minor matching).
Hmmm, perhaps an illustration, also from the paper, might explain better:
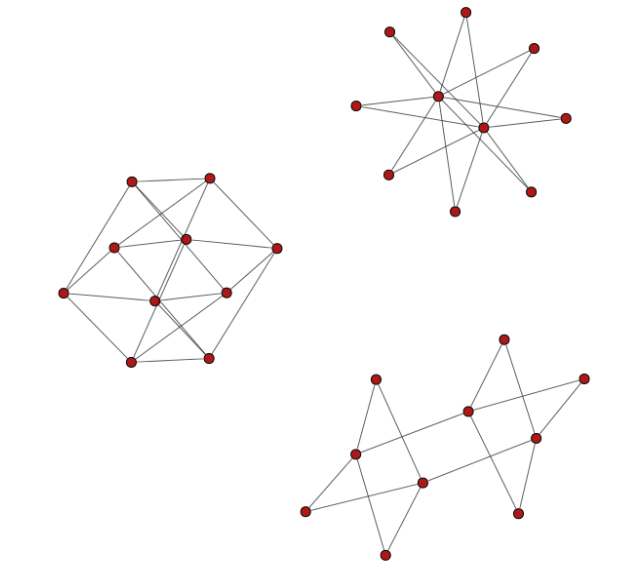
Figure 1: An example query to the Encyclopedia using speci c invariant conditions. The command python
viewer.py 10 -i is bipartite 1 -i is integral 1 -i is eulerian 1displays the three graphs that are simultaneously bipartite, integral and Eulerian with ten vertices.
For analysis of “cells” of your favorite evil doers you can draw higgly-piggly graphs with nodes and arcs on a whiteboard or you can take advantage of formal analysis of small graphs, research on the organization of small groups, and the history of that particular group. With the higgly-piggly approach you risk missing connections that aren’t possible to represent from your starting point.