Linux Performance Analysis and Tools: Brendan Gregg’s Talk at SCaLE 11x by Deirdré Straughan.
From the post:
The talk is about Linux Performance Analysis and Tools: specifically, observability tools and the methodologies to use them. Brendan gave a quick tour of over 20 Linux performance analysis tools, including advanced perf and DTrace for Linux, showing the reasons for using them. He also covered key methodologies, including a summary of the USE Method, to demonstrate best practices in using them effectively. There are many areas of the system that people don’t know to check, which are worthwhile to at least know about, especially for serious performance issues where you don’t want to leave any stone unturned. These methodologies – and exposure to the toolset – will help you understand why and how to do this. Brendan also introduced a few new of these key performance tuning tools during his presentation.
….
Be sure to watch the recorded presentation. You will also find this very cool graphic by Brendan Gregg.
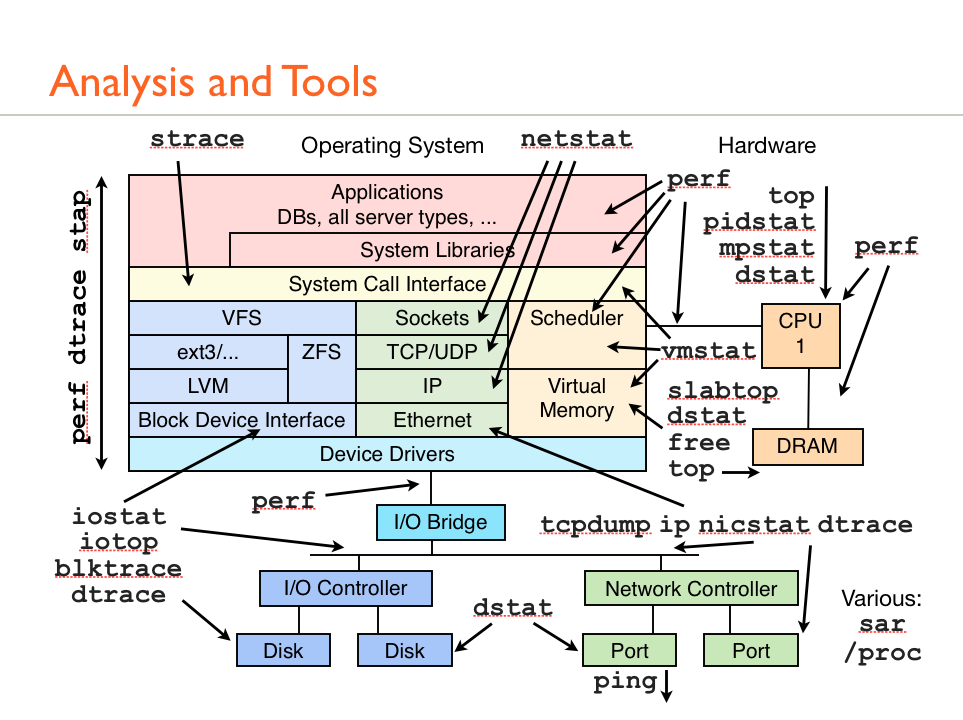
It’s suitable for printing and hanging on the wall as a quick reference.
No doubt you recognize some of these commands, but how many switches can you name for each one and what relationship, if any, does the information from one relate to another?
I first saw this in a tweet by nixCraft Linux Blog.