Easy data maps with R: the choroplethr package by David Smith.
From the post:
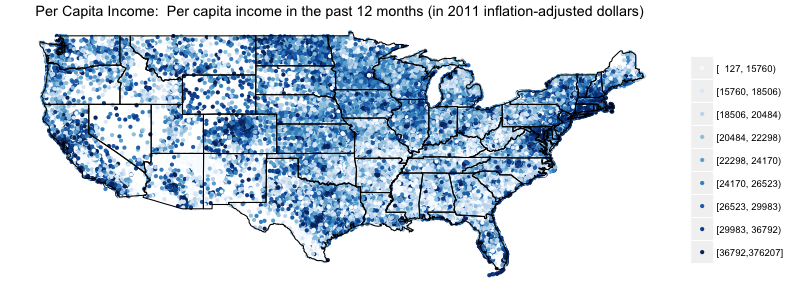
Choropleth maps are a popular way of representing spatial or geographic data, where a statistic of interest (say, income, voting results or crime rate) are color-coded by region. R includes all of the necessary tools for creating choropleth maps, but Trulia's Ari Lamstein has made the process even easier with the new choroplethr package now available on github. With couple of lines of code, you can easily convert a data frame of values coded by country, state, county or zip code into a choropleth like this:
This sounds like a great tool for the General Social Survey data in Social Science Dataset Prize!