For Example by Mike Bostock.
I am a big fan of examples. Not a surprise, right? If you follow me on Twitter, or my projects over the last few years (or asked D3 questions on Stack Overflow), you’ve likely seen some of my example visualizations, maps and explanations.
I use examples so often that I created bl.ocks.org to make it easier for me to share them. It lets you quickly post code and share examples with a short URL. Your code is displayed below; it’s view source by default. And it’s backed by GitHub Gist, so examples have a git repository for version control, and are forkable, cloneable and commentable.
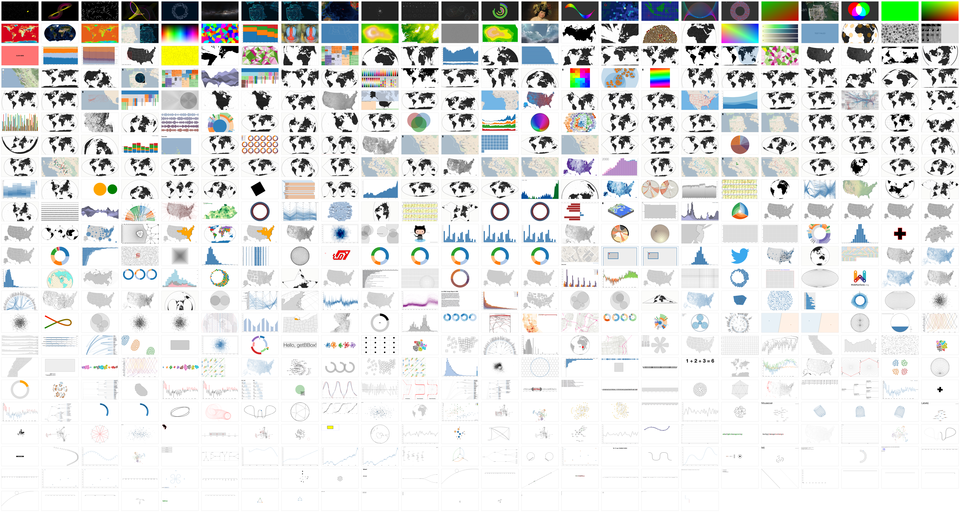
I initially conceived this talk as an excuse to show all my examples. But with more than 600, I’d have only 4.5 seconds per slide. A bit overwhelming. So instead I’ve picked a few favorites that I hope you’ll enjoy. You should find this talk entertaining, even if it fails to be insightful.
This talk does have a point, though. Examples are lightweight and informal; they can often be made in a few minutes; they lack the ceremony of polished graphics or official tools. Yet examples are a powerful medium of communication that is capable of expressing big ideas with immediate impact. And Eyeo is a unique opportunity for me to talk directly to all of you that are doing amazing things with code, data and visualization. So, if I can accomplish one thing here, it should be to get you to share more examples. In short, to share my love of examples with you.
Mike’s post is full of excellent D3 graphics. You owe it to yourself to review all of them in full.
I first saw this at Nat Torkington’s Four short links: 11 June 2013.