Filtergraph: A Web-based Data Visualization Application by Dan Burger.
From the post:
Datasets.
If you work in astronomy, chances are you have them.
They are hardly the romantic vision that you had when you decided to go into astronomy: staring through a telescope in the middle of nowhere, surrounded by the stillness of the night sky and the sound of crickets in every direction, and updating your status on Facebook every time you find a new exoplanet.
They are the kind that arrive in your inbox as an ASCII file with thousands of lines of data. How are you going to visualize and make sense of it? Sure, you could fire up IDL, read in the data, and issue some plotting commands. But what if you wanted to quickly filter the data according to various criteria across multiple variables? What if you need to do some transformations on the data and then visualize the result? What if you want to share these data with your collaborators for on-the-fly visualization and discussion, and not just keep forwarding that big ASCII file around?
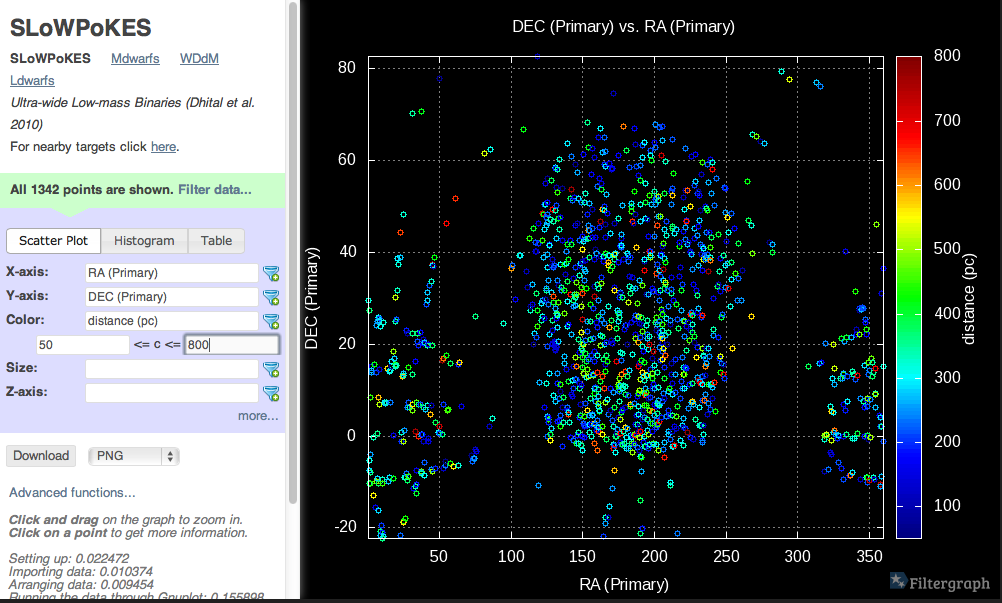
Fortunately for you there’s Filtergraph: a web application that allows you to upload data from your project and instantly generate a web portal that can build graphs and tables on-the-fly based on your dataset. Filtergraph can handle datasets of up to 3 million lines and is flexible enough to build sophisticated graphs from such large datasets in seconds. If you want to create a scatter plot of Teff versus flux, Filtergraph can do that. If you wanted something more complex, say, a scatter plot of Teff vs. log(flux), color-coded by [Fe/H] and symbol size scaled to the distance, for the stars that are between 8 and 18 hrs in RA. Filtergraph can do that as well, with just a few clicks. There is no need to write many lines of IDL code full of where commands.
I know you would have to hunt for an ASCII file of less than 3 million lines but they do exist. 😉
This could be a very “lite” way to share a dataset for visualization.