Arc Diagrams in R: Les Miserables by Gaston Sanchez.
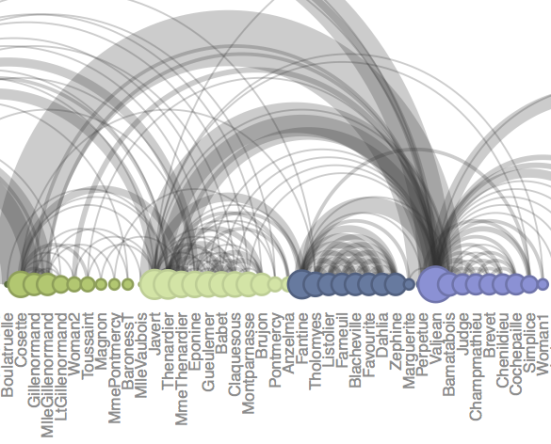
In this post we will talk about the R package “arcdiagram” for plotting pretty arc diagrams like the one below:
Arc Diagrams
An arc diagram is a graphical display to visualize graphs or networks in a one-dimensional layout. The main idea is to display nodes along a single axis, while representing the edges or connections between nodes with arcs. One of the disadvantages of arc diagrams is that they may not provide the overall structure of the network as effectively as a two-dimensional layout; however, with a good ordering of nodes, better visualizations can be achieved making it easy to identify clusters and bridges. Further, annotations and multivariate data can easily be displayed alongside nodes.
For exploring a domain, exploring associations for declaration of types, this could be a very handy tool.