I saw a tweet of Emil Eifrem’s Neo4j or: why graph dbs kick ass from 2008 yesterday.
That’s roughly sixteen (16) years ago in Internet time.
What has changed/stayed the same?
To get you started:
- Slide 2: “Community Experimentation”
Has only gotten richer. Approximately 20 graph DB projects, not to mention more specialized graph software.
- Slide 4: “Trend 1: Data is getting more connected”
This is a current “big lie” of IT. Users have always seen data as richly connected. Computer representation of connectedness has been and is impoverished. Let’s put the blame where it belongs.
- Slide 5: “Trend 2: …and more semi-structured”
Good thing we didn’t have journals, technical papers, newspapers, books, speeches, radio/TV back in the old days. Would have had “semi-structured” data.
- Slide 6: Performance vs. Information Complexity
The opposite of “Smiling Bob’s” chart in the Enzyte commercial. It’s a funny chart (in both cases) but more for amusement than serious discussion. (Unless you are an Enzyte customer of course.)
- Slide 8: Whiteboard friendly?
I am not sure what Emil has against blackboards. Or non-pictograph writing systems.

- Slide 11: Food Web of North Atlantic
If you like food webs, see: Marine Fisheries Food Webs, which is part of the online book: Our Ocean Planet: Oceanography in the 21st Century by Robert Stewart. (Warning: Oceanography isn’t my field. You need to ask a librarian about using this as a source.)
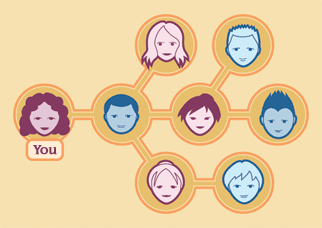
- Slide 12: A Social Graph
I would add an STD graph:

- Slide 43 Neo4j architecture gotchas
- Focus on the domain (whiteboard friendly – domain first development)
- Purpose of the domain layer:
- “an adaptation of the generic node space to a type-safe, object-oriented abstraction expressed in the vocabulary of our domain.” (!)
I appreciate the candor but don’t “get” the gotcha?
How is the domain layer binding/limiting my use of the graph that is created?
A little larger helping of explanation please.
(Ah! From slide 14 Shut up and show us the code! to slide 28 Bonus Code: domain model
Domain model means Nodes, properties, traversals, all hard coded. Yikes! Fortunately, at least for nodes/properties, can update with Cypher)
What else would you update?
Perhaps we need a date property on nodes that represent resources on the Internet?
Any search brings up something old, something new, something borrowed and something blue.
Some offer sort by date/relevance and other “facets” but that’s not really the point is it?
I don’t want to do data mining, I want to do data finding. Not the same thing.
Perhaps graphs can capture data already found and preserve it for the next searcher?
Comments/suggestions?
[…] Qi4j in part because Emil Eifrem covers it in his “kicking ass” slides on […]
Pingback by Qi4j™ « Another Word For It — June 9, 2012 @ 7:17 pm