Another Word For It Patrick Durusau on Topic Maps and Semantic Diversity

November 25, 2014

Documents Released in the Ferguson Case

Filed under: Data Mining,Ferguson,Text Mining — Patrick Durusau @ 4:15 pm

Documents Released in the Ferguson Case (New York Times)

The New York Times has posted the following documents from the Ferguson case:

  • 24 Volumes of Grand Jury Testimony
  • 30 Interviews of Witnesses by Law Enforcement Officials
  • 23 Forensic and Other Reports
  • 254 Photographs

Assume you are interested in organizing these materials for rapid access and cross-linking between them.

What are your requirements?

  1. Accessing Grand Jury Testimony by volume and page number?
  2. Accessing Interviews of Witnesses by report and page number?
  3. Linking people to reports, testimony and statements?
  4. Linking comments to particular photographs?
  5. Linking comments to a timeline?
  6. Linking Forensic reports to witness statements and/or testimony?
  7. Linking physical evidence into witness statements and/or testimony?
  8. Others?

It’s a lot of material so which requirements, these or others, would be your first priority?

It’s not a death march project but on the other hand, you need to get the most valuable tasks done first.

Suggestions?

The Sight and Sound of Cybercrime

Filed under: Cybersecurity,Graphics,Visualization — Patrick Durusau @ 2:56 pm

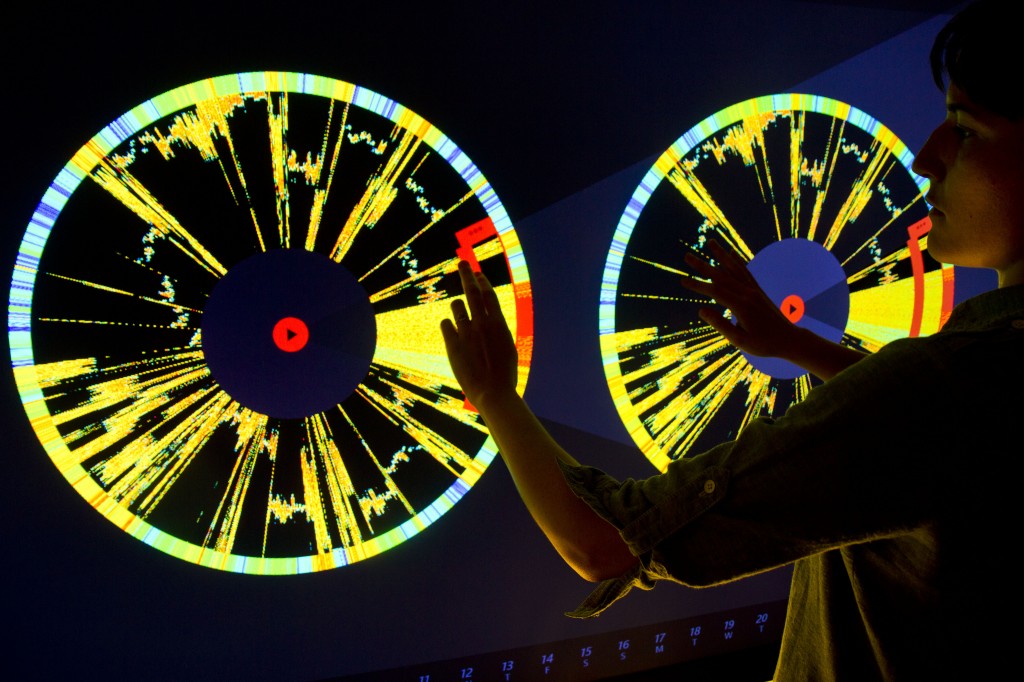
The Sight and Sound of Cybercrime Office for Creative Research.

From the post:

specimen box graphic

You might not personally be in the business of identity theft, spam delivery, or distributed hacking, but there’s a decent chance that your computer is. “Botnets” are criminal networks of computers that, unbeknownst to their owners, are being put to use for any number of nefarious purposes. Across the globe, millions of PCs have been infected with software that conscripts them into one of these networks, silently transforming these machines into accomplices in illegal activities and putting their users’ information at risk.

Microsoft’s Digital Crimes Unit has been tracking and neutralizing these threats for several years. In January, DCU asked The Office for Creative Research to explore novel ways to visualize botnet activity. The result is Specimen Box, a prototype exploratory tool that allows DCU’s investigators to examine the unique profiles of various botnets, focusing on the geographic and time-based communication patterns of millions of infected machines.

Specimen Box enables investigators to study a botnet the way a naturalist might examine a specimen collected in the wild: What are its unique characteristics? How does it behave? How does it propagate itself? How is it adapting to a changing environment?

Specimen Box combines visualization and sonification capabilities in a large-screen, touch-based application. Investigators can see and hear both live activity and historical ‘imprints’ of daily patterns across a set of 15 botnets. Because every botnet has its own unique properties, the visual and sonic portraits generated by the tool offer insight into the character of each individual network.

Very impressive graphic capabilities with several short video clips.

Would have been more impressive if the viewer was clued in on what the researchers were attempting to discover in the videos.

One point that merits special mention:

By default, the IP addresses are sorted around the circle by the level of communication activity. The huge data set has been optimized to allow researchers to instantly re-sort the IPs by longitude or by similarity. “Longitude Sort Mode” arranges the IPs geographically from east to west, while “Similarity Sort Mode” groups together IPs that have similar activity patterns over time, allowing analysts to see which groups of machines within the botnet are behaving the same way. These similarity clusters may represent botnet control groups, research activity from universities or other institutions, or machines with unique temporal patterns such as printers.

Think of “Similarity Sort Mode” as a group subject and this starts to resemble display of topics that have been merged* according to different criteria, in response to user requests.

*By “merged” I mean displayed as though “merged” in the TMDM sense of operations on a file.

November 24, 2014

Wandora 2014-11-24

Filed under: Topic Map Software,Wandora — Patrick Durusau @ 6:05 pm

Wandora 2014-11-24

From the homepage:

New Wandora release (2014-11-24) features Watson translation API support, Alchemy face detection API extractor, enhanced occurrence view in Traditional topic panel. The release adds Spanish, German and French as a default languages for topic occurrences and names. The release contains numerous smaller enhancements and fixes.

Download
ChangeLog

If you don’t know Wandora:

Wandora is a tool for people who collect and process information, especially networked knowledge and knowledge about WWW resources. With Wandora you can aggregate and combine information from various different sources. You can manipulate the collected knowledge flexible and efficiently, and without programming skills. More generally speaking Wandora is a general purpose information extraction, management and publishing application based on Topic Maps and Java. Wandora suits well for constructing and maintaining vocabularies, ontologies and information mashups. Application areas include linked data, open data, data integration, business intelligence, digital preservation and data journalism. Wandora’s license is GNU GPL. Wandora application is developed actively by a small number of experienced software developers. We call ourselves as the Wandora Team.

The download zip file has the data of the release in its name, making it easy to keep multiple versions of Wandora on one machine. You can try a new release without letting go of your current one. Thanks Wandora team!

“Groundbreaking” state spyware targeted airlines and energy firms

Filed under: Cybersecurity,Security — Patrick Durusau @ 5:43 pm

“Groundbreaking” state spyware targeted airlines and energy firms by David Meyer.

From the post:

The security firm Symantec has detailed a highly sophisticated piece of spyware called Regin, which it reckons is probably a key intelligence-gathering tool in a nation state’s digital armory. Its targets have included individuals, small businesses, telecommunications firms, energy firms, airlines, research institutes and government agencies.

In a whitepaper, Symantec described Regin as “groundbreaking and almost peerless.” Regin comprises six stages, each triggered by the last, with each (barring the initial infection stage) remaining encrypted until called upon by the last. It can deploy modules that are “tailored to the target.” According to the firm, it was used between 2008 and 2011, when it disappeared before a new version appeared in 2013.

See David’s post for the details and the whitepaper by Symantec for even more details, including detection of infection.

Suspects?

UK, US behind Regin malware, attacked European Union networks.

I can’t speak for anyone other than myself but if governments want their citizens to live in a fishbowl, turnabout seems like fair play.

Wouldn’t it be interesting to see non-governmental Regin-like spyware that operated autonomously and periodically dumped collected data to random public upload sites?

Friedrich Nietzsche and his typewriter – a Malling-Hansen Writing Ball

Filed under: Interface Research/Design,Philosophy — Patrick Durusau @ 5:01 pm

Friedrich Nietzsche and his typewriter – a Malling-Hansen Writing Ball

keyboard of typing ball

typing ball, full shot

From the webpage:

The most prominent owner of a writing ball was probably the German philosopher, Friedrich Nietzsche (1844-1900). In 1881, when he was almost blind, Nietzsche wanted to buy a typewriter to enable him to continue his writing, and from letters to his sister we know that he personally was in contact with “the inventor of the typewriter, Mr Malling-Hansen from Copenhagen”. He mentioned to his sister that he had received letters and also a typewritten postcard as an example.

Nietzsche received his writing ball in 1882. It was the newest model, the portable tall one with a colour ribbon, serial number 125, and several typescripts are known to have been written by him on this writing ball. We know that Nietzsche was also familiar with the newest Remington typewriter (model 2), but as he wanted to buy a portable typewriter, he chose to buy the Malling-Hansen writing ball, as this model was lightweight and easy to carry — one might say that it was the “laptop” of that time.

Unfortunately Nietzsche wasn’t totally satisfied with his purchase and never really mastered the use of the instrument. Until now, many people have tried to understand why Nietzsche did not make more use of it, and a number of theories have been suggested such as that it was an outdated and poor model, that it was possible to write only upper case letters, etc. Today we can say for certain that all this is only speculation without foundation.

The writing ball was a solidly constructed instrument, made by hand and equipped with all the features one would expect of a modern typewriter.

You can now read the details about the Nietzsche writing ball in a book, “Nietzches Schreibkigel”, by Dieter Eberwein, vice-president of the International Rasmus Malling-Hansen Society, published by “Typoscript Verlag”. In it, Eberwein tells the true story about Nietzche’s writing ball based upon thorough investigation and restoration of the damaged machine.

If you think of Nietzsche‘s typing ball as an interface, it is certainly different from the keyboards of today.

I am not sure I could re-learn the “home” position for my fingers but certainly would be willing to give it a try.

Not as far fetched as you might think, a typing ball. Matt Adereth posted this image of a prototype typing ball:

proto-type typing ball

Where would you put the “nub” and “buttons” for a pointing device? Curious about the ergonomics. If anyone decides to make prototypes, put my name down as definitely interested.

I saw this earlier today in a tweet by Vincent Zimmer although I already aware of
Nietzsche’s typing ball.

Clojure is still not for geniuses

Filed under: Clojure,Functional Programming,Programming — Patrick Durusau @ 4:32 pm

Clojure is still not for geniuses (You — yes, you, dummy — could be productive in Clojure today.) by Adam Bard.

From the post:

The inspiration for the article I wrote last week entitled Clojure is not for geniuses was inspired by Tommy Hall‘s talk at Euroclojure 2014, wherein he made an offhand joke about preferring Clojure for its minimal syntax, as he possesses a small brain (both his blog and his head suggest this assertion is false). I had intended to bring this up with the original article, but got sidetracked talking about immutable things and never got back around to it. Here I’d like to address that, along with some discussion that arose in various forums after the first article.

This article is not about how Clojure is great. I mean, it is, but I’d like to focus on the points that make it an accessible and practical language, without any faffing about with homoiconicity and macros and DSLs and all that.

Today’s all about illustrating some more ways in which I believe our good comrade Clojure can appeal to and empower the proletariat in ways that certain other languages can’t, through the power of simplicity.

This is a great post but I would like to add something to:

So why isn’t everyone using it?

That’s the big question. Clojure has grown immensely in popularity, but it’s still not a household name. There are a lot of reasons for that – mainstreamn languages have been around a lot longer, naturally, and obviously people are still producing software in them.

That’s not a big question. Think about the years people have invested in C, COBOL, Fortran, C++ and ask yourself: Do I prefer programming where I am comfortable or do I prefer something new and not familiar. Be honest now.

The other thing to consider is the ongoing investment in programs written in C/C++, COBOL, etc. Funders don’t find risk of transition all that attractive, even if a new language has “cool” features. They are interested in results, not how you got them.

The universe of programs needs to expand to create space for Clojure to gain marketshare. The demand for concurrency is a distinct possibility. The old software markets will remain glutted with C/C++, etc., for the foreseeable future. But that’s ok, older programmers need something to fall back on.

Pressing forward on Clojure’s strengths, such as simplicity and concurrency and producing results that other current languages can’t match is the best way to increase Clojure’s share of an expanding market. (Or to put it in the negative, who wants to worry about a non-concurrent and slowly dying market?)

Announcing Apache Hive 0.14

Filed under: Hadoop,Hive — Patrick Durusau @ 3:51 pm

Announcing Apache Hive 0.14 by Gunther Hagleitner.

From the post:

While YARN has allowed new engines to emerge for Hadoop, the most popular integration point with Hadoop continues to be SQL and Apache Hive is still the defacto standard. Although many SQL engines for Hadoop have emerged, their differentiation is being rendered obsolete as the open source community surrounds and advances this key engine at an accelerated rate.

Last week, the Apache Hive community released Apache Hive 0.14, which includes the results of the first phase in the Stinger.next initiative and takes Hive beyond its read-only roots and extends it with ACID transactions. Thirty developers collaborated on this version and resolved more than 1,015 JIRA issues.

Although there are many new features in Hive 0.14, there are a few highlights we’d like to highlight. For the complete list of features, improvements, and bug fixes, see the release notes.

If you have been watching the work on Spark + Hive: Apache Hive on Apache Spark: The First Demo, then you know how important Hive is to the Hadoop ecosystem.

The highlights:

Transactions with ACID semantics (HIVE-5317)

Allows users to modify data using insert, update and delete SQL statements. This provides snapshot isolation and uses locking for writes. Now users can make corrections to fact tables and changes to dimension tables.

Cost Base Optimizer (CBO) (HIVE-5775)

Now the query compiler uses a more sophisticated cost based optimizer that generates query plans based on statistics on data distribution. This works really well with complex joins and joins with multiple large fact tables. The CBO generates busy plans that execute much faster.

SQL Temporary Tables (HIVE-7090)

Temporary tables exist in scratch space that goes away when the user session disconnects. This allows users and BI tools to store temporary results and further process that data with multiple queries.

Coming Next in Stinger.next: Sub-Second Queries

After Hive 0.14, we’re planning on working with the community to deliver sub-second queries and SQL:2011 Analytics coverage in Hive. We also plan to work on Hive-Spark integration for machine learning and operational reporting with Hive streaming ingest and transactions.

Hive is an example of how an open source project should be supported.

Writing an R package from scratch

Filed under: Programming,R — Patrick Durusau @ 3:30 pm

Writing an R package from scratch by Hilary Parker.

From the post:

As I have worked on various projects at Etsy, I have accumulated a suite of functions that help me quickly produce tables and charts that I find useful. Because of the nature of iterative development, it often happens that I reuse the functions many times, mostly through the shameful method of copying the functions into the project directory. I have been a fan of the idea of personal R packages for a while, but it always seemed like A Project That I Should Do Someday and someday never came. Until…

Etsy has an amazing week called “hack week” where we all get the opportunity to work on fun projects instead of our regular jobs. I sat down yesterday as part of Etsy’s hack week and decided “I am finally going to make that package I keep saying I am going to make.” It took me such little time that I was hit with that familiar feeling of the joy of optimization combined with the regret of past inefficiencies (joygret?). I wish I could go back in time and create the package the first moment I thought about it, and then use all the saved time to watch cat videos because that really would have been more productive.

This tutorial is not about making a beautiful, perfect R package. This tutorial is about creating a bare-minimum R package so that you don’t have to keep thinking to yourself, “I really should just make an R package with these functions so I don’t have to keep copy/pasting them like a goddamn luddite.” Seriously, it doesn’t have to be about sharing your code (although that is an added benefit!). It is about saving yourself time. (n.b. this is my attitude about all reproducibility.)

A reminder that well organized functions, like documentation, can be a benefit to its creator as well as others.

Organization: It’s not just for the benefit of others.

I try to not leave myself cryptic or half-written notes anymore. 😉

rvest: easy web scraping with R

Filed under: Programming,R,Web Scrapers — Patrick Durusau @ 3:18 pm

rvest: easy web scraping with R

rvest is new package that makes it easy to scrape (or harvest) data from html web pages, by libraries like beautiful soup. It is designed to work with magrittr so that you can express complex operations as elegant pipelines composed of simple, easily understood pieces.

Great overview of rvest and its use for web scraping in R.

Axiom: You will have web scraping with you always. 😉 Not only because we are lazy, but disorderly to boot.

At CRAN: http://cran.r-project.org/web/packages/rvest/index.html (Author: Hadley Wickham)

Jean Yang on An Axiomatic Basis for Computer Programming

Filed under: Logic,Programming,Proof Theory — Patrick Durusau @ 2:56 pm

Jean Yang on An Axiomatic Basis for Computer Programming (slide deck)

From the description:

Our lives now run on software. Bugs are becoming not just annoyances for software developers, but sources of potentially catastrophic failures. A careless programmer mistake could leak our social security numbers or crash our cars. While testing provides some assurance, it is difficult to test all possibilities in complex systems–and practically impossible in concurrent systems. For the critical systems in our lives, we should demand mathematical guarantees that the software behaves the way the programmer expected.

A single paper influenced much of the work towards providing these mathematical guarantees. C.A.R. Hoare’s seminal 1969 paper “An Axiomatic Basis for Computer Programming” introduces a method of reasoning about program correctness now known as Hoare logic. In this paper, Hoare provides a technique that 1) allows programmers to express program properties and 2) allows these properties to be automatically checked. These ideas have influenced decades of research in automated reasoning about software correctness.

In this talk, I will describe the main ideas in Hoare logic, as well as the impact of these ideas. I will talk about my personal experience using Hoare logic to verify memory guarantees in an operating system. I will also discuss takeaway lessons for working programmers.

The slides are impressive enough! I will be updating this post to include a pointer to the video when posted.

How important is correctness of merging in topic maps?

If you are the unfortunate individual whose personal information includes an incorrectly merged detail describing you as a terrorist, correctness of merging may be very important, at least to you.

The same would be true for information systems containing arrest warrants, bad credit information, incorrect job histories, education records, and banking records, just to mention a few.

What guarantees can you provide clients concerning merging of data in your topic maps?

Or is that the client and/or victim’s problem?

How to Make a Better Map—Using Neuroscience

Filed under: Mapping,Maps — Patrick Durusau @ 2:30 pm

How to Make a Better Map—Using Neuroscience by Laura Bliss.

From the post:

The neuroscience of navigation has been big news lately. In September, Nobel Prizes went to the discoverers of place cells and grid cells, the neurons responsible for our mental maps and inner GPS. That’s on top of an ever-growing pile of fMRI research, where scientists connect regions of the brain to specific navigation processes.

But the more we learn about how our bodies steer from A to B, are cartographers and geographers listening up? Is the science of wayfinding finding its way into the actual maps we use?

It’s beginning to. CityLab spoke to three prominent geographers who are thinking about the perceptual, cognitive, and neurological processes that go on when a person picks up a web of lines and words and tries to use it—or, the emerging science of map-making.

The post tackles questions like:

How do users make inferences from the design elements on a map, and how can mapmakers work to make their maps more perceptually salient?

But her current research looks at not just how the brain correlates visual information with thematic relevance, but how different kinds of visualization actually affect decision-making.

“I’m not interested in mapping the human brain,” she says. “A brain area in itself is only interesting to me if it can tell me something about how someone is using a map. And people use maps really differently.”

Ready to put your map design on more than an ad hoc basis? No definite answers in Laura’s post but several pointers towards exploration yet to be done.

I first saw this in a tweet by Greg Miller.

It seemed like a good idea at the time

Filed under: Communication,Programming — Patrick Durusau @ 11:38 am

It seemed like a good idea at the time by Tessa Thornton.

From the post:

I was reading through some of the on-boarding docs my first day at Shopify, and came across a reference to something called the “Retrospective Prime Directive”, which really appealed to me (initially because Star Trek):

Regardless of what we discover, we understand and truly believe that everyone did the best job they could, given what they knew at the time, their skills and abilities, the resources available, and the situation at hand.

This made me think of something I’ve been reminding myself of a lot over the past year, which started out as a joke but I’ve come to think of it as my own directive when it comes to reading other people’s code: It probably seemed like a good idea at the time.

Tessa’s point that understanding what someone was trying to accomplish, as opposed to mocking their efforts, is more productive is useful.

Not only can it lead to deeper understanding of the problem but you won’t waste time complaining about your predecessors being idiots.

I first saw this in a tweet by Julie Evans.

November 23, 2014

The Debunking Handbook

Filed under: Rhetoric,Science — Patrick Durusau @ 7:52 pm

The Debunking Handbook by John Cook, Stephan Lewandowsky.

From the post:

The Debunking Handbook, a guide to debunking misinformation, is now freely available to download. Although there is a great deal of psychological research on misinformation, there’s no summary of the literature that offers practical guidelines on the most effective ways of reducing the influence of myths. The Debunking Handbook boils the research down into a short, simple summary, intended as a guide for communicators in all areas (not just climate) who encounter misinformation.

The Handbook explores the surprising fact that debunking myths can sometimes reinforce the myth in peoples’ minds. Communicators need to be aware of the various backfire effects and how to avoid them, such as:

It also looks at a key element to successful debunking: providing an alternative explanation. The Handbook is designed to be useful to all communicators who have to deal with misinformation (eg – not just climate myths).

I think you will find this a delightful read! From the first section, titled: Debunking the first myth about debunking,

It’s self-evident that democratic societies should base their decisions on accurate information. On many issues, however, misinformation can become entrenched in parts of the community, particularly when vested interests are involved.1,2 Reducing the influence of misinformation is a difficult and complex challenge.

A common misconception about myths is the notion that removing its influence is as simple as packing more information into people’s heads. This approach assumes that public misperceptions are due to a lack of knowledge and that the solution is more information – in science communication, it’s known as the “information deficit model”. But that model is wrong: people don’t process information as simply as a hard drive downloading data.

Refuting misinformation involves dealing with complex cognitive processes. To successfully impart knowledge, communicators need to understand how people process information, how they modify
their existing knowledge and how worldviews affect their ability to think rationally. It’s not just what people think that matters, but how they think.

I would have accepted the first sentence had it read: It’s self-evident that democratic societies don’t base their decisions on accurate information.

😉

I don’t know of any historical examples of democracies making decisions on accurate information.

For example, there are any number of “rational” and well-meaning people who have signed off on the “war on terrorism” as though the United States is in any danger.

Deaths from terrorism in the United States since 2001 – fourteen (14).

Deaths by entanglement in bed sheets between 2001-2009 – five thousand five hundred and sixty-one (5561).

From: How Scared of Terrorism Should You Be? and Number of people who died by becoming tangled in their bedsheets.

Despite being a great read, Debunking has a problem, it presumes you are dealing with a “rational” person. Rational as defined by…, as defined by what? Hard to say. It is only mentioned once and I suspect “rational” means that you agree with debunking the climate “myth.” I do as well but that’s happenstance and not because I am “rational” in some undefined way.

Realize that “rational” is a favorable label people apply to themselves and little more than that. It rather conveniently makes anyone who disagrees with you “irrational.”

I prefer to use “persuasion” on topics like global warming. You can use “facts” for people who are amenable to that approach but also religion (stewarts of the environment), greed (exploitation of the Third World for carbon credits), financial interest in government funded programs, or whatever works to persuade enough people to support your climate change program. Being aware that other people with other agendas are going to be playing the same game. The question is whether you want to be “rational” or do you want to win?

Personally I am convinced of climate change and our role in causing it. I am also aware of the difficulty of sustaining action by people with an average attention span of fifteen (15) seconds over the period of the fifty (50) years it will take for the environment to stabilize if all human inputs stopped tomorrow. It’s going to take far more than “facts” to obtain a better result.
Pride & Prejudice & Word Embedding Distance

Filed under: Literature,Text Analytics — Patrick Durusau @ 4:34 pm

Pride & Prejudice & Word Embedding Distance by Lynn Cherny.

From the webpage:

An experiment: Train a word2vec model on Jane Austen’s books, then replace the nouns in P&P with the nearest word in that model. The graph shows a 2D t-SNE distance plot of the nouns in this book, original and replacement. Mouse over the blue words!

In her blog post, Visualizing Word Embeddings in Pride and Prejudice, Lynn explain more about the project and the process she followed.

From that post:

Overall, the project as launched consists of the text of Pride and Prejudice, with the nouns replaced by the most similar word in a model trained on all of Jane Austen’s books’ text. The resulting text is pretty nonsensical. The blue words are the replaced words, shaded by how close a “match” they are to the original word; if you mouse over them, you see a little tooltip telling you the original word and the score.

I don’t agree that: “The resulting test is pretty nonsensical.”

True, it’s not Jane Austin’s original text and it is challenging to read, but that may be because our assumptions about Pride and Prejudice and literature in general are being defeated by the similar word replacements.

The lack of familiarity and smoothness of a received text may (no guarantees) enable us to see the text differently than we would on a casual re-reading.

What novel corpus would you use for such an experiment?

…ambiguous phrases in research papers…

Filed under: Ambiguity,Humor — Patrick Durusau @ 4:10 pm

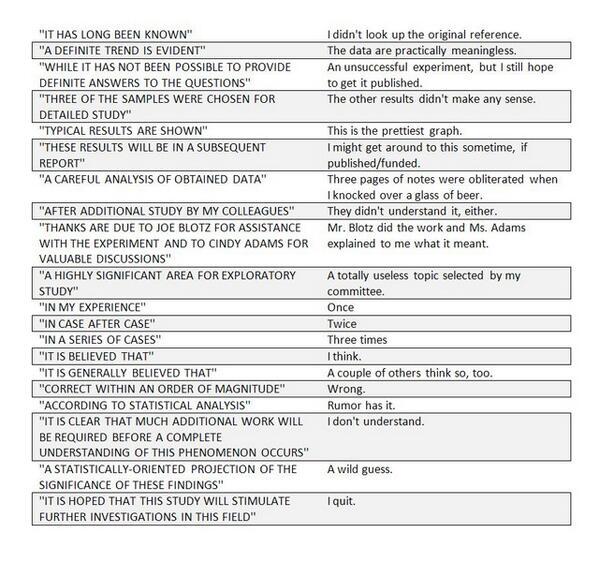
When scientists use ambiguous phrases in research papers… And what they might actually mean 😉

This graphic was posted to Twitter by Jan Lentzos.

scientists phrases

This sort of thing makes the rounds every now and again. From the number of retweets of Jan’s post, it never fails to amuse.

Enjoy!

Visual Classification Simplified

Filed under: Classification,Merging,Visualization — Patrick Durusau @ 3:41 pm

Visual Classification Simplified

From the post:

Virtually all information governance initiatives depend on being able to accurately and consistently classify the electronic files and scanned documents being managed. Visual classification is the only technology that classifies both types of documents regardless of the amount or quality of text associated with them.

From the user perspective, visual classification is extremely easy to understand and work with. Once documents are collected, visual classification clusters or groups documents based on their appearance. This normalizes documents regardless of the types of files holding the content. The Word document that was saved to PDF will be grouped with that PDF and with the TIF that was made from scanning a paper copy of either document.

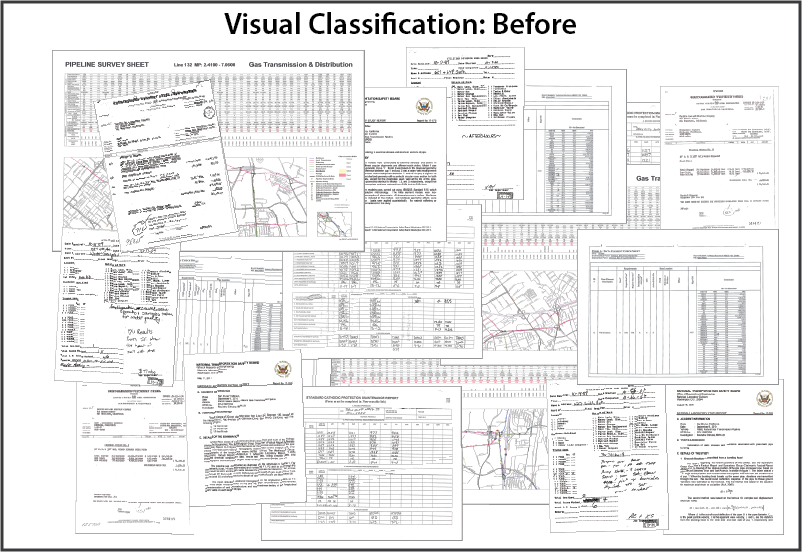
The clustering is automatic, there are no rules to write up front, no exemplars to select, no seed sets to try to tune. This is what a collection of documents might look like before visual classification is applied – no order and no way to classify the documents:

visual classification before

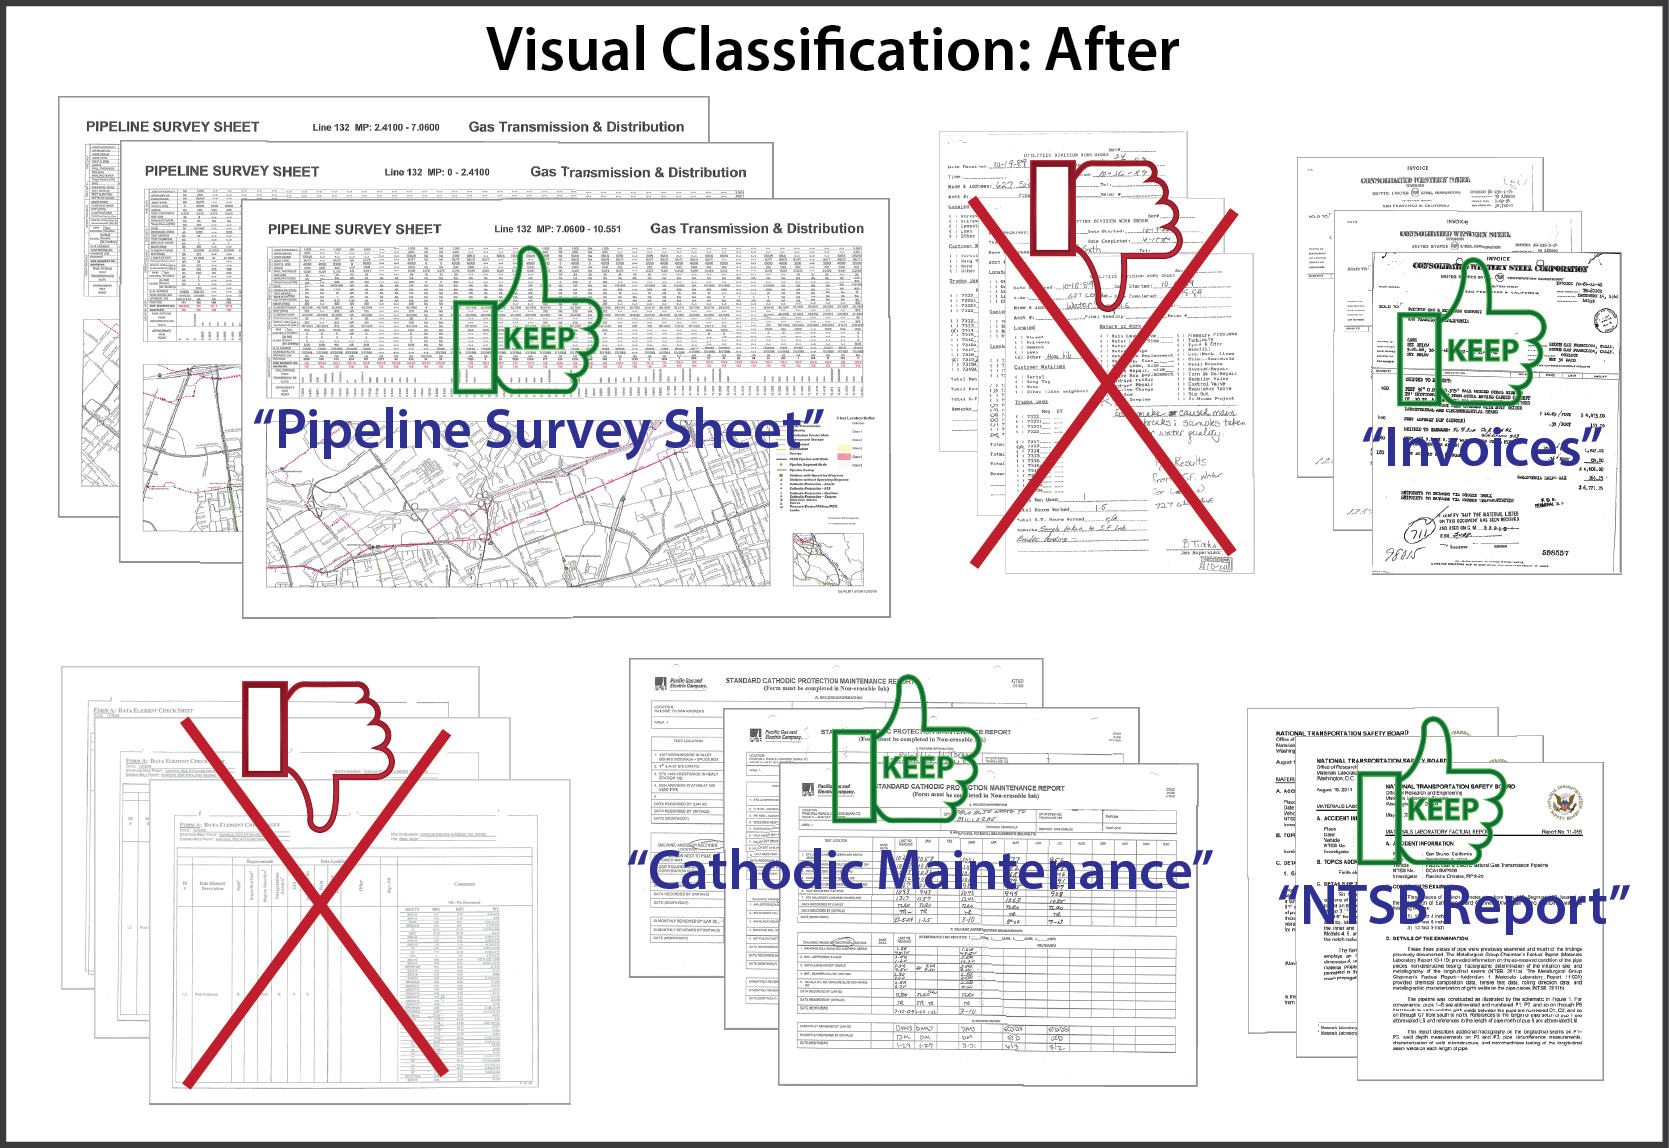
When the initial results of visual classification are presented to the client, the clusters are arranged according to the number of documents in each cluster. Reviewing the first clusters impacts the most documents. Based on reviewing one or two documents per cluster, the reviewer is able to determine (a) should the documents in the cluster be retained, and (b) if they should be retained, what document-type label to associate with the cluster.

visual classification after

By easily eliminating clusters that have no business or regulatory value, content collections can be dramatically reduced. Clusters that remain can have granular retention policies applied, be kept under appropriate access restrictions, and can be assigned business unit owners. Plus of course, the document-type labels can greatly assist users trying to find specific documents. (emphasis in original)

I suspect that BeyondRecognition, the host of this post, really means classification at the document level. A granularity that has plagued information retrieval for decades. Better than no retrieval at all but only just.

However, the graphics of visualization were just too good to pass up! Imagine that you are selecting merging criteria for a set of topics that represent subjects at a far lower granularity than document level.

With the results of those selections being returned to you as part of an interactive process.

If most topic map authoring is for aggregation, that is you author so that topics will merge, this would be aggregation by selection.

Hard to say for sure but I suspect that aggregation (merging) by selection would be far easier than authoring for aggregation.

Suggestions on how to test that premise?

Linguistic Mapping Reveals How Word Meanings Sometimes Change Overnight

Filed under: Linguistics,Meaning — Patrick Durusau @ 3:08 pm

Linguistic Mapping Reveals How Word Meanings Sometimes Change Overnight Data mining the way we use words is revealing the linguistic earthquakes that constantly change our language.

From the post:

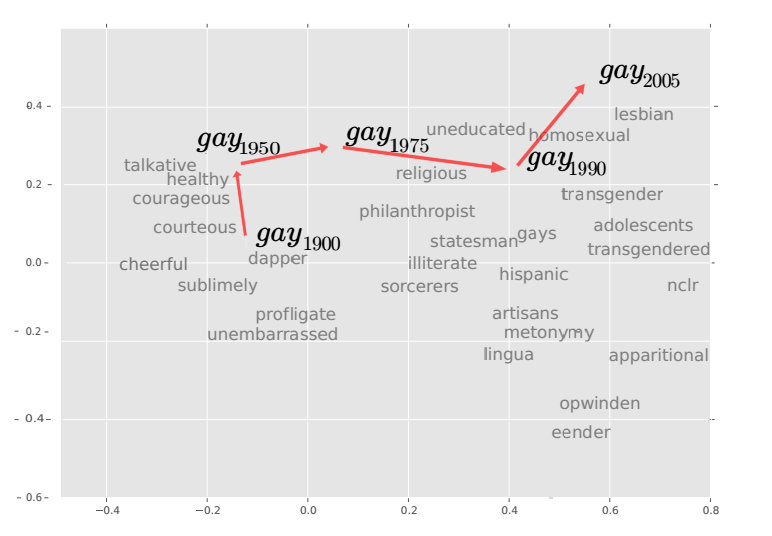
language change

In October 2012, Hurricane Sandy approached the eastern coast of the United States. At the same time, the English language was undergoing a small earthquake of its own. Just months before, the word “sandy” was an adjective meaning “covered in or consisting mostly of sand” or “having light yellowish brown colour”. Almost overnight, this word gained an additional meaning as a proper noun for one of the costliest storms in US history.

A similar change occurred to the word “mouse” in the early 1970s when it gained the new meaning of “computer input device”. In the 1980s, the word “apple” became a proper noun synonymous with the computer company. And later, the word “windows” followed a similar course after the release of the Microsoft operating system.

All this serves to show how language constantly evolves, often slowly but at other times almost overnight. Keeping track of these new senses and meanings has always been hard. But not anymore.

Today, Vivek Kulkarni at Stony Brook University in New York and a few pals show how they have tracked these linguistic changes by mining the corpus of words stored in databases such as Google Books, movie reviews from Amazon and of course the microblogging site Twitter.

These guys have developed three ways to spot changes in the language. The first is a simple count of how often words are used, using tools such as Google Trends. For example, in October 2012, the frequency of the words “Sandy” and “hurricane” both spiked in the run-up to the storm. However, only one of these words changed its meaning, something that a frequency count cannot spot.

A very good overview of:

Statistically Significant Detection of Linguistic Change by Vivek Kulkarni, Rami Al-Rfou, Bryan Perozzi, and Steven Skiena.

Abstract:

We propose a new computational approach for tracking and detecting statistically significant linguistic shifts in the meaning and usage of words. Such linguistic shifts are especially prevalent on the Internet, where the rapid exchange of ideas can quickly change a word’s meaning. Our meta-analysis approach constructs property time series of word usage, and then uses statistically sound change point detection algorithms to identify significant linguistic shifts.

We consider and analyze three approaches of increasing complexity to generate such linguistic property time series, the culmination of which uses distributional characteristics inferred from word co-occurrences. Using recently proposed deep neural language models, we first train vector representations of words for each time period. Second, we warp the vector spaces into one unified coordinate system. Finally, we construct a distance-based distributional time series for each word to track it’s linguistic displacement over time.

We demonstrate that our approach is scalable by tracking linguistic change across years of micro-blogging using Twitter, a decade of product reviews using a corpus of movie reviews from Amazon, and a century of written books using the Google Book-ngrams. Our analysis reveals interesting patterns of language usage change commensurate with each medium.

While the authors are concerned with scaling, I would think detecting cracks, crevasses, and minor tremors in the meaning and usage of words, say between a bank and its regulators, or stock traders and the SEC, would be equally important.

Even if auto-detection of the “new” or “changed” meaning is too much to expect, simply detecting dissonance in the usage of terms would be a step in the right direction.

Detecting earthquakes in meaning is a worthy endeavor but there is more tripping on cracks than falling from earthquakes, linguistically speaking.

Show and Tell: A Neural Image Caption Generator

Filed under: Image Processing,Image Recognition,Image Understanding — Patrick Durusau @ 10:53 am

Show and Tell: A Neural Image Caption Generator by Oriol Vinyals, Alexander Toshev, Samy Bengio, Dumitru Erhan.

Abstract:

Automatically describing the content of an image is a fundamental problem in artificial intelligence that connects computer vision and natural language processing. In this paper, we present a generative model based on a deep recurrent architecture that combines recent advances in computer vision and machine translation and that can be used to generate natural sentences describing an image. The model is trained to maximize the likelihood of the target description sentence given the training image. Experiments on several datasets show the accuracy of the model and the fluency of the language it learns solely from image descriptions. Our model is often quite accurate, which we verify both qualitatively and quantitatively. For instance, while the current state-of-the-art BLEU score (the higher the better) on the Pascal dataset is 25, our approach yields 59, to be compared to human performance around 69. We also show BLEU score improvements on Flickr30k, from 55 to 66, and on SBU, from 19 to 27.

Another caption generating program for images. (see also, Deep Visual-Semantic Alignments for Generating Image Descriptions) Not quite to the performance of a human observer but quite respectable. The near misses are amusing enough for crowd correction to be an element in a full blown system.

Perhaps “rough recognition” is close enough for some purposes. Searching images for people who match a partial description and producing a much smaller set for additional processing.

I first saw this in Nat Torkington’s Four short links: 18 November 2014.

November 22, 2014

Compojure Address Book

Filed under: Clojure,Functional Programming,PostgreSQL — Patrick Durusau @ 9:04 pm

Jarrod C. Taylor writes in part 1:

Introduction

Clojure is a great language that is continuing to improve itself and expand its user base year over year. The Clojure ecosystem has many great libraries focused on being highly composable. This composability allows developers to easily build impressive applications from seemingly simple parts. Once you have a solid understanding of how Clojure libraries fit together, integration between them can become very intuitive. However, if you have not reached this level of understanding, knowing how all of the parts fit together can be daunting. Fear not, this series will walk you through start to finish, building a tested compojure web app backed by a Postgres Database.

Where We Are Going

The project we will build and test over the course of this blog series is an address book application. We will build the app using ring and Compojure and persist the data in a Postgres Database. The app will be a traditional client server app with no JavaScript. Here is a teaser of the final product.

Not that I need another address book but as an exercise in onboarding, this rocks!

Compojure Address Book Part 1 by

(see above)

Compojure Address Book Part 2

Recap and Restructure

So far we have modified the default Compojure template to include a basic POST route and used Midje and Ring-Mock to write a test to confirm that it works. Before we get started with templates and creating our address book we should provide some additional structure to our application in an effort to keep things organized as the project grows.

Compojure Address Book Part 3

Introduction

In this installment of the address book series we are finally ready to start building the actual application. We have laid all of the ground work required to finally get to work.

Compojure Address Book Part 4

Persisting Data in Postgres

At this point we have an address book that will allow us to add new contacts. However, we are not persisting our new additions. It’s time to change that. You will need to have Postgres installed. If you are using a Mac, postgresapp is a very simple way of installing. If you are on another OS you will need to follow the install instructions from the Postgres website.

Once you have Postgres installed and running we are going to create a test user and two databases.

Compojure Address Book Part 5

The Finish Line

Our address book application has finally taken shape and we are in a position to put the finishing touches on it. All that remains is to allow the user the ability to edit and delete existing contacts.

One clever thing Jarrod has done is post all five (5) parts to this series on one day. You can go as fast or as slow as you choose to go.

Another clever thing is that testing is part of the development process.

How many programmers actually incorporate testing day to day? Given the prevalence of security bugs (to say nothing at all of other bugs), I would say less than one hundred percent (100%).

You?

How much less than 100% I won’t hazard a guess.

Solr vs. Elasticsearch – Case by Case

Filed under: ElasticSearch,Solr — Patrick Durusau @ 8:26 pm

Solr vs. Elasticsearch – Case by Case by Alexandre Rafalovitch.

From the description:

A presentation given at the Lucene/Solr Revolution 2014 conference to show Solr and Elasticsearch features side by side. The presentation time was only 30 minutes, so only the core usability features were compared. The full video is coming later.

Just the highlights and those from an admitted ElasticSearch user.

One very telling piece of advice for Solr:

Solr – needs to buckle down and focus on the onboarding experience

Solr is getting better (e.g. listen to SolrCluster podcast of October 24, 2014)

Just in case you don’t know the term: onboarding.

And SolrCluster podcast of October 24, 2014: Solr Usability with Steve Rowe & Tim Potter

From the description:

In this episode, Lucene/Solr Committers Steve Rowe and Tim Potter join the SolrCluster team to discuss how Lucidworks and the community are making changes and improvements to Solr to increase usability and add ease to the getting started experience. Steve and Tim discuss new features such as data-driven schema, start-up scripts, launching SolrCloud, and more. (length 33:29)

Paraphrasing:

…focusing on the first five minutes of the Solr experience…hard to explore if you can’t get it started…can be a little bit scary at first…has lacked a focus on accessibility by ordinary users…need usability addressed throughout the lifecycle of the product…want to improve kicking the tires on Solr…lowering mental barriers for new users…do now have start scripts…bakes in a lot of best practices…scripts for SolrCloud…hide all the weird stuff…data driven schemas…throw data at Solr and it creates an index without creating a schema…working on improving tutorials and documentation…moving towards consolidating information…will include use cases…walk throughs…will point to different data sets…making it easier to query Solr and understand the query URLs…bringing full collections API support to the admin UI…Rest interface…components report possible configuration…plus a form to interact with it directly…forms that render in the browser…will have a continued focus on usability…not a one time push…new users need to submit any problems they encounter….

Great podcast!

Very encouraging on issues of documentation and accessibility in Solr.

Open-sourcing tools for Hadoop

Filed under: Hadoop,Impala,Machine Learning,Parquet,Scalding — Patrick Durusau @ 4:48 pm

Open-sourcing tools for Hadoop by Colin Marc.

From the post:

Stripe’s batch data infrastructure is built largely on top of Apache Hadoop. We use these systems for everything from fraud modeling to business analytics, and we’re open-sourcing a few pieces today:

Timberlake

Timberlake is a dashboard that gives you insight into the Hadoop jobs running on your cluster. Jeff built it as a replacement for YARN’s ResourceManager and MRv2’s JobHistory server, and it has some features we’ve found useful:

  • Map and reduce task waterfalls and timing plots
  • Scalding and Cascading awareness
  • Error tracebacks for failed jobs

Brushfire

Avi wrote a Scala framework for distributed learning of ensemble decision tree models called Brushfire. It’s inspired by Google’s PLANET, but built on Hadoop and Scalding. Designed to be highly generic, Brushfire can build and validate random forests and similar models from very large amounts of training data.

Sequins

Sequins is a static database for serving data in Hadoop’s SequenceFile format. I wrote it to provide low-latency access to key/value aggregates generated by Hadoop. For example, we use it to give our API access to historical fraud modeling features, without adding an online dependency on HDFS.

Herringbone

At Stripe, we use Parquet extensively, especially in tandem with Cloudera Impala. Danielle, Jeff, and Avi wrote Herringbone (a collection of small command-line utilities) to make working with Parquet and Impala easier.

More open source tools for your Hadoop installation!

I am considering creating a list of closed source tools for Hadoop. It would be shorter and easier to maintain than a list of open source tools for Hadoop. 😉

The structural virality of online diffusion

Filed under: Advertising,Marketing,Modeling — Patrick Durusau @ 4:34 pm

The structural virality of online di ffusion by Sharad Goel, Ashton Anderson, Jake Hofman, and Duncan J. Watts.

Viral products and ideas are intuitively understood to grow through a person-to-person di ffusion process analogous to the spread of an infectious disease; however, until recently it has been prohibitively difficult to directly observe purportedly viral events, and thus to rigorously quantify or characterize their structural properties. Here we propose a formal measure of what we label “structural virality” that interpolates between two conceptual extremes: content that gains its popularity through a single, large broadcast, and that which grows through multiple generations with any one individual directly responsible for only a fraction of the total adoption. We use this notion of structural virality to analyze a unique dataset of a billion di ffusion events on Twitter, including the propagation of news stories, videos, images, and petitions. We find that across all domains and all sizes of events, online di ffusion is characterized by surprising structural diversity. Popular events, that is, regularly grow via both broadcast and viral mechanisms, as well as essentially all conceivable combinations of the two. Correspondingly, we find that the correlation between the size of an event and its structural virality is surprisingly low, meaning that knowing how popular a piece of content is tells one little about how it spread. Finally, we attempt to replicate these fi ndings with a model of contagion characterized by a low infection rate spreading on a scale-free network. We fi nd that while several of our empirical fi ndings are consistent with such a model, it does not replicate the observed diversity of structural virality.

Before you get too excited, the authors do not provide a how-to-go-viral manual.

In part because:

Large and potentially viral cascades are therefore necessarily very rare events; hence one must observe a correspondingly large number of events in order to fi nd just one popular example, and many times that number to observe many such events. As we will describe later, in fact, even moderately popular events occur in our data at a rate of only about one in a thousand, while “viral hits” appear at a rate closer to one in a million. Consequently, in order to obtain a representative sample of a few hundred viral hits arguably just large enough to estimate statistical patterns reliably one requires an initial sample on the order of a billion events, an extraordinary data requirement that is difficult to satisfy even with contemporary data sources.

The authors clearly advance the state of research on “viral hits” and conclude with suggestions for future modeling work.

You can imagine the reaction of marketing departments should anyone get closer to designing successful viral advertising.

A good illustration that something we can observe, “viral hits,” in an environment where the spread can be tracked (Twitter), can still resist our best efforts to model and/or explain how to repeat the “viral hit” on command.

A good story to remember when a client claims that some action is transparent. It may well be, but that doesn’t mean there are enough instances to draw any useful conclusions.

I first saw this in a tweet by Steven Strogatz.

Clojure 1.3-1.6 Cheat Sheet (v13)

Filed under: Clojure,Functional Programming — Patrick Durusau @ 3:40 pm

Clojure 1.3-1.6 Cheat Sheet (v13)

The Clojure CheatSheet has been updated to Clojure 1.6.

Available in PDF, the cheatsheet for an entire language only runs two (2) pages. Some sources would stretch that to at least twenty (20) or more and make it far less useful.

Do you know of a legend to the colors used in the PDF? I can see that Documentation, Zippers, Macros, Loading and Other are all some shade of green but I’m not sure what binds them together? Pointers anyone?

Thanks to the Clojure Community!

Filed under: Clojure,Programming,Tweets — Patrick Durusau @ 3:30 pm

Thanks to the Clojure Community! by Alex Miller.

Today at the Clojure/conj, I gave thanks to many community members for their contributions. Any such list is inherently incomplete – I simply can’t capture everyone doing great work. If I missed someone important, please drop a comment and accept my apologies.

Alex has a list of people with GitHub, website and Twitter URLs.

I have extracted the Twitter URLs and created a Twitter handle followed by a Python comment marker and the users name for your convenience with Twitter feed scripts:

timbaldridge # Tim Baldridge

bbatsov # Bozhidar Batsov

fbellomi # Francesco Bellomi

ambrosebs # Ambrose Bonnaire-Sergeant

reborg # Renzo Borgatti

reiddraper # Reid Draper

colinfleming # Colin Fleming

deepbluelambda # Daniel Solano Gomez

nonrecursive # Daniel Higginbotham

bridgethillyer # Bridget Hillyer

heyzk # Zachary Kim

aphyr # Kyle Kingsbury

alanmalloy # Alan Malloy

gigasquid # Carin Meier

dmiller2718 # David Miller

bronsa_ # Nicola Mometto

ra # Ramsey Nasser

swannodette # David Nolen

ericnormand # Eric Normand

petitlaurent # Laurent Petit

tpope # Tim Pope

smashthepast # Ghadi Shayban

stuartsierra # Stuart Sierra

You will, of course, have to delete the blank lines with I retained for ease of human reading. Any mistakes or errors in this listing are solely my responsibility.

Enjoy!

WebCorp Linguist’s Search Engine

Filed under: Corpora,Corpus Linguistics,Linguistics — Patrick Durusau @ 2:58 pm

WebCorp Linguist’s Search Engine

From the homepage:

The WebCorp Linguist’s Search Engine is a tool for the study of language on the web. The corpora below were built by crawling the web and extracting textual content from web pages. Searches can be performed to find words or phrases, including pattern matching, wildcards and part-of-speech. Results are given as concordance lines in KWIC format. Post-search analyses are possible including time series, collocation tables, sorting and summaries of meta-data from the matched web pages.

Synchronic English Web Corpus 470 million word corpus built from web-extracted texts. Including a randomly selected ‘mini-web’ and high-level subject classification. About

Diachronic English Web Corpus 130 million word corpus randomly selected from a larger collection and balanced to contain the same number of words per month. About

Birmingham Blog Corpus 630 million word corpus built from blogging websites. Including a 180 million word sub-section separated into posts and comments. About

Anglo-Norman Correspondence Corpus A corpus of approximately 150 personal letters written by users of Anglo-Norman. Including bespoke part-of-speech annotation. About

Novels of Charles Dickens A searchable collection of the novels of Charles Dickens. Results can be visualised across chapters and novels. About

You have to register to use the service but registration is free.

The way I toss subject around on this blog you would think it has only one meaning. Not so as shown by the first twenty “hits” on subject in the Synchronic English Web Corpus:

1    Service agencies.  'Merit' is subject to various interpretations depending 
2		amount of oxygen a subject breathes in," he says, "
3		    to work on the subject again next month "to 
4	    of Durham degrees were subject to a religion test 
5	    London, which were not subject to any religious test, 
6	cited researchers in broad subject categories in life sciences, 
7    Losing Weight.  Broaching the subject of weight can be 
8    by survey respondents include subject and curriculum, assessment, pastoral, 
9       knowledge in teachers' own subject area, the use of 
10     each addressing a different subject and how citizenship and 
11	     and school staff, but subject to that they dismissed 
12	       expressed but it is subject to the qualifications set 
13	        last piece on this subject was widely criticised and 
14    saw themselves as foreigners subject to oppression by the 
15	 to suggest that, although subject to similar experiences, other 
16	       since you raise the subject, it's notable that very 
17	position of the privileged subject with their disorderly emotions 
18	 Jimmy may include radical subject matter in his scripts, 
19	   more than sufficient as subject matter and as an 
20	      the NATO script were subject to personal attacks from 

There are a host of options for using the corpus and exporting the results. See the Users Guide for full details.

A great tool not only for linguists but anyone who wants to explore English as a language with professional grade tools.

If you re-read Dickens with concordance in hand, please let me know how it goes. That has the potential to be a very interesting experience.

Free for personal/academic work, commercial use requires a license.

I first saw this in a tweet by Claire Hardaker

A modern guide to getting started with Data Science and Python

Filed under: Data Science,Python — Patrick Durusau @ 12:02 pm

A modern guide to getting started with Data Science and Python by Thomas Wiecki.

From the post:

Python has an extremely rich and healthy ecosystem of data science tools. Unfortunately, to outsiders this ecosystem can look like a jungle (cue snake joke). In this blog post I will provide a step-by-step guide to venturing into this PyData jungle.

What’s wrong with the many lists of PyData packages out there already you might ask? I think that providing too many options can easily overwhelm someone who is just getting started. So instead, I will keep a very narrow scope and focus on the 10% of tools that allow you to do 90% of the work. After you mastered these essentials you can browse the long lists of PyData packages to decide which to try next.

The upside is that the few tools I will introduce already allow you to do most things a data scientist does in his day-to-day (i.e. data i/o, data munging, and data analysis).

A great “start small” post on Python.

Very appropriate considering that over sixty percent (60%) of software skill job postings mention Python. Popular Software Skills in Data Science Job postings. If you have a good set of basic tools, you can add specialized ones later.

Using Load CSV in the Real World

Filed under: CSV,Graphs,Neo4j — Patrick Durusau @ 11:23 am

Using Load CSV in the Real World by Nicole White.

From the description:

In this live-coding session, Nicole will demonstrate the process of downloading a raw .csv file from the Internet and importing it into Neo4j. This will include cleaning the .csv file, visualizing a data model, and writing the Cypher query that will import the data. This presentation is meant to make Neo4j users aware of common obstacles when dealing with real-world data in .csv format, along with best practices when using LOAD CSV.

A webinar with substantive content and not marketing pitches! Unusual but it does happen.

A very good walk through importing a CSV file into Neo4j, with some modeling comments along the way and hints of best practices.

The “next” thing for users after a brief introduction to graphs and Neo4j.

The experience will build their confidence and they will learn from experience what works best for modeling their data sets.

November 21, 2014

Big data in minutes with the ELK Stack

Filed under: ElasticSearch,Kibana,logstash — Patrick Durusau @ 8:36 pm

Big data in minutes with the ELK Stack by Philippe Creux.

From the post:

We’ve built a data analysis and dashboarding infrastructure for one of our clients over the past few weeks. They collect about 10 million data points a day. Yes, that’s big data.

My highest priority was to allow them to browse the data they collect so that they can ensure that the data points are consistent and contain all the attributes required to generate the reports and dashboards they need.

I chose to give the ELK stack a try: ElasticSearch, logstash and Kibana.

Is it just me or does processing “big data” seem to have gotten easier over the past several years?

But however easy or hard the processing, the value-add question is what do we know post data processing that we didn’t know before?

Building an AirPair Dashboard Using Apache Spark and Clojure

Filed under: Clojure,Functional Programming,Spark — Patrick Durusau @ 8:19 pm

Building an AirPair Dashboard Using Apache Spark and Clojure by Sébastien Arnaud.

From the post:

Have you ever wondered how much you should charge per hour for your skills as an expert on AirPair.com? How many opportunities are available on this platform? Which skills are in high demand? My name is Sébastien Arnaud and I am going to introduce you to the basics of how to gather, refine and analyze publicly available data using Apache Spark with Clojure, while attempting to generate basic insights about the AirPair platform.

1.1 Objectives

Here are some of the basic questions we will be trying to answer through this tutorial:

  • What is the lowest and the highest hourly rate?
  • What is the average hourly rate?
  • What is the most sought out skill?
  • What is the skill that pays the most on average?

1.2 Chosen tools

In order to make this journey a lot more interesting, we are going to step out of the usual comfort zone of using a standard iPython notebook using pandas with matplotlib. Instead we are going to explore one of the hottest data technologies of the year: Apache Spark, along with one of the up and coming functional languages of the moment: Clojure.

As it turns out, these two technologies can work relatively well together thanks to Flambo, a library developed and maintained by YieldBot's engineers who have improved upon clj-spark (an earlier attempt from the Climate Corporation). Finally, in order to share the results, we will attempt to build a small dashboard using DucksBoard, which makes pushing data to a public dashboard easy.

In addition to illustrating the use of Apache Spark and Clojure, Sébastien also covers harvesting data from Twitter and processing it into a useful format.

Definitely worth some time over a weekend!

« Newer PostsOlder Posts »

Powered by WordPress