Another Word For It Patrick Durusau on Topic Maps and Semantic Diversity

February 17, 2014

Understanding Classic SoundEx Algorithms

Filed under: Algorithms,SoundEx,Subject Identity — Patrick Durusau @ 8:53 pm

Understanding Classic SoundEx Algorithms

From the webpage:

Terms that are often misspelled can be a problem for database designers. Names, for example, are variable length, can have strange spellings, and they are not unique. American names have a diversity of ethnic origins, which give us names pronounced the same way but spelled differently and vice versa.

Words too, can be misspelled or have multiple spellings, especially across different cultures or national sources.

To help solve this problem, we need phonetic algorithms which can find similar sounding terms and names. Just such a family of algorithms exist and have come to be called SoundEx algorithms.

A Soundex search algorithm takes a written word, such as a person’s name, as input, and produces a character string that identifies a set of words that are (roughly) phonetically alike. It is very handy for searching large databases when the user has incomplete data.

The method used by Soundex is based on the six phonetic classifications of human speech sounds (bilabial, labiodental, dental, alveolar, velar, and glottal), which are themselves based on where you put your lips and tongue to make the sounds.

The algorithm itself is fairly straight forward to code and requires no backtracking or multiple passes over the input word. In fact, it is so straight forward, I will start (after a history section) by presenting it as an outline. Further on, I will give C, JavaScript, Perl, and VB code that implements the two standard algorithms used in the American Census as well as an enhanced version, which is described in this article.

A timely reminder that knowing what is likely to be confused can be more powerful than the details of any particular confusion.

Even domain level semantics may be too difficult to capture. What if we were to capture only the known cases of confusion?

That would be a much smaller set than the domain in general and easier to maintain. (As well as to distinguish in a solution.)

Introduction to Clojure – Modern dialect of Lisp (Part 1)

Filed under: Clojure,Functional Programming,Programming — Patrick Durusau @ 8:33 pm

learnclojure

Introduction to Clojure – Modern dialect of Lisp (Part 1) by Ricardo Sanchez and Karsten Schmidt.

A tutorial with lots of references is a good sign. The authors are not afraid for you to look elsewhere for information. They know you will be back.

To give the authors time to write part 2, there is a healthy selection of further reading and other resources at the end of part 1.

Enjoy!

Linux Kernel Map

Filed under: Interface Research/Design,Linux OS,Maps — Patrick Durusau @ 3:41 pm

Linux Kernel Map by Antony Peel.

A very good map of the Linux Kernel.

I haven’t tried to reproduce it here because the size reduction would make it useless.

In sufficient resolution, this would make a nice interface to usenet Linux postings.

I may have to find a print shop that can convert this into a folding map version.

Enjoy!

Rediscovering strace

Filed under: Cybersecurity,Security — Patrick Durusau @ 3:30 pm

Spying on ssh with strace by Julia Evans.

From the post:

In the shower this morning I was thinking about strace and ltrace and how they let you inspect the system calls a running process is making. I’ve played a bit with strace on this blog before (see Understanding how killall works using strace), but it’s clear to me that there are tons of uses for it I haven’t explored yet.

Then I thought “Hey! If you can look at the system calls with strace and the library calls with ltrace, can you spy on people’s ssh passwords?!”

It turns out that you can! I was going to do original research, but as with most things one thinks up in the shower, it turns out someone’s already done this before. So I googled it and I found this blog post explaining how to spy on ssh. The instructions here are just taken from there 🙂

Julia re-discovered that ssh is vulnerable to strace.

Good for Julia but shouldn’t it be unnecessary for Julia to “re-discover” this usage of strace?

That is to add to the general body of knowledge about strace, a new or innovative use of strace would be more useful.

Not to take anything away from Julia’s realizing the application of strace to ssh, probably the better way to learn but progress can be slowed by re-learning old lessons time and time again.

The man page on strace reports the release of strace 2.5 in 1992, so this isn’t a recent command.

Capturing the long legacy of sysadmin knowledge would pay off for maintenance of older systems and perhaps avoiding mistakes in the design of new systems.

BTW, I found a map today that may help you find interesting places to explore in the Linux kernel. More on that in a minute.

ViziCities

Filed under: Mapping,Maps,Visualization,WebGL — Patrick Durusau @ 11:43 am

ViziCities: Bringing cities to life using the power of open data and the Web by Robin Hawkes and Peter Smart.

From the webpage:

ViziCities is a 3D city and data visualisation platform, powered by WebGL. Its purpose is to change the way you look at cities and the data contained within them. It is the brainchild of Robin Hawkes and Peter Smartget in touch if you’d like to discuss the project with them in more detail.

Demonstration

Here’s a demo of ViziCities so you can have a play without having to build it for yourself. Cool, ey?

What does it do?

ViziCities aims to combine data visualisation with a 3D representation of a city to provide a better understanding what’s going on. It’s a powerful new way of looking at and understanding urban areas.

Aside from seeing a city in 3D, here are some of the others things you’ll have the power to do:

This is wickedly cool! (Even though in pre-alpha state.)

Governments, industry, etc. have had these capabilities for quite some time.

Now, you too can do line of sight, routing, and integration of other data onto a representation of a cityscape.

Could be quite important in Bangkok, Caracas, Kiev, and other locations with non-responsive governments.

Used carefully, information can become an equalizer.

Other resources:

ViziCities website

ViziCities announcement

Videos of ViziCities experiments

“ViziCities” as a search term shows a little over 1,500 “hits” today. Expect that to expand rapidly.

Ad for Topic Maps

Filed under: Data Governance,Federation,Marketing,Master Data Management,Topic Maps — Patrick Durusau @ 9:29 am

Imagine my surprise at finding an op-ed piece in Information Management flogging topic maps!

Karen Heath writes in: Is it Really Possible to Achieve a Single Version of Truth?:

There is a pervasive belief that a single version of truth–eliminating data siloes by consolidating all enterprise data in a consistent, non-redundant form – remains the technology-equivalent to the Holy Grail. And, the advent of big data is making it even harder to realize. However, even though SVOT is difficult or impossible to achieve today, beginning the journey is still a worthwhile business goal.

The road to SVOT is paved with very good intentions. SVOT has provided the major justification over the past 20 years for building enterprise data warehouses, and billions of dollars have been spent on relational databases, ETL tools and BI technologies. Millions of resource hours have been expended in construction and maintenance of these platforms, yet no organization is able to achieve SVOT on a sustained basis. Why? Because new data sources, either sanctioned or rogue, are continually being introduced, and existing data is subject to decay of quality over time. As much as 25 percent of customer demographic data, including name, address, contact info, and marital status changes every year. Also, today’s data is more dispersed and distributed and even “bigger” (volume, variety, velocity) than it has ever been.

Karen does a brief overview of why so many SVOT projects have failed (think lack of imagination and insight for starters) but then concludes:

As soon as MDM and DG are recognized as having equal standing with other programs in terms of funding and staffing, real progress can be made toward realization of a sustained SVOT. It takes enlightened management and a committed workforce to understand that successful MDM and DG programs are typically multi-year endeavors that require a significant commitment to of people, processes and technology. MDM and DG are not something that organizations should undertake with a big-bang approach, assuming that there is a simple end to a single project. SVOT is no longer dependent on all data being consolidated into a single physical platform. With effective DG, a federated architecture and robust semantic layer can support a multi-layer, multi-location, multi-product organization that provides its business users the sustained SVOT. That is the reward. (emphasis added)

In case you aren’t “in the know,” DG – data governance, MDM – master data management, SVOT – single version of truth.

The bolded line about the “robust semantic layer” is obviously something topic maps can do quite well. But that’s not where I saw the topic map ad.

I saw the topic map ad being highlighted by:

As soon as MDM and DG are recognized as having equal standing with other programs in terms of funding and staffing

Because that’s never going to happen.

And why should it? GM for example has legendary data management issues but their primary business, MDM and DG people to one side, is making and financing automobiles. They could divert enormous resources to obtain an across the board SVOT but why?

Rather than across the board SVOT, GM is going to want a more selective, a MVOT (My Version Of Truth) application. So it can be applied where it returns the greatest ROI for the investment.

With topic maps as “a federated architecture and robust semantic layer [to] support a multi-layer, multi-location, multi-product organization,” then accounting can have its MVOT, production its MVOT, shipping its MVOT, management its MVOT, regulators their MVOT.

Given the choice between a Single Version Of Truth and your My Version Of Truth, which one would you choose?

That’s what I thought.

PS: Topics maps can also present a SVOT, just in case its advocates come around.

February 16, 2014

Stanford Spring Offerings

Filed under: Compilers,Machine Learning — Patrick Durusau @ 8:43 pm

Just a quick heads up on two Stanford Online courses that may be of interest:

Compilers, Alex Aiken, Monday, March 17, 2014

From the course page:

This course will discuss the major ideas used today in the implementation of programming language compilers, including lexical analysis, parsing, syntax-directed translation, abstract syntax trees, types and type checking, intermediate languages, dataflow analysis, program optimization, code generation, and runtime systems. As a result, you will learn how a program written in a high-level language designed for humans is systematically translated into a program written in low-level assembly more suited to machines. Along the way we will also touch on how programming languages are designed, programming language semantics, and why there are so many different kinds of programming languages.

The course lectures will be presented in short videos. To help you master the material, there will be in-lecture questions to answer, quizzes, and two exams: a midterm and a final. There will also be homework in the form of exercises that ask you to show a sequence of logical steps needed to derive a specific result, such as the sequence of steps a type checker would perform to type check a piece of code, or the sequence of steps a parser would perform to parse an input string. This checking technology is the result of ongoing research at Stanford into developing innovative tools for education, and we’re excited to be the first course ever to make it available to students.

An optional course project is to write a complete compiler for COOL, the Classroom Object Oriented Language. COOL has the essential features of a realistic programming language, but is small and simple enough that it can be implemented in a few thousand lines of code. Students who choose to do the project can implement it in either C++ or Java.

I hope you enjoy the course!

Machine Learning, Andrew Ng, Monday, March 3, 2014.

From the course page:

Machine learning is the science of getting computers to act without being explicitly programmed. In the past decade, machine learning has given us self-driving cars, practical speech recognition, effective web search, and a vastly improved understanding of the human genome. Machine learning is so pervasive today that you probably use it dozens of times a day without knowing it. Many researchers also think it is the best way to make progress towards human-level AI. In this class, you will learn about the most effective machine learning techniques, and gain practice implementing them and getting them to work for yourself. More importantly, you’ll learn about not only the theoretical underpinnings of learning, but also gain the practical know-how needed to quickly and powerfully apply these techniques to new problems. Finally, you’ll learn about some of Silicon Valley’s best practices in innovation as it pertains to machine learning and AI.

This course provides a broad introduction to machine learning, datamining, and statistical pattern recognition. Topics include: (i) Supervised learning (parametric/non-parametric algorithms, support vector machines, kernels, neural networks). (ii) Unsupervised learning (clustering, dimensionality reduction, recommender systems, deep learning). (iii) Best practices in machine learning (bias/variance theory; innovation process in machine learning and AI). The course will also draw from numerous case studies and applications, so that you’ll also learn how to apply learning algorithms to building smart robots (perception, control), text understanding (web search, anti-spam), computer vision, medical informatics, audio, database mining, and other areas.

Enjoy!

Duke 1.2 Released!

Filed under: Duke,Entity Resolution,Record Linkage — Patrick Durusau @ 8:34 pm

Lars Marius Garshol has released Duke 1.2!

From the homepage:

Duke is a fast and flexible deduplication (or entity resolution, or record linkage) engine written in Java on top of Lucene. The latest version is 1.2 (see ReleaseNotes).

Duke can find duplicate customer records, or other kinds of records in your database. Or you can use it to connect records in one data set with other records representing the same thing in another data set. Duke has sophisticated comparators that can handle spelling differences, numbers, geopositions, and more. Using a probabilistic model Duke can handle noisy data with good accuracy.

Features

  • High performance.
  • Highly configurable.
  • Support for CSV, JDBC, SPARQL, and NTriples.
  • Many built-in comparators.
  • Plug in your own data sources, comparators, and cleaners.
  • Genetic algorithm for automatically tuning configurations.
  • Command-line client for getting started.
  • API for embedding into any kind of application.
  • Support for batch processing and continuous processing.
  • Can maintain database of links found via JNDI/JDBC.
  • Can run in multiple threads.

The GettingStarted page explains how to get started and has links to further documentation. The examples of use page lists real examples of using Duke, complete with data and configurations. This presentation has more the big picture and background.

Excellent!

Until you know which two or more records are talking about the same subject, it’s very difficult to know what to map together.

Data as Magic?

Filed under: Data,Graphics — Patrick Durusau @ 7:52 pm

An example of why data will not end debate by Kaiser Fung.

From the post:

One oft-repeated “self-evident” tenet of Big Data is that data end all debate. Except if you have ever worked for a real company (excluding those ruled by autocrats), and put data on the table, you know that the data do not end anything.

Reader Ben M. sent me to this blog post by Benedict Evans, showing a confusing chart showing how Apple has “passed” Microsoft. Evans used to be a stock analyst before moving to Andreessen Horowitz, a VC (venture capital) business. He has over 25,000 followers on Twitter.
….

Evans responded to many of these comments by complaining that readers are not getting his message. That’s an accurate statement, and it has everything to do with the looseness of his data. This reminds me of Gelman’s statistical parable. The blogger here is not so much interested in how strong his evidence is but more interested in evangelizing the morale behind the story.

A highly entertaining post as always.

Gelman’s “statistical parable” is used for stories that cite numbers that if you think about them, are quite unreasonable. Gelman’s example case was statistics on death rates that put 1/4 of the death rate at a hospital as due to record keeping errors. Probably not true.

The point being that people bolster a narrative with numbers in the interest of advancing the story, with little concern for the “accuracy” of the numbers.

Other examples include: RIAA numbers on musical piracy, software piracy, OMB budget numbers, TSA terrorist threat numbers, etc.

I put “accuracy” in quotes because recognizing a “statistical parable” depends on where you sit. If you are on the side with shaky numbers, the question of accuracy is an annoying detail. If you oppose the side with shaky numbers, it is evidence they can’t make a case without manufactured evidence.

I take Kaiser’s point to be data is not magic. Even strong (in some traditional sense) data is not magic.
.
Data is at best one tool of persuasion that you can enlist for your cause, whatever that may be. Ignore other tools of persuasion at your own peril.

SearchReSearch

Filed under: Search Behavior,Searching — Patrick Durusau @ 4:45 pm

SearchReSearch by Daniel M. Russell.

WARNING: SearchReSearch looks very addictive!

Truly, it really looks addictive

The description reads:

A blog about search, search skills, teaching search, learning how to search, learning how to use Google effectively, learning how to do research. It also covers a good deal of sensemaking and information foraging.

If you like searching, knowing why searches work (or don’t), sensemaking and information foraging, this is the blog for you.

Among other features, Daniel posts search challenges that are solved by commenters and himself. Interesting search challenges.

Spread the news about Daniel’s blog to every librarian (or researcher) you know.

I first saw this at Pete Warden’s Five Short Links February 13, 2014.

42 Rules to Lead… [Update]

Filed under: Programming — Patrick Durusau @ 4:19 pm

I posted 42 Rules to Lead… to alert you to at least one hobby horse of Jonathan Rosenberg of Google, which is going to have a negative impact on productivity: open offices.

I have since discovered, via Greg Linden, The Open-Office Trap by Maria Konnikova, which appeared January 7, 2014, in the New Yorker.

Maria writes in part:

The open office was originally conceived by a team from Hamburg, Germany, in the nineteen-fifties, to facilitate communication and idea flow. But a growing body of evidence suggests that the open office undermines the very things that it was designed to achieve. In June, 1997, a large oil and gas company in western Canada asked a group of psychologists at the University of Calgary to monitor workers as they transitioned from a traditional office arrangement to an open one. The psychologists assessed the employees’ satisfaction with their surroundings, as well as their stress level, job performance, and interpersonal relationships before the transition, four weeks after the transition, and, finally, six months afterward. The employees suffered according to every measure: the new space was disruptive, stressful, and cumbersome, and, instead of feeling closer, coworkers felt distant, dissatisfied, and resentful. Productivity fell.
….

Maria points out numerous other studies that confirm serious productivity and even health issues with open office structures.

I think the answer to Rosenberg’s “Crowded is Creative” call is “evidence based” evaluation.

Rosenberg may have a good slogan, but like “land, peace and bread,” it doesn’t take you anywhere you want to go.

Hofstadter on Watson and Siri – “absolutely vacuous”

Filed under: Artificial Intelligence — Patrick Durusau @ 4:02 pm

Why Watson and Siri Are Not Real AI by William Herkewitz.

Hofstadter’s first response in the interview:

Well, artificial intelligence is a slippery term. It could refer to just getting machines to do things that seem intelligent on the surface, such as playing chess well or translating from one language to another on a superficial level—things that are impressive if you don’t look at the details. In that sense, we’ve already created what some people call artificial intelligence. But if you mean a machine that has real intelligence, that is thinking—that’s inaccurate. Watson is basically a text search algorithm connected to a database just like Google search. It doesn’t understand what it’s reading. In fact, read is the wrong word. It’s not reading anything because it’s not comprehending anything. Watson is finding text without having a clue as to what the text means. In that sense, there’s no intelligence there. It’s clever, it’s impressive, but it’s absolutely vacuous. (emphasis added)

You may remember Douglas Hofstadter as the author of Gödel, Escher, Bach

If Hofstadter’s point is that no mechanical device is “intelligent,” from a cuneiform tablet to a codex or even a digital computer such as Watson, I am in full agreement. A mechanical device can do nor more or less than it has been engineered to do.

What is curious about Watson is that what usefulness it displays, at least at playing Jeopardy, comes from analysis of prior responses of human players.

But most “AI” efforts don’t ask for a stream of human judgments but rather try to capture with algorithms the important points to remember.

Curious isnt it? The failure to ask a large audience of known intelligence users for their opinions, to be captured in an electronic form for further use.

And why stop with a large audience? Why not ask every researcher who submits a publication a series of questions about their paper and related work?

Reasoning (sorry) that the more intelligence you put into a mechanical storage device the more intelligence you maybe able to extract.

Present practices almost sound like discrimination against intelligent users in favor of using mechanical approaches.

I guess that depends on whether using mechanical devices or getting a useful result is the goal.

I first saw this in Stephen Arnold’s Getting a Failing Grade in Artificial Intelligence: Watson and Siri.

February 15, 2014

Creating A Galactic Plane Atlas With Amazon Web Services

Filed under: Amazon Web Services AWS,Astroinformatics,BigData — Patrick Durusau @ 1:59 pm

Creating A Galactic Plane Atlas With Amazon Web Services by Bruce Berriman, el. al.

Abstract:

This paper describes by example how astronomers can use cloud-computing resources offered by Amazon Web Services (AWS) to create new datasets at scale. We have created from existing surveys an atlas of the Galactic Plane at 16 wavelengths from 1 μm to 24 μm with pixels co- registered at spatial sampling of 1 arcsec. We explain how open source tools support management and operation of a virtual cluster on AWS platforms to process data at scale, and describe the technical issues that users will need to consider, such as optimization of resources, resource costs, and management of virtual machine instances.

In case you are interesting in taking your astronomy hobby to the next level with AWS.

And/or gaining experience with AWS and large datasets.

Easy Hierarchical Faceting and display…

Filed under: Facets,JQuery,Solr — Patrick Durusau @ 1:44 pm

Easy Hierarchical Faceting and display with Solr and jQuery (and a tiny bit of Python) by Grant Ingersoll.

From the post:

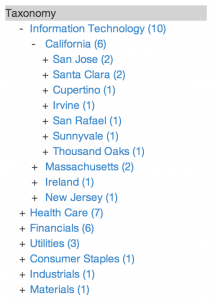
Visiting two major clients in two days last week, each presented me with the same question: how do we better leverage hierarchical information like taxonomies, file paths, etc. in LucidWorks Search (LWS) (and Apache Solr) their applications, such that they could display something like the following image in their UI:

facets

Since this is pretty straight forward (much of it is captured already on the Solr Wiki) and I have both the client-side and server side code for this already in a few demos we routinely give here at Lucid, I thought I would write it up as a blog instead of sending each of them a one-off answer. I am going to be showing this work in the context of the LWS Financial Demo, for those who wish to follow along at the code level. We’ll use it to show a little bit of hierarchical faceting that correlates the industry sector of an S&P 500 company with the state and city of the HQ of that company. In your particular use case, you may wish to use it for organizing content in filesystems, websites, taxonomies or pretty much anything that exhibits, as the name implies, hierarchical relationships.

Who knew? Hierarchies are just like graphs! They’re everywhere! 😉

Grant closes by suggesting Solr analysis capabilities for faceting would be a nice addition to Solr. Are you game?

UpdateRequestProcessor factories in Apache Solr 4.6.1

Filed under: Solr — Patrick Durusau @ 1:28 pm

The full list of UpdateRequestProcessor factories in Apache Solr 4.6.1 by Alexandre Rafalovitch.

From the post:

UpdateRequestProcessor is a mechinism in Solr to change the documents that are being submitted for indexing to Solr. They provide advanced functions such as language identification, duplicate detection, intelligent defaults, external text processing pipelines integration, and – most recently – dynamic schema definition.

UpdateRequestProcessor factories (a.k.a. Update Request Processors or URPs) can be chained and multiple chains can be defined for one Solr collection. A chain is assigned to a request handler with update.chain parameter that can be defined in the configuration file or passed as a part of the URL. See example solrconfig.xml or consult Solr WIKI.

A very useful collection but it can be improved with one liners from the JavaDocs:

Data Modeling – FoundationDB

Filed under: Data Models,Email,FoundationDB — Patrick Durusau @ 11:55 am

Data Modeling – FoundationDB

From the webpage:

FoundationDB’s core provides a simple data model coupled with powerful transactions. This combination allows building richer data models and libraries that inherit the scalability, performance, and integrity of the database. The goal of data modeling is to design a mapping of data to keys and values that enables effective storage and retrieval. Good decisions will yield an extensible, efficient abstraction. This document covers the fundamentals of data modeling with FoundationDB.

Great preparation for these tutorials using the tuple layer of FoundationDB:

The Class Scheduling tutorial introduces the fundamental concepts needed to design and build a simple application using FoundationDB, beginning with basic interaction with the database and walking through a few simple data modeling techniques.

The Enron Email Corpus tutorial introduces approaches to loading data in FoundationDB and further illustrates data modeling techniques using a well-known, publicly available data set.

The Managing Large Values and Blobs tutorial discusses approaches to working with large data objects in FoundationDB. It introduces the blob layer and illustrates its use to build a simple file library.

The Lightweight Query Language tutorial discusses a layer that allows Datalog to be used as an interactive query language for FoundationDB. It describes both the FoundationDB binding and the use of the query language itself.

Enjoy!

MPLD3…

Filed under: D3,Graphics,Python-Graph,Visualization — Patrick Durusau @ 11:33 am

MPLD3: Bringing Matplotlib to the Browser

From the webpage:

The mpld3 project brings together Matplotlib, the popular Python-based graphing library, and D3js, the popular Javascript library for creating data-driven web pages. The result is a simple API for exporting your matplotlib graphics to HTML code which can be used within the browser, within standard web pages, blogs, or tools such as the IPython notebook.

See the Example Gallery or Notebook Examples for some interactive demonstrations of mpld3 in action.

For a quick overview of the package, see the Quick Start Guide.

Being a “text” person, I have to confess a fondness for the HTML tooltip plugin.

Data is the best antidote for graphs with labeled axes but no metrics and arbitrary placement of competing software packages.

Some people call that marketing. I prefer the older term, “lying.”

Spring XD – Tweets – Hadoop – Sentiment Analysis

Filed under: Hadoop,MapReduce,Sentiment Analysis,Tweets — Patrick Durusau @ 11:18 am

Using Spring XD to stream Tweets to Hadoop for Sentiment Analysis

From the webpage:

This tutorial will build on the previous tutorial – 13 – Refining and Visualizing Sentiment Data – by using Spring XD to stream in tweets to HDFS. Once in HDFS, we’ll use Apache Hive to process and analyze them, before visualizing in a tool.

I re-ordered the text:

This tutorial is from the Community part of tutorial for Hortonworks Sandbox (1.3) – a single-node Hadoop cluster running in a virtual machine. Download to run this and other tutorials in the series.

This community tutorial submitted by mehzer with source available at Github. Feel free to contribute edits or your own tutorial and help the community learn Hadoop.

not to take anything away from Spring XD or Sentiment Analysis but to emphasize the community tutorial aspects of the Hortonworks Sandbox.

At present count on tutorials:

Hortonworks: 14

Partners: 12

Community: 6

Thoughts on what the next community tutorial should be?

On Being a Data Skeptic

Filed under: Data,Skepticism — Patrick Durusau @ 11:00 am

On Being a Data Skeptic by Cathy O’Neil. (pdf)

From Skeptic, Not Cynic:

I’d like to set something straight right out of the gate. I’m not a data cynic, nor am I urging other people to be. Data is here, it’s growing, and it’s powerful. I’m not hiding behind the word “skeptic” the way climate change “skeptics” do, when they should call themselves deniers.

Instead, I urge the reader to cultivate their inner skeptic, which I define by the following characteristic behavior. A skeptic is someone who maintains a consistently inquisitive attitude toward facts, opinions, or (especially) beliefs stated as facts. A skeptic asks questions when confronted with a claim that has been taken for granted. That’s not to say a skeptic brow-beats someone for their beliefs, but rather that they set up reasonable experiments to test those beliefs. A really excellent skeptic puts the “science” into the term “data science.”

In this paper, I’ll make the case that the community of data practitioners needs more skepticism, or at least would benefit greatly from it, for the following reason: there’s a two-fold problem in this community. On the one hand, many of the people in it are overly enamored with data or data science tools. On the other hand, other people are overly pessimistic about those same tools.

I’m charging myself with making a case for data practitioners to engage in active, intelligent, and strategic data skepticism. I’m proposing a middle-of-the-road approach: don’t be blindly optimistic, don’t be blindly pessimistic. Most of all, don’t be awed. Realize there are nuanced considerations and plenty of context and that you don’t necessarily have to be a mathematician to understand the issues.
….

It’s a scant 26 pages, cover and all but “On Being a Data Skeptic” is well worth your time.

I particularly liked Cathy’s coverage of issues such as: People Get Addicted to Metrics, which ends with separate asides to “nerds,” and “business people.” Different cultures and different ways of “hearing” the same content. Rather than trying to straddle those communities, Cathy gave them separate messages.

You will find her predator/prey model particularly interesting.

On the whole, I would say her predator/prey analysis should not be limited to modeling. See what you think.

Anaconda 1.9

Filed under: Anaconda,Data Mining,Python — Patrick Durusau @ 10:22 am

Anaconda 1.9

From the homepage:

Completely free enterprise-ready Python distribution for large-scale data processing, predictive analytics, and scientific computing

  • 125+ of the most popular Python packages for science, math, engineering, data analysis
  • Completely free – including for commercial use and even redistribution
  • Cross platform on Linux, Windows, Mac
  • Installs into a single directory and doesn’t affect other Python installations on your system. Doesn’t require root or local administrator privileges.
  • Stay up-to-date by easily updating packages from our free, online repository
  • Easily switch between Python 2.6, 2.7, 3.3, and experiment with multiple versions of libraries, using our conda package manager and its great support for virtual environments

In addition to maintaining Anaconda as a free Python distribution, Continuum Analytics offers consulting/training services and commercial packages to enhance your use of Anaconda.

Before hitting “download,” know that the Linux 64-bit distribution is just short of 649 MB. Not an issue for most folks but there are some edge cases where it might be.

Data-Driven Discovery Initiative

Filed under: BigData,Data Science,Funding — Patrick Durusau @ 10:03 am

Data-Driven Discovery Initiative

Pre-Applications Due February 24, 2014 by 5 pm Pacific Time.

15 Awards at $1,500,000 each, at $200K-$300K/year for five years.

From the post:

Our Data-Driven Discovery Initiative seeks to advance the people and practices of data-intensive science, to take advantage of the increasing volume, velocity, and variety of scientific data to make new discoveries. Within this initiative, we’re supporting data-driven discovery investigators – individuals who exemplify multidisciplinary, data-driven science, coalescing natural sciences with methods from statistics and computer science.

These innovators are striking out in new directions and are willing to take risks with the potential of huge payoffs in some aspect of data-intensive science. Successful applicants must make a strong case for developments in the natural sciences (biology, physics, astronomy, etc.) or science enabling methodologies (statistics, machine learning, scalable algorithms, etc.), and applicants that credibly combine the two are especially encouraged. Note that the Science Program does not fund disease targeted research.

It is anticipated that the DDD initiative will make about 15 awards at ~$1,500,000 each, at $200K-$300K/year for five years.

Pre-applications are due Monday, February 24, 2014 by 5 pm Pacific Time. To begin the pre-application process, click the “Apply Here” button above. We expect to extend invitations for full applications in April 2014. Full applications will be due five weeks after the invitation is sent, currently anticipated for mid-May 2014.

Apply Here

If you are interested in leveraging topic maps in your application, give me a call!

As far as I know, topic maps remain the only technology that documents the basis for merging distinct representations of the same subject.

Mappings, such as you find in Talend and other enterprise data management technologies, is great, so long as you don’t care why a particular mapping was done.

And in many cases, it may not matter. When you are exporting one time mailing list for a media campaign. It’s going to be discarded upon use so who cares?

In other cases, where labor intensive work is required to discover the “why” of a prior mapping, documenting that “why” would be useful.

Topic maps can document as much or as little of the semantics of your data and data processing stack as you desire. Topic maps can’t make legacy data and data semantic issues go away, but they can become manageable.

Rendered Prose Diffs (GitHub)

Filed under: Change Data,Texts — Patrick Durusau @ 9:36 am

Rendered Prose Diffs

From the post:

Today we are making it easier to review and collaborate on prose documents. Commits and pull requests including prose files now feature source and rendered views.

Given the success of GitHub with managing code collaboration, this expansion into prose collaboration is a welcome one.

I like the “rendered” feature. Imagine a topic map that show the impact of a proposed topic on the underlying map, prior to submission.

That could have some interesting possibilities for interactive proofing while authoring.

February 14, 2014

Clojure 1.6.0-beta1

Filed under: Clojure,Functional Programming,Programming — Patrick Durusau @ 9:16 pm

Clojure 1.6.0-beta1 by Alex Miller.

From the post:

Clojure 1.6.0-beta1 is now available.

Try it via
– Download: http://central.maven.org/maven2/org/clojure/clojure/1.6.0-beta1
– Leiningen: [org.clojure/clojure “1.6.0-beta1”]

Highlights below or see the full change log here:
https://github.com/clojure/clojure/blob/master/changes.md

We expect Clojure 1.6.0-beta1 to be close to a release candidate; no other big changes are planned. Please give us your feedback and final issues if you find them so we can do the final release!

Just in time for the weekend, particularly if you like checking beta releases for “issues.”

Enjoy!

How to write a great research paper

Filed under: CS Lectures — Patrick Durusau @ 6:01 pm

How to write a great research paper: Seven simple suggestions by Simon Peyton Jones.

From the description:

Professor Simon Peyton Jones, Microsoft Research, gives a guest lecture on writing. Seven simple suggestions: don’t wait – write, identify your key idea, tell a story, nail your contributions, put related work at the end, put your readers first, listen to your readers.

A truly amazing presentation on writing a good research paper.

BTW, see Simon’s homepage for articles on Haskell, types, functional programming, etc.

SunPy

Filed under: Astroinformatics,Numpy,Python — Patrick Durusau @ 4:54 pm

SunPy

From the webpage:

The SunPy project is a free and open-source software library for solar physics.

SunPy is a community-developed free and open-source software package for solar physics. SunPy is meant to be a free alternative to the SolarSoft data analysis environment which is based on the IDL scientific programming language sold by Exelis. Though SolarSoft is open-source IDL is not and can be prohibitively expensive.

The aim of the SunPy project is to provide the software tools necessary so that anyone can analyze solar data. SunPy is written using the Python programming language and is build upon the scientific Python environment which includes the core packages NumPy, SciPy. The development of SunPy is associated with that Astropy. SunPy was first created in 2011 by a small group of scientists and developers at the NASA Goddard Space Flight Center on nights and weekends.

Future employers will be interested in your data handling skills. Not whether you learned them as part of a hobby (astronomy), on your own or from a class. From a hobby just means you had fun learning them.

I first saw this in a tweet by Scientific Python.

Inline Visualization with D3.js

Filed under: D3,Graphics,Visualization — Patrick Durusau @ 4:42 pm

Inline Visualization with D3.js by Muyueh Lee.

From the post:

Sparkline is an inline visualization that fits nicely within the text. Tufte described it as “data-intense, design-simple, word-sized graphics.” It’s especially useful, so when you have to visualize a list of items, you can list them in a column, where it’s very easy to compare different data (small-multiple technique).

sparkline

I was wondering, however, if there is some other form of inline visualization?

The post walks through how to represent complex numeric import/export data using inline visualization. Quite good. http://muyueh.com/30/imexport/summary/

If you are seriously interested in D3, check out 30D of D3. You won’t be disappointed.

I first saw this in a tweet by DashingD3js.com.

“Envy-Free” Algorithm

Filed under: Algorithms — Patrick Durusau @ 4:07 pm

Valentine’s Day is a good time to discuss the flaws in this “envy free” algorithm.

Researchers Develop “Envy-Free” Algorithm for Settling Disputes from Divorce to Inheritance

The headline should have read:

Researchers Develop Theoretical Algorithm for Settling Disputes from Divorce to Inheritance

From the article:

This algorithm is “envy free” because each party prefers each of its items to a corresponding item of the other party. A potential conflict arises, of course, when the two parties desire the same item at the same time. For example, assume players A and B rank four items, going from left to right, as follows:

A: 1 2 3 4
B: 2 3 4 1

Now, if we give A item 1 and B item 2 (their most preferred), the next unallocated item on both their lists is item 3. Who should get it? The algorithm gives it to A and gives item 4 to B, which is an envy-free allocation because each player prefers its items to the other player’s:

A prefers item 1 to 2 and item 3 to 4
B prefers item 2 to 3 and item 4 to 1

Not only does each party prefer its pair of items to the other’s, but there is no alternative allocation that both parties would prefer, which makes it efficient. Although such an efficient, envy-free allocation is not always possible, the algorithm finds one that comes as close to this ideal as can be achieved.

The first problem with the algorithm is that while it may account for envy, it does not account for the desire of party A to deprive party B of anything B desires.

Failing to account for spite, the algorithm is useful only in non-spiteful divorces and inheritance disputes.

Care to wager on the incidence of non-spiteful divorces and inheritance disputes?

Distinct from any “envy” or “spite” with regard to material items, there are other issues that the algorithm fails to account for in a divorce or inheritance dispute.

I can’t share the details but I do recall the testimony in one case being the other spouse had remarried, “that ugly woman.” That was the real driver behind all of the other issues.

The “envy-free” algorithm isn’t quite ready for a scorned spouse case.

All algorithms sound good in an ideal world. Next time you read about an algorithm, think of data that isn’t ideal for it. Become an algorithm skeptic. Your clients will be better off for it.

February 13, 2014

Conditional probability

Filed under: Graphics,Probability,Visualization — Patrick Durusau @ 8:38 pm

Conditional probability by Victor Powell.

From the post:

A conditional probability is the probability of an event, given some other event has already occurred. In the below example, there are two possible events that can occur. A ball falling could either hit the red shelf (we’ll call this event A) or hit the blue shelf (we’ll call this event B) or both.

Just in terms of visualization prowess, you need to see Victor’s post.

Forbes on Graphs

Filed under: Cloudera,Dendrite,Graphs,Spark,Titan — Patrick Durusau @ 8:23 pm

Big Data Solutions Through The Combination Of Tools by Ben Lorica.

From the post:

As a user who tends to mix-and-match many different tools, not having to deal with configuring and assembling a suite of tools is a big win. So I’m really liking the recent trend towards more integrated and packaged solutions. A recent example is the relaunch of Cloudera’s Enterprise Data hub, to include Spark(1) and Spark Streaming. Users benefit by gaining automatic access to analytic engines that come with Spark(2). Besides simplifying things for data scientists and data engineers, easy access to analytic engines is critical for streamlining the creation of big data applications.

Another recent example is Dendrite(3) – an interesting new graph analysis solution from Lab41. It combines Titan (a distributed graph database), GraphLab (for graph analytics), and a front-end that leverages AngularJS, into a Graph exploration and analysis tool for business analysts:

Another contender in the graph space!

Interesting that Spark comes up a second time for today.

Having Forbes notice a technology gives it credence don’t you think?

I first saw this in a tweet by aurelius.

GraphX: Unifying Data-Parallel and Graph-Parallel Analytics

Filed under: Graphs,GraphX,Parallel Programming,Parallelism — Patrick Durusau @ 8:10 pm

GraphX: Unifying Data-Parallel and Graph-Parallel Analytics by Reynold S Xin, et. al.

Abstract:

From social networks to language modeling, the growing scale and importance of graph data has driven the development of numerous new graph-parallel systems (e.g., Pregel, GraphLab). By restricting the computation that can be expressed and introducing new techniques to partition and distribute the graph, these systems can efficiently execute iterative graph algorithms orders of magnitude faster than more general data-parallel systems. However, the same restrictions that enable the performance gains also make it difficult to express many of the important stages in a typical graph-analytics pipeline: constructing the graph, modifying its structure, or expressing computation that spans multiple graphs. As a consequence, existing graph analytics pipelines compose graph-parallel and data-parallel systems using external storage systems, leading to extensive data movement and complicated programming model.

To address these challenges we introduce GraphX, a distributed graph computation framework that unifies graph-parallel and data-parallel computation. GraphX provides a small, core set of graph-parallel operators expressive enough to implement the Pregel and PowerGraph abstractions, yet simple enough to be cast in relational algebra. GraphX uses a collection of query optimization techniques such as automatic join rewrites to efficiently implement these graph-parallel operators. We evaluate GraphX on real-world graphs and workloads and demonstrate that GraphX achieves comparable performance as specialized graph computation systems, while outperforming them in end-to-end graph pipelines. Moreover, GraphX achieves a balance between expressiveness, performance, and ease of use.

Contributions of the paper:

1. a data model that unifies graphs and collections as composable first-class objects and enables both data-parallel and graph-parallel operations.

2. identifying a “narrow-waist” for graph computation, consisting of a small, core set of graph-operators cast in classic relational algebra; we believe these operators can express all graph computations in previous graph parallel systems, including Pregel and GraphLab.

3. an efficient distributed graph representation embedded in horizontally partitioned collections and indices, and a collection of execution strategies that achieve efficient graph computations by exploiting properties of graph computations.

UPDATE GraphX merged into Spark 0.9.0 release: http://spark.incubator.apache.org/releases/spark-release-0-9-0.html

You will want to be familiar with Spark.

I first saw this in a tweet by Stefano Bertolo.

« Newer PostsOlder Posts »

Powered by WordPress