Another Word For It Patrick Durusau on Topic Maps and Semantic Diversity

December 14, 2013

Step-by-step instructions for using Overview

Filed under: Document Management,News,Reporting,Visualization — Patrick Durusau @ 8:06 pm

Step-by-step instructions for using Overview by Jonathan Stray.

The Overview project posted the first job ad that I ever posted to this blog: Overview: Visualization to Connect the Dots.

A great project that enables ordinary users to manage large numbers of documents, to mine them and then to visualized relationships, all part of the process of news investigations.

Johnathan has written very clear and useful instructions for using Overview.

It is an open source software project so if you see possible improvement or added features, sing out! Or even better, contribute such improvement and/or features to the project.

Everything is Editorial:..

Filed under: Algorithms,Law,Legal Informatics,Search Algorithms,Searching,Semantics — Patrick Durusau @ 7:57 pm

Everything is Editorial: Why Algorithms are Hand-Made, Human, and Not Just For Search Anymore by Aaron Kirschenfeld.

From the post:

Down here in Durham, NC, we have artisanal everything: bread, cheese, pizza, peanut butter, and of course coffee, coffee, and more coffee. It’s great—fantastic food and coffee, that is, and there is no doubt some psychological kick from knowing that it’s been made carefully by skilled craftspeople for my enjoyment. The old ways are better, at least until they’re co-opted by major multinational corporations.

Aside from making you either hungry or jealous, or perhaps both, why am I talking about fancy foodstuffs on a blog about legal information? It’s because I’d like to argue that algorithms are not computerized, unknowable, mysterious things—they are produced by people, often painstakingly, with a great deal of care. Food metaphors abound, helpfully I think. Algorithms are the “special sauce” of many online research services. They are sets of instructions to be followed and completed, leading to a final product, just like a recipe. Above all, they are the stuff of life for the research systems of the near future.

Human Mediation Never Went Away

When we talk about algorithms in the research community, we are generally talking about search or information retrieval (IR) algorithms. A recent and fascinating VoxPopuLII post by Qiang Lu and Jack Conrad, “Next Generation Legal Search – It’s Already Here,” discusses how these algorithms have become more complicated by considering factors beyond document-based, topical relevance. But I’d like to step back for a moment and head into the past for a bit to talk about the beginnings of search, and the framework that we have viewed it within for the past half-century.

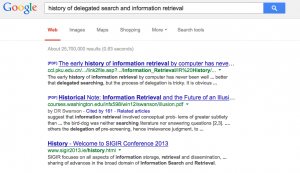
Many early information-retrieval systems worked like this: a researcher would come to you, the information professional, with an information need, that vague and negotiable idea which you would try to reduce to a single question or set of questions. With your understanding of Boolean search techniques and your knowledge of how the document corpus you were searching was indexed, you would then craft a search for the computer to run. Several hours later, when the search was finished, you would be presented with a list of results, sometimes ranked in order of relevance and limited in size because of a lack of computing power. Presumably you would then share these results with the researcher, or perhaps just turn over the relevant documents and send him on his way. In the academic literature, this was called “delegated search,” and it formed the background for the most influential information retrieval studies and research projects for many years—the Cranfield Experiments. See also “On the History of Evaluation in IR” by Stephen Robertson (2008).

In this system, literally everything—the document corpus, the index, the query, and the results—were mediated. There was a medium, a middle-man. The dream was to some day dis-intermediate, which does not mean to exhume the body of the dead news industry. (I feel entitled to this terrible joke as a former journalist… please forgive me.) When the World Wide Web and its ever-expanding document corpus came on the scene, many thought that search engines—huge algorithms, basically—would remove any barrier between the searcher and the information she sought. This is “end-user” search, and as algorithms improved, so too would the system, without requiring the searcher to possess any special skills. The searcher would plug a query, any query, into the search box, and the algorithm would present a ranked list of results, high on both recall and precision. Now, the lack of human attention, evidenced by the fact that few people ever look below result 3 on the list, became the limiting factor, instead of the lack of computing power.

delegated search

The only problem with this is that search engines did not remove the middle-man—they became the middle-man. Why? Because everything, whether we like it or not, is editorial, especially in reference or information retrieval. Everything, every decision, every step in the algorithm, everything everywhere, involves choice. Search engines, then, are never neutral. They embody the priorities of the people who created them and, as search logs are analyzed and incorporated, of the people who use them. It is in these senses that algorithms are inherently human.

A delightful piece on search algorithms that touches at the heart of successful search and/or data integration.

Its first three words capture the issue: Everything is Editorial….

Despite the pretensions of scholars, sages and rogues, everything is editorial, there are no universal semantic primitives.

For convenience in data processing we may choose to treat some tokens as semantic primitives, but that is always a choice that we make.

Once you make that leap, it comes as no surprise that owl:sameAs wasn’t used the same way by everyone who used it.

See: When owl:sameAs isn’t the Same: An Analysis of Identity Links on the Semantic Web by Harry Halpin, Ivan Herman, and Patrick J. Hayes, for one take on the confusion around owl:sameAs.

If you are interested in moving beyond opaque keyword searching, consider Aaron’s post carefully.

Financial Data Accessible from R – Part IV

Filed under: Data,Finance Services,R — Patrick Durusau @ 7:31 pm

The R Trader blog is collecting sources of financial data accessible from R.

Financial Data Accessible from R IV

From the post:

DataMarket is the latest data source of financial data accessible from R I came across. A good tutorial can be found here. I updated the table and the descriptions below.

R Trader is a fairly new blog but I like the emphasis on data sources.

Not the largest list of data sources for financial markets I have ever seen but then it isn’t the quantity of data that makes a difference. (Ask the NSA about 9/11.)

What makes a difference is your skill at collecting the right data and at analyzing it.

Using Lucene Similarity in Item-Item Recommenders

Filed under: Lucene,Recommendation,Similarity — Patrick Durusau @ 5:47 pm

Using Lucene Similarity in Item-Item Recommenders by Sujit Pal.

From the post:

Last week, I implemented 4 (of 5) recommenders from the Programming Assignments of the Introduction to Recommender Systems course on Coursera, but using Apache Mahout and Scala instead of Lenskit and Java. This week, I implement an Item Item Collaborative Filtering Recommender that uses Lucene (more specifically, Lucene’s More Like This query) as the item similarity provider.

By default, Lucene stores document vectors keyed by terms, but can be configured to store term vectors by setting the field attribute TermVector.YES. In case of text documents, words (or terms) are the features which are used to compute similarity between documents. I am using the same dataset as last week, where movies (items) correspond to documents and movie tags correspond to the words. So we build a movie “document” by preprocessing the tags to form individual tokens and concatenating them into a tags field in the index.

Three scenarios are covered. The first two are similar to the scenarios covered with the item-item collaborative filtering recommender from last week, where the user is on a movie page, and we need to (a) predict the rating a user would given a specified movie and (b) find movies similar to a given movie. The third scenario is recommending movies to a given user. We describe each algorithm briefly, and how Lucene fits in.

I’m curious how easy/difficult it would be to re-purpose similarity algorithms to detect common choices in avatar characteristics, acquisitions, interaction with others, goals, etc.?

Thinking that while obvious repetitions are easy enough to avoid, gender, age, names, etc., there are other, more subtle characteristics of interaction with others that would be far harder to be aware of. Much less to mask effectively.

It would require a lot of data on interaction but I assume that isn’t all that difficult to whistle up on any of the major systems.

If you have any pointers to that sort of research, forward them along. I will be posting a collection of pointers and will credit anyone who wants to be credited.

Is Nothing Sacred?

Filed under: Games,Marketing,Topic Maps — Patrick Durusau @ 5:35 pm

Podcast: Spying with Avatars by Nicole Collins Bronzan.

From the post:

As we reported with The New York Times this week, American and British spies have infiltrated online fantasy games, thinking them ripe for use by militants. Justin Elliott joins Stephen Engelberg in the Storage Closet Studio this week to talk about avatars, spies, and the punchline-inspiring intersection of the two.

As shown in the documents leaked from former National Security Agency contractor Edward J. Snowden to The Guardian, the NSA and its British counterpart, Government Communications Headquarters, have created make-believe characters to snoop and to try to recruit informers, while also collecting data and contents of communications between players, who number in the millions across the globe.

The intelligence community is so invested in this new arena, Elliott reports, that they needed a “deconfliction” group to solve redundancies as spies from many agencies bumped into each other in “Second Life.”

But that enthusiasm is not necessarily unfounded.

“One thing that I found — in the course of my reporting — that I found really interesting was a survey from this period when the games were getting very popular that found something around 30 percent of people who played these games and responded in this survey, by an academic researcher, said that they had shared personal information or secrets with their friends within the game that they had never shared with their friends in the real world,” Elliott says. “So I think we can all have sort of a few laughs about this, but for some people, these games really can function as sort of private spaces, which why I think, in part, the documents raise questions about privacy and legality of what the agencies were doing.”

How could anyone agree to infiltrate an online game?

I can understand rendering, torture, assassinations, bribery, lying, ignoring domestic and international law, to say nothing of the Constitution of the United States. Those are routine functions of government. Have been for all of my life.

But infiltrating online games, the one refuge from government malfeasance and malice many people have. That’s just going one step too far.

Gamers need to fight back! Track everyone you come in contact with. Track their questions, who they know, who they are with, etc.

Not all of them will openly ask you if you want to borrow a car bomb? That’s a dead tip-off that you dealing with the FBI.

Government agents are as trackable (perhaps more so) as anyone else. Enlist game management. Start games the government will want to infiltrate.

Track them in your world, so you can remonstrate with public officials in theirs.

PS: Topic maps are a good solution to tracking individuals across avatars and games. And they don’t require a melting data center to run. 😉

24 Days of R: Day 1

Filed under: Programming,R — Patrick Durusau @ 5:17 pm

24 Days of R: Day 1 by PirateGrunt.

From the post:

Last year, the good people at is.R() spent December publishing an R advent calendar. This meant that for 24 days, every day, there was an interesting post featuring analysis and some excellent visualizations in R. I think it’s an interesting (if very challenging) exercise and I’m going to try to do it myself this year. is.R() has been fairly quiet throughout 2013. I hope that doesn’t mean that their effort in December 2012 ruined them.

First, I’ll be talking about how this task will be a bit easier thanks to RStudio and knitr. Yihui Xie has some fantastic examples of all the cool stuff you can do with knitr. I’m particularly intrigued by how it can be used to blog. I’ll admit that I’m not the biggest fan of the WordPress editor. Moreover, it’s counter to the notion of reproducible research. If I’m writing code anyway, why not just upload it directly from RStudio.

Well, you can! William Morris and Carl Boettiger have already figured this out. I had made one half-hearted attempt a few weeks ago, but got hung up on loading images. I’ve taken a second look at Carl’s post and have adopted something very similar to what he has done. FWIW, you can read about image uploading from the master himself here.

The start of an interesting series on using R that runs for 24 days.

I mention it for a couple of reasons. First and foremost, you may want to hone your R skills over the holiday season.

If 2013 was any indicator, the number of specious claims about big data and data processing are only going to increase in 2014.

Knowing R will help you discriminate between advertising, exaggeration, mis-leading, careless, lies, damned lies and just poor data analysis. With the ability to say why it is false, etc.

The second reason though, is that the next big event on the liturgical calendar is Lent.

What would you do (as opposed to give up) for the forty days of Lent? In a blogging context?

JITA Classification System of Library and Information Science

Filed under: Classification,Library,Linked Data — Patrick Durusau @ 5:00 pm

JITA Classification System of Library and Information Science

From the post:

JITA is a classification schema of Library and Information Science (LIS). It is used by E-LIS, an international open repository for scientific papers in Library and Information Science, for indexing and searching. Currently JITA is available in English and has been translated into 14 languages (tr, el, nl, cs, fr, it, ro, ca, pt, pl, es, ar, sv, ru). JITA is also accessible as Linked Open Data, containing 3500 triples.

You had better enjoy triples before link rot overtakes them.

Today CSV, tomorrow JSON?

How long do you think the longest lived triple will last?

Information Data Exchanges

Filed under: Privacy,Security — Patrick Durusau @ 4:47 pm

For Second Year in a Row, Markey Investigation Reveals More Than One Million Requests By Law Enforcement for Americans’ Mobile Phone Data by Sen. Edward Markey.

From the post:

As part of his ongoing investigation into wireless surveillance of Americans by law enforcement, Senator Edward J. Markey (D-Mass.) today released responses from eight major wireless carriers that reveals expanded use of wireless surveillance of Americans, including more than one million requests for the personal mobile phone data of Americans in 2012 by law enforcement. This total may well represent tens or hundreds of thousands more actual individuals due to the law enforcement practice of requesting so-called “cell phone tower dumps” in which carriers provide all the phone numbers of mobile phone users that connect with a tower during a specific period of time. Senator Markey began his investigation last year, revealing 1.3 million requests in 2011 for wireless data by federal, state, and local law enforcement. In this year’s request for information, Senator Markey expanded his inquiry to include information about emergency requests for information, data retention policies, what legal standard –whether a warrant or a lower standard — is used for each type of information request, and the costs for fulfilling requests. The responses received by Senator Markey reveal surveillance startling in both volume and scope.

If you think the telco’s are donating your data, think again.

Sen. Markey reports that in 2012:

  • AT&T received $10 million
  • T-Mobile received $11 million
  • Verizon less than $5 million

Does that make you wonder how much Google, Microsoft and others got paid for their assistance?

If the top technology companies are going to profit from a police state, why shouldn’t the average citizen?

If you find evidence of stock or wire fraud, there should be a series of information data exchanges where both the government and the parties in questions can bid for your information.

It would create an incentive system for common folks to start looking for and collecting information on criminal wrong doing.

Not to mention that it would create competition to insure the holders of such information get a fair price.

Before you protest too much, remember the financial industry and others are selling your data right now, today.

Turn about seems like fair play to me.

Advanced Functional Programming

Filed under: Functional Programming,Haskell — Patrick Durusau @ 4:16 pm

Advanced Functional Programming

Not a MOOC but a course being taught in the Spring of 2014 by Patrik Jansson at Chalmers.

However, there is a wealth of materials, slides, code, reading assignments, Haskell specific search engines and other goodies at the course site.

Requires more than the usual amount of self-discipline but the materials you need are present. Success only requires you.

I first saw this in a tweet by Patrik Jansson.

December 13, 2013

XSL TRANSFORMATIONS (XSLT) VERSION 3.0 [Last Call]

Filed under: W3C,XSLT — Patrick Durusau @ 8:42 pm

XSL TRANSFORMATIONS (XSLT) VERSION 3.0

From the post:

The XSLT Working Group has published today a Last Call Working Draft of XSL Transformations (XSLT) Version 3.0. This specification defines the syntax and semantics of XSLT 3.0, a language for transforming XML documents into other XML documents. A transformation in the XSLT language is expressed in the form of a stylesheet, whose syntax is well-formed XML. Comments are welcome by 10 February 2014. Learn more about the Extensible Markup Language (XML) Activity.

One of the successful activities at the W3C.

A fundamental part of your XML toolkit.

Implementing a Custom Search Syntax…

Filed under: Lucene,Patents,Solr — Patrick Durusau @ 8:33 pm

Implementing a Custom Search Syntax using Solr, Lucene, and Parboiled by John Berryman.

Description:

In a recent project with the United States Patent and Trademark Office, Opensource Connections was asked to prototype the next generation of patent search – using Solr and Lucene. An important aspect of this project was the implementation of BRS, a specialized search syntax used by patent examiners during the examination process. In this fast paced session we will relate our experiences and describe how we used a combination of Parboiled (a Parser Expression Grammar [PEG] parser), Lucene Queries and SpanQueries, and an extension of Solr’s QParserPlugin to build BRS search functionality in Solr. First we will characterize the patent search problem and then define the BRS syntax itself. We will then introduce the Parboiled parser and discuss various considerations that one must make when designing a syntax parser. Following this we will describe the methodology used to implement the search functionality in Lucene/Solr. Finally, we will include an overview our syntactic and semantic testing strategies. The audience will leave this session with an understanding of how Solr, Lucene, and Parboiled may be used to implement their own custom search parser.

One part of the task was to re-implement a thirty (30) year old query language on modern software. (Ouch!)

Uses parboiled to parse the query syntax.

On parboiled:

parboiled is a mixed Java/Scala library providing for lightweight and easy-to-use, yet powerful and elegant parsing of arbitrary input text based on Parsing expression grammars (PEGs). PEGs are an alternative to context free grammars (CFGs) for formally specifying syntax, they make a good replacement for regular expressions and generally have quite a few advantages over the “traditional” way of building parsers via CFGs. parboiled is released under the Apache License 2.0.

Covers a plugin for the custom query language.

Great presentation, although one where you will want to be following the slides (below the video).

Ancient texts published online…

Filed under: Bible,Data,Library — Patrick Durusau @ 5:58 pm

Ancient texts published online by the Bodleian and the Vatican Libraries

From the post:

The Bodleian Libraries of the University of Oxford and the Biblioteca Apostolica Vaticana (BAV) have digitized and made available online some of the world’s most unique and important Bibles and biblical texts from their collections, as the start of a major digitization initiative undertaken by the two institutions.

The digitized texts can be accessed on a dedicated website which has been launched today (http://bav.bodleian.ox.ac.uk). This is the first launch of digitized content in a major four-year collaborative project.
Portions of the Bodleian and Vatican Libraries’ collections of Hebrew manuscripts, Greek manuscripts, and early printed books have been selected for digitization by a team of scholars and curators from around the world. The selection process has been informed by a balance of scholarly and practical concerns; conservation staff at the Bodleian and Vatican Libraries have worked with curators to assess not only the significance of the content, but the physical condition of the items. While the Vatican and the Bodleian have each been creating digital images from their collections for a number of years, this project has provided an opportunity for both libraries to increase the scale and pace with which they can digitize their most significant collections, whilst taking great care not to expose books to any damage, as they are often fragile due to their age and condition.

The newly-launched website features zoomable images which enable detailed scholarly analysis and study. The website also includes essays and a number of video presentations made by scholars and supporters of the digitization project including the Archbishop of Canterbury and Archbishop Jean-Louis Bruguès, o.p. The website blog will also feature articles on the conservation and digitized techniques and methods used during the project. The website is available both in English and Italian.

Originally announced in April 2012, the four-year collaboration aims to open up the two libraries’ collections of ancient texts and to make a selection of remarkable treasures freely available online to researchers and the general public worldwide. Through the generous support of the Polonsky Foundation, this project will make 1.5 million digitized pages freely available over the next three years.

Only twenty-one (21) works up now but 1.5 million pages by the end of the project. This is going to be a treasure trove without end!

Associating these items with their cultural contexts of production, influence on other works, textual history, comments by subsequent works, across multiple languages, is a perfect fit for topic maps.

Kudos to both the Bodleian and the Vatican Libraries!

Requesting Datasets from the Federal Government

Filed under: Dataset,Government,Government Data — Patrick Durusau @ 5:28 pm

Requesting Datasets from the Federal Government by Eruditio Loginquitas.

From the post:

Much has been made of “open government” of late, with the U.S.’s federal government releasing tens of thousands of data sets from pretty much all public-facing offices. Many of these sets are available off of their respective websites. Many are offered in a centralized way at DATA.gov. I finally spent some time on this site in search of datasets with location data to continue my learning of Tableau Public (with an eventual planned move to ArcMap).

I’ve been appreciating how much data are required to govern effectively but also how much data are created in the work of governance, particularly in an open and transparent society. There are literally billions of records and metrics required to run an efficient modern government. In a democracy, the tendency is to make information available—through sunshine laws and open meetings laws and data requests. The openness is particularly pronounced in cases of citizen participation, academic research, and journalistic requests. These are all aspects of a healthy interchange between citizens and their government…and further, digital government.

Public Requests for Data

One of the more charming aspects of the site involves a public thread which enables people to make requests for the creation of certain data sets by developers. People would make the case for the need for certain information. Some would offer “trades” by making promises about how they would use the data and what they would make available to the larger public. Others would simply make a request for the data. Still others would just post “requests,” which were actually just political or personal statements. (The requests site may be viewed here: https://explore.data.gov/nominate?&page;=1 .)

What datasets would you like to see?

The rejected requests can interesting, for example:

Properties Owned by Congressional Members Rejected

Congressional voting records Rejected

I don’t think the government has detailed information sufficient to answer the one about property owned by members of Congress.

On the other hand there are only 535 members so manual data mining in each state should turn up most of the public information fairly easily. The not public information could be more difficult.

The voting records request is puzzling since that is public record. And various rant groups print up their own analysis of voting records.

I don’t know, given the number of requests “Under Review” if it would be a good use of time but requesting the data behind opaque reports might illuminate the areas being hidden from transparency.

Storm Technical Preview Available Now!

Filed under: Hadoop,Hortonworks,Storm — Patrick Durusau @ 5:09 pm

Storm Technical Preview Available Now! by Himanshu Bari.

From the post:

In October, we announced our intent to include and support Storm as part of Hortonworks Data Platform. With this commitment, we also outlined and proposed an open roadmap to improve the enterprise readiness of this key project. We are committed to doing this with a 100% open source approach and your feedback is immensely valuable in this process.

Today, we invite you to take a look at our Storm technical preview. This preview includes the latest release of Storm with instructions on how to install Storm on Hortonworks Sandbox and run a sample topology to familiarize yourself with the technology. This is the final pre-Apache release of Storm.

You know this but I wanted to emphasize how your participation in alpha/beta/candidate/preview releases benefits not only the community but yourself as well.

Bugs that are found and squashed now won’t bother you (or anyone else) later in production.

Not to mention you get to exercise your skills before using the software become routine and so does your use of it.

Enjoy the weekend!

A million first steps [British Library Image Release]

Filed under: Data,Image Understanding,Library — Patrick Durusau @ 4:48 pm

A million first steps by Ben O’Steen.

From the post:

We have released over a million images onto Flickr Commons for anyone to use, remix and repurpose. These images were taken from the pages of 17th, 18th and 19th century books digitised by Microsoft who then generously gifted the scanned images into the Public Domain. The images themselves cover a startling mix of subjects: There are maps, geological diagrams, beautiful illustrations, comical satire, illuminated and decorative letters, colourful illustrations, landscapes, wall-paintings and so much more that even we are not aware of.

Which brings me to the point of this release. We are looking for new, inventive ways to navigate, find and display these ‘unseen illustrations’. The images were plucked from the pages as part of the ‘Mechanical Curator’, a creation of the British Library Labs project. Each image is individually addressible, online, and Flickr provies an API to access it and the image’s associated description.

We may know which book, volume and page an image was drawn from, but we know nothing about a given image. Consider the image below. The title of the work may suggest the thematic subject matter of any illustrations in the book, but it doesn’t suggest how colourful and arresting these images are.

(Aside from any educated guesses we might make based on the subject matter of the book of course.)

BL-image

See more from this book: “Historia de las Indias de Nueva-España y islas de Tierra Firme…” (1867)

Next steps

We plan to launch a crowdsourcing application at the beginning of next year, to help describe what the images portray. Our intention is to use this data to train automated classifiers that will run against the whole of the content. The data from this will be as openly licensed as is sensible (given the nature of crowdsourcing) and the code, as always, will be under an open licence.

The manifests of images, with descriptions of the works that they were taken from, are available on github and are also released under a public-domain ‘licence’. This set of metadata being on github should indicate that we fully intend people to work with it, to adapt it, and to push back improvements that should help others work with this release.

There are very few datasets of this nature free for any use and by putting it online we hope to stimulate and support research concerning printed illustrations, maps and other material not currently studied. Given that the images are derived from just 65,000 volumes and that the library holds many millions of items.

If you need help or would like to collaborate with us, please contact us on email, or twitter (or me personally, on any technical aspects)

Think about the numbers. One million images from 65,000 volumes. The British Library holds millions of items.

Encourage more releases like this one with good use of and suggestions for this release!

Immersion Reveals…

Filed under: Graphs,Networks,Social Networks — Patrick Durusau @ 4:24 pm

Immersion Reveals How People are Connected via Email by Andrew Vande Moere.

From the post:

Immersion [mit.edu] is a quite revealing visualization tool of which the NSA – or your own national security agency – can only be jealous of… Developed by MIT students Daniel Smilkov, Deepak Jagdish and César Hidalgo, Immersion generates a time-varying network visualization of all your email contacts, based on how you historically communicated with them.

Immersion is able to aggregate and analyze the “From”, “To”, “Cc” and “Timestamp” data of all the messages in any (authorized) Gmail, MS Exchange or Yahoo email account. It then filters out the ‘collaborators’ – people from whom one has received, and sent, at least 3 email messages from, and to.

Remember what I said about IT making people equal?

Access someone’s email account, which are often hacked, and you can have a good idea of their social network.

Or I assume you can run it across mailing list archives with a diluted result for any particular person.

Getting Started Writing YARN Applications [Webinar – December 18th]

Filed under: Hadoop YARN,Hortonworks — Patrick Durusau @ 4:04 pm

Getting Started Writing YARN Applications by Lisa Sensmeier.

From the post:

There is a lot of information available on the benefits of Apache YARN but how do you get started building applications? On December 18 at 9am Pacific Time, Hortonworks will host a webinar and go over just that: what independent software vendors (ISVs) and developers need to do to take the first steps towards developing applications or integrating existing applications on YARN.

Register for the webinar here.

My experience with webinars has been uneven to say the least.

Every Mike McCandless webinar (live or recorded) has been a real treat. Great presentation skills, high value content and well organized.

I have seen other webinars with poor presentation skills, low value or mostly ad content that were poorly organized.

No promises on what you will see on the 18th of December but let’s hope for the former and not the latter. (No pressure, no pressure. 😉 )

Fast range faceting…

Filed under: Facets,Lucene — Patrick Durusau @ 3:47 pm

Fast range faceting using segment trees and the Java ASM library by Mike McCandless.

From the post:

In Lucene’s facet module we recently added support for dynamic range faceting, to show how many hits match each of a dynamic set of ranges. For example, the Updated drill-down in the Lucene/Solr issue search application uses range facets. Another example is distance facets (< 1 km, < 2 km, etc.), where the distance is dynamically computed based on the user's current location. Price faceting might also use range facets, if the ranges cannot be established during indexing. To implement range faceting, for each hit, we first calculate the value (the distance, the age, the price) to be aggregated, and then lookup which ranges match that value and increment its counts. Today we use a simple linear search through all ranges, which has O(N) cost, where N is the number of ranges. But this is inefficient! ...

Mike lays out a more efficient approach, that hasn’t been folded into Lucene, yet.

I like the example of distance from a user as an example of distance as a dynamic facet.

Distance issues are common with mobile devices, but most of those are merchants trying to sell you something.

Not a public database use case, but what if you had an alternative map of a metropolitan area? Where the distance issue was to caches, safe houses, contacts, etc.?

You are double thumbing your mobile device just like everyone else but yours is displaying different data.

You could get false information that is auto-corrected by a local app. 😉

You may have heard the old saying:

The old saying goes that God made men, but Sam Colt made them equal.

We may need to add IT to that list.

Nude Carla Bruni pics…

Filed under: Cybersecurity,Security — Patrick Durusau @ 1:27 pm

Nude Carla Bruni pics masking Trojan lured G20 attendees to click by Lisa Vaas.

From the post:

Hackers used nude photos of former French first lady Carla Bruni as bait to get dozens of G20 representatives to click on what turned out to be a Trojan-delivering email.

According to News.com.au, dozens of diplomats attending the 2011 sixth G20 summit in Cannes were snared.

The tempting message that masked the Trojan was sent to the finance ministers and central bank representatives that attend these summits.

All that was needed to get those high-value espionage targets to click were these nine words:

To see naked pictures of Carla Bruni click here

So you can’t program Stuxnet class computer worms.

That doesn’t mean you can’t be a hacker.

If you can send email with the line: To see naked pictures of (insert name) click here., you are more than half-way to being a computer hacker.

You do have to remove “(insert name)” and insert a name your targets are likely to recognize. And include a hyperlink to the photos.

You can pick up malware just about everywhere on the Net.

For non-hackers out there, this is another example of failure to follow common security rules.

  1. Never follow links in email from untrusted sources.
  2. Never follow links in email promising nude photos, wealth, relief efforts, etc. from any source.
  3. Never open attachments from untrusted sources or even trusted ones if you aren’t expecting an attachment.

Following those three rules would make all U.S. agencies and departments more secure than the $millions Congress will spend post-Snowden.

No charge.

December 12, 2013

Codd’s Relational Vision…

Filed under: Database,NoSQL,SQL — Patrick Durusau @ 7:59 pm

Codd’s Relational Vision – Has NoSQL Come Full Circle? by Doug Turnbull.

From the post:

Recently, I spoke at NoSQL Matters in Barcelona about database history. As somebody with a history background, I was pretty excited to dig into the past, beyond the hype and marketing fluff, and look specifically at what technical problems each generation of database solved and where they in-turn fell short.

However, I got stuck at one moment in time I found utterly fascinating: the original development of relational databases. So much of the NoSQL movement feels like a rebellion against the “old timey” feeling relational databases. So I thought it would be fascinating to be a contrarian, to dig into what value relational databases have added to the world. Something everyone thinks is obvious but nobody really understands.

It’s very easy and popular to criticize relational databases. What folks don’t seem to do is go back and appreciate how revolutionary relational databases were when they came out. We forget what problems they solved. We forget how earlier databases fell short, and how relational databases solved the problems of the first generation of databases. In short, relational databases were the noSomething, and I aimed to find out what that something was.

And from that apply those lessons to today’s NoSQL databases. Are today’s databases repeating mistakes of the past? Or are they filling an important niche (or both?).

This is a must read article if you are not choosing databases based on marketing hype.

It’s nice to hear IT history taken seriously.

A Brand New Milky Way Project

Filed under: Astroinformatics,Crowd Sourcing — Patrick Durusau @ 7:44 pm

A Brand New Milky Way Project by Robert Simpson.

From the post:

Just over three years the Zooniverse launched the Milky Way Project (MWP), my first citizen science project. I have been leading the development and science of the MWP ever since. 50,000 volunteers have taken part from all over the world, and they’ve helped us do real science, including creating astronomy’s largest catalogue of infrared bubbles – which is pretty cool.

Today the original Milky Way Project (MWP) is complete. It took about three years and users have drawn more than 1,000,000 bubbles and several million other objects, including star clusters, green knots, and galaxies. It’s been a huge success but: there’s even more data! So it is with glee that we have announced the brand new Milky Way Project! It’s got more data, more objects to find, and it’s even more gorgeous.

Another great crowd sourced project!

Bear in mind that the Greek New Testament has approximately 138,000 words and 469,000 words in the Hebrew Bible.

The success of the Milky Way and other crowd sourced projects makes you wonder why images of biblical manuscripts aren’t setup for crowd transcription doesn’t it?

Use your expertise – build a topical search engine

Filed under: Search Engines,Searching — Patrick Durusau @ 7:27 pm

Use your expertise – build a topical search engine

From the post:

Did you know that a topical search engine can help your users find content from more than a single domain? You can use your expertise to provide a delightful user experience targeting a particular topic on the Web.

There are two main types of engines built with Google Custom Search: site search and topical search. While site search is relatively straightforward – it lets you implement a search for a blog or a company website – topical search is an entirely different story.

Topical search engines focus on a particular topic and therefore usually cover a part of the Web that is larger than a single domain. Because of this topical engines need to be carefully fine-tuned to bring the best results to the users.

OK, yes, it is a Google API and run by Google.

That doesn’t trouble me overmuch. My starting assumption is that anything that leaves my subnet is being recorded.

Recorded and sold if there is a buyer for the information.

Doesn’t even have to leave my subnet if they have the right equipment.

Anyway, think of Google’s Custom Search API as another source of data like Common Crawl.

It’s more current than Common Crawl if that is one of your project requirements. And probably easier to use for most folks.

And you can experiment at very low risk to see if your custom search engine is likely to be successful.

Whether you want a public or private custom search engine, I am interested in hearing about your experiences.

Google Map Overlays

Filed under: Google Maps,Mapping,Maps — Patrick Durusau @ 7:10 pm

Google Map Overlays by Dustin Smith.

From the post:

National Geographic is adding 500 of their classic maps to the Google public data archive. Basically, these are layers mapped onto Google’s existing map engine. The press release contained two examples, but bizarrely, no link to the public gallery where the NattyG maps will eventually appear.

My experience with press releases and repeated press release sites is that they rarely include meaningful links.

I don’t have an explanation as to why but I have seen it happen too often to be by chance.

Some sites include off-site links but trap you within a window from that site with their ads.

Harvard gives new meaning to meritocracy

Filed under: Data,Government,IT — Patrick Durusau @ 7:00 pm

Harvard gives new meaning to meritocracy by Kaiser Fung.

From the post:

Due to the fastidious efforts of Professor Harvey Mansfield, Harvard has confirmed the legend that “the hard part is to get in”. Not only does it appear impossible to flunk out but according to the new revelation (link), the median grade given is A- and “the most frequently awarded grade at Harvard College is actually a straight A”.

The last sentence can be interpreted in two ways. If “straight A” means As across the board, then he is saying a lot of graduates end up with As in all courses taken. If “straight A” is used to distinguish between A and A-, then all he is saying is that the median grade is A- and the mode is A. Since at least 50% of the grades given are A or A- and there are more As than A-s, there would be at least 25% As, possibly a lot more.

Note also that the median being A- tells us nothing about the bottom half of the grades. If no professor even gave out anything below an A-, the median would still be A-. If such were to be the case, then the 5th percentile, 10th percentile, 25th percentile, etc. would all be A-.

For full disclosure, Harvard should tell us what proportion fo grades are As and what proportion are A-s.

And to think, I complain about government contractors having a sense of entitlement, divorced from their performance.

Looks like that is also true for all those Harvard (and other) graduates that are now employed by the U.S. government.

Nothing you or I can do about it but something you need to take into account when dealing with the U.S. government.

I keep hoping that some department, agency, government or government in waiting will become interested in weapons grade IT.

Reasoning that when other departments, agencies, governments or governments in waiting start feeling the heat, it may set off an IT arms race.

Not the waste for the sake of waste sort of arms race we had in the 1960’s but one with real winners and losers.

Astroinformatics 2013

Filed under: Astroinformatics,BigData — Patrick Durusau @ 5:38 pm

Astroninformatics 2013: Knowledge from Data

The program runs from Monday, December 9, 2013 until December 13, 2013.

The first entire day and half of the second day are now available at the conference link.

While you wait for more video, the paper titles link to PDF files.

Highly recommended.

Big data before it was the buzz word “big data.”

UnQLite

Filed under: Database,NoSQL — Patrick Durusau @ 5:27 pm

UnQLite

From the webpage:http://unqlite.org/features.html#self_contained

UnQLite is a in-process software library which implements a self-contained, serverless, zero-configuration, transactional NoSQL database engine. UnQLite is a document store database similar to MongoDB,Redis, CouchDB etc. as well a standard Key/Value store similar to BerkeleyDB,LevelDB, etc.

UnQLite is an embedded NoSQL (Key/Value store and Document-store) database engine. Unlike most other NoSQL databases, UnQLite does not have a separate server process. UnQLite reads and writes directly to ordinary disk files. A complete database with multiple collections, is contained in a single disk file. The database file format is cross-platform, you can freely copy a database between 32-bit and 64-bit systems or between big-endian and little-endian architectures. UnQLite features includes:

Does this have the look and feel of a “…just like a Camry…” commercial? 😉

In case you have been under a rock: 2013 Toyota Camry TV Commercial – “Remote”

Still, you may find it meets your requirements better than others.

Patent database of 15 million chemical structures goes public

Filed under: Cheminformatics,Data — Patrick Durusau @ 3:55 pm

Patent database of 15 million chemical structures goes public by Richard Van Noorden.

From the post:

The internet’s wealth of free chemistry data just got significantly larger. Today, the European Bioinformatics Institute (EBI) has launched a website — www.surechembl.org — that allows anyone to search through 15 million chemical structures, extracted automatically by data-mining software from world patents.

The initiative makes public a 4-terabyte database that until now had been sold on a commercial basis by a software firm, SureChem, which is folding. SureChem has agreed to transfer its information over to the EBI — and to allow the institute to use its software to continue extracting data from patents.

“It is the first time a world patent chemistry collection has been made publicly available, marking a significant advance in open data for use in drug discovery,” says a statement from Digital Science — the company that owned SureChem, and which itself is owned by Macmillan Publishers, the parent company of Nature Publishing Group.

This is one of those Selling Data opportunities that Vincent Granville was talking about.

You can harvest data here, combine it (hopefully using a topic map) with other data and market the results. Not everyone who has need for the data has the time or skills required to re-package the data.

What seems problematic to me is how to reach potential buyers of information?

If you produce data and license it to one of the large data vendors, what’s the likelihood your data will get noticed?

On the other hand, direct sale of data seems like a low percentage deal.

Suggestions?

Saint Nicolas brought me a new Batch Importer!!!

Filed under: Graphs,Neo4j — Patrick Durusau @ 3:30 pm

Saint Nicolas brought me a new Batch Importer!!! by Rik Van Bruggen.

From the post:

After my previous blogpost about import strategies, the inimitable Michael Hunger decided to take my pros/cons to heart and created a new version of the batch importer – which is now even updated to the very last GA version of neo4j 2.0. Previously you actually needed to use Maven to build the importer – which I did not have/know, and therefore never used it. But now, it’s supposed to be as easy as download zip-file, unzip, run – so I of course HAD to test it out. Here’s what happened.

It’s amazing how unreasonable some users can be. Imagine, wanting a simple way to import data into a database. I tell you, IT has been far too easy on users over the years. 😉

If you want your software to be used, making your software more user friendly is a good idea.

As a data point, consider the recent W3C interest in CSV. At the other end of the spectrum from SWRL, wouldn’t you say?

Although I do hope we all remember that CSV was not invented at the W3C. (See RFC4180 for the most common features of CSV files.)

What are you going to import into your Neo4j 2.0.0 database?

December 11, 2013

Neo4j 2.0 GA – Graphs for Everyone

Filed under: Graphs,Neo4j — Patrick Durusau @ 9:05 pm

Neo4j 2.0 GA – Graphs for Everyone by Andreas Kollegger.

From the post:

A dozen years ago, we created a graph database because we needed it. We focused on performance, reliability and scalability, cementing a foundation for graph databases with the 0.x series, then expanding the features with the 1.x series. Today, we announce the first of the 2.x series of Neo4j and a commitment to take graph databases further to the mainstream.

Neo4j 2.0 has been brewing since early 2013, with almost a year of intense engineering effort producing the most significant change to graph databases since the term was invented. What makes this version of Neo4j so special? Two things: the power of a purpose-built graph query language, and a tool designed to let that language flow from your fingertips. Neo4j 2.0 is the graph database we dreamed about over a dozen years ago. And it’s available today!

Download Neo4j 2.0.

I’m not overly impressed with normalization.

After all, normalization is actually an abnormal condition. That is one you rarely encounter outside a relational database.

That being the case, why do we shoe horn non-normalized data into normalized form?

Granting that yes, with older technology, normalization made things possible that weren’t otherwise possible.

My question is why, several decades later, are we still shoe horning data into normalized forms?

Comments?

…Graph Analytics

Filed under: Graphs,Gremlin,Hadoop,Titan — Patrick Durusau @ 8:42 pm

Big Data in Security – Part III: Graph Analytics by Levi Gundert.

In interview form with Michael Howe and Preetham Raghunanda.

You will find two parts of the exchange particularly interesting:

You mention very large technology companies, obviously Cisco falls into this category as well — how is TRAC using graph analytics to improve Cisco Security products?

Michael: How we currently use graph analytics is an extension of the work we have been doing for some time. We have been pulling data from different sources like telemetry and third-party feeds in order to look at the relationships between them, which previously required a lot of manual work. We would do analysis on one source and analysis on another one and then pull them together. Now because of the benefits of graph technology we can shift that work to a common view of the data and give people the ability to quickly access all the data types with minimal overhead using one tool. Rather than having to query multiple databases or different types of data stores, we have a polyglot store that pulls data in from multiple types of databases to give us a unified view. This allows us two avenues of investigation: one, security investigators now have the ability to rapidly analyze data as it arrives in an ad hoc way (typically used by security response teams) and the response times dramatically drop as they can easily view related information in the correlations. Second are the large-scale data analytics. Folks with traditional machine learning backgrounds can apply algorithms that did not work on previous data stores and now they can apply those algorithms across a well-defined data type – the graph.

For intelligence analysts, being able to pivot quickly across multiple disparate data sets from a visual perspective is crucial to accelerating the process of attribution.

Michael: Absolutely. Graph analytics is enabling a much more agile approach from our research and analysis teams. Previously when something of interest was identified there was an iterative process of query, analyze the results, refine the query, wash, rinse, and repeat. This process moves from taking days or hours down to minutes or seconds. We can quickly identify the known information, but more importantly, we can identify what we don’t know. We have a comprehensive view that enables us to identify data gaps to improve future use cases.

Did you catch the “…to a common view of the data…” caveat In the third sentence of Michael’s first reply.

Not to deny the usefulness of Titan (the graph solution being discussed) but to point out that current graphs require normalization of data.

For Cisco, that is a winning solution.

But then Cisco can use a closed solution based on normalized data.

Importing, analyzing and then returning results to heterogeneous clients could require a different approach.

Or if you have legacy data that spans centuries.

Or even agencies, departments, or work groups.

« Newer PostsOlder Posts »

Powered by WordPress