Another Word For It Patrick Durusau on Topic Maps and Semantic Diversity

December 27, 2012

HyperGraphDB 1.2 Final

Filed under: Graphs,Hypergraphs,Networks — Patrick Durusau @ 10:25 am

HyperGraphDB 1.2 Final

From the post:

HyperGraphDB is a general purpose, free open-source data storage mechanism. Geared toward modern applications with complex and evolving domain models, it is suitable for semantic web, artificial intelligence, social networking or regular object-oriented business applications.

This release contains numerous bug fixes and improvements over the previous 1.1 release. A fairly complete list of changes can be found at the Changes for HyperGraphDB, Release 1.2 wiki page.

  1. Introduction of a new HyperNode interface together with several implementations, including subgraphs and access to remote database peers. The ideas behind are documented in the blog post HyperNodes Are Contexts.
  2. Introduction of a new interface HGTypeSchema and generalized mappings between arbitrary URIs and HyperGraphDB types.
  3. Implementation of storage based on the BerkeleyDB Java Edition (many thanks to Alain Picard and Sebastian Graf!). This version of BerkeleyDB doesn’t require native libraries, which makes it easier to deploy and, in addition, performs better for smaller datasets (under 2-3 million atoms).
  4. Implementation of parametarized pre-compiled queries for improved query performance. This is documented in the Variables in HyperGraphDB Queries blog post.

HyperGraphDB is a Java based product built on top of the Berkeley DB storage library.

This release dates from November 4, 2012. Apologies for missing the news until now.

Design by HiPPO?

Filed under: Design,Interface Research/Design,Usability,Users — Patrick Durusau @ 6:29 am

Mark Needham in Restricting your own learning, references: Practical Guide to Controlled Experiments on the Web: Listen to Your Customers not to the HiPPO by Ron Kohavi, Randal M. Henne and Dan Sommerfield.

HiPPO = “…the Highest Paid Person’s Opinion (HiPPO).”

Abstract:

The web provides an unprecedented opportunity to evaluate ideas quickly using controlled experiments, also called randomized experiments (single-factor or factorial designs), A/B tests (and their generalizations), split tests, Control/Treatment tests, and parallel flights. Controlled experiments embody the best scientific design for establishing a causal relationship between changes and their influence on user-observable behavior. We provide a practical guide to conducting online experiments, where end-users can help guide the development of features. Our experience indicates that significant learning and return-oninvestment (ROI) are seen when development teams listen to their customers, not to the Highest Paid Person’s Opinion (HiPPO). We provide several examples of controlled experiments with surprising results. We review the important ingredients of running controlled experiments, and discuss their limitations (both technical and organizational). We focus on several areas that are critical to experimentation, including statistical power, sample size, and techniques for variance reduction. We describe common architectures for experimentation systems and analyze their advantages and disadvantages. We evaluate randomization and hashing techniques, which we show are not as simple in practice as is often assumed. Controlled experiments typically generate large amounts of data, which can be analyzed using data mining techniques to gain deeper understanding of the factors influencing the outcome of interest, leading to new hypotheses and creating a virtuous cycle of improvements. Organizations that embrace controlled experiments with clear evaluation criteria can evolve their systems with automated optimizations and real-time analyses. Based on our extensive practical experience with multiple systems and organizations, we share key lessons that will help practitioners in running trustworthy controlled experiments.

Not recent (2007) but a real delight and as relevant today as when it was published.

The ACM Digital Library reports 37 citing publications.

Definitely worth a close read and consideration as you design your next topic map interface.

Neo4j 1.9.M03 Release

Filed under: Graphs,Neo4j — Patrick Durusau @ 6:00 am

Neo4j 1.9.M03 Release

Peter Neubauer announces the last Noe4j 1.9 milestone for 2012.

Focuses on stability for the 1.9 GA.

Nice way to start the New Year!

Outing Gun Owners?

Filed under: Mapping,Maps — Patrick Durusau @ 5:45 am

Map: Where are the gun permits in your neighborhood?

From the post:

The map indicates the addresses of all pistol permit holders in Westchester and Rockland counties. Each dot represents an individual permit holder licensed to own a handgun — a pistol or revolver. The data does not include owners of long guns — rifles or shotguns — which can be purchased without a permit. Being included in this map does not mean the individual at a specific location owns a weapon, just that they are licensed to do so.

Data for all permit categories, unrestricted carry, premises, business, employment, target and hunting, is included, but permit information is not available on an individual basis.

To create the map, The Journal News submitted Freedom of Information requests for the names and addresses of all pistol permit holders in Westchester, Rockland and Putnam. By state law, the information is public record.

The mapping has provoked considerable discussion (35,153 Facebook recommendations as of December 27, 2012).

Several additional or alternative mappings come to mind:

  • Mapping the addresses of people arrested for gun related violence and intersecting those addresses with the gun permit addresses.
  • Mapping the addresses of people arrested for drug offenses and intersecting those addresses with the gun violence addresses.
  • Or using a topic map to create more detailed maps of associations (political contributions?) and other data.

Who do you want to “out” and on what basis?


I found this following this post by Ed Chi, which in turn lead to a post by Jeremiah Owyang here, who remarks: “Perhaps one of the most controversial things I’ve seen in tech.”

I fail to see the “controversy.” The permit owners did in fact give their addresses as part of public records.

What part of not disclosing information you want to remain private seems unclear?

December 26, 2012

Want some hackathon friendly altmetrics data?…

Filed under: Citation Analysis,Graphs,Networks,Tweets — Patrick Durusau @ 7:30 pm

Want some hackathon friendly altmetrics data? arXiv tweets dataset now up on figshare by Euan Adie.

From the post:

The dataset contains details of approximately 57k tweets linking to arXiv papers, found between 1st January and 1st October this year. You’ll need to supplement it with data from the arXiv API if you need metadata about the preprints linked to. The dataset does contain follower counts and lat/lng pairs for users where possible, which could be interesting to plot.

Euan has some suggested research directions and more details on the data set.

Something to play with during the holiday “down time.” 😉

I first saw this in a tweet by Jason Priem.

EOL Classification Providers [Encyclopedia of Life]

Filed under: Bioinformatics,Biomedical,Classification — Patrick Durusau @ 7:17 pm

EOL Classification Providers

From the webpage:

The information on EOL is organized using hierarchical classifications of taxa (groups of organisms) from a number of different classification providers. You can explore these hierarchies in the Names tab of EOL taxon pages. Many visitors would expect to see a single classification of life on EOL. However, we are still far from having a classification scheme that is universally accepted.

Biologists all over the world are studying the genetic relationships between organisms in order to determine each species’ place in the hierarchy of life. While this research is underway, there will be differences in opinion on how to best classify each group. Therefore, we present our visitors with a number of alternatives. Each of these hierarchies is supported by a community of scientists, and all of them feature relationships that are controversial or unresolved.

How far from universally accepted?

Consider the sources for classification:

AntWeb
AntWeb is generally recognized as the most advanced biodiversity information system at species level dedicated to ants. Altogether, its acceptance by the ant research community, the number of participating remote curators that maintain the site, number of pictures, simplicity of web interface, and completeness of species, make AntWeb the premier reference for dissemination of data, information, and knowledge on ants. AntWeb is serving information on tens of thousands of ant species through the EOL.

Avibase
Avibase is an extensive database information system about all birds of the world, containing over 6 million records about 10,000 species and 22,000 subspecies of birds, including distribution information, taxonomy, synonyms in several languages and more. This site is managed by Denis Lepage and hosted by Bird Studies Canada, the Canadian copartner of Birdlife International. Avibase has been a work in progress since 1992 and it is offered as a free service to the bird-watching and scientific community. In addition to links, Avibase helped us install Gill, F & D Donsker (Eds). 2012. IOC World Bird Names (v 3.1). Available at http://www.worldbirdnames.org as of 2 May 2012.  More bird classifications are likely to follow

CoL
The Catalogue of Life Partnership (CoLP) is an informal partnership dedicated to creating an index of the world’s organisms, called the Catalogue of Life (CoL). The CoL provides different forms of access to an integrated, quality, maintained, comprehensive consensus species checklist and taxonomic hierarchy, presently covering more than one million species, and intended to cover all know species in the near future. The Annual Checklist EOL uses contains substantial contributions of taxonomic expertise from more than fifty organizations around the world, integrated into a single work by the ongoing work of the CoLP partners. 

FishBase
FishBase is a global information system with all you ever wanted to know about fishes. FishBase is a relational database with information to cater to different professionals such as research scientists, fisheries managers, zoologists and many more. The FishBase Website contains data on practically every fish species known to science. The project was developed at the WorldFish Center in collaboration with the Food and Agriculture Organization of the United Nations and many other partners, and with support from the European Commission. FishBase is serving information on more than 30,000 fish species through EOL.

Index Fungorum
The Index Fungorum, the global fungal nomenclator coordinated and supported by the Index Fungorum Partnership (CABI, CBS, Landcare Research-NZ), contains names of fungi (including yeasts, lichens, chromistan fungal analogues, protozoan fungal analogues and fossil forms) at all ranks.

ITIS
The Integrated Taxonomic Information System (ITIS) is a partnership of federal agencies and other organizations from the United States, Canada, and Mexico, with data stewards and experts from around the world (see http://www.itis.gov). The ITIS database is an automated reference of scientific and common names of biota of interest to North America . It contains more than 600,000 scientific and common names in all kingdoms, and is accessible via the World Wide Web in English, French, Spanish, and Portuguese (http://itis.gbif.net). ITIS is part of the US National Biological Information Infrastructure (http://www.nbii.gov).

IUCN
International Union for Conservation of Nature (IUCN) helps the world find pragmatic solutions to our most pressing environment and development challenges. IUCN supports scientific research; manages field projects all over the world; and brings governments, non-government organizations, United Nations agencies, companies and local communities together to develop and implement policy, laws and best practice. EOL partnered with the IUCN to indicate status of each species according to the Red List of Threatened Species.

Metalmark Moths of the World
Metalmark moths (Lepidoptera: Choreutidae) are a poorly known, mostly tropical family of microlepidopterans. The Metalmark Moths of the World LifeDesk provides species pages and an updated classification for the group.

NCBI
As a U.S. national resource for molecular biology information, NCBI’s mission is to develop new information technologies to aid in the understanding of fundamental molecular and genetic processes that control health and disease. The NCBI taxonomy database contains the names of all organisms that are represented in the genetic databases with at least one nucleotide or protein sequence.

The Paleobiology Database
The Paleobiology Database is a public resource for the global scientific community. It has been organized and operated by a multi-disciplinary, multi-institutional, international group of paleobiological researchers. Its purpose is to provide global, collection-based occurrence and taxonomic data for marine and terrestrial animals and plants of any geological age, as well as web-based software for statistical analysis of the data. The project’s wider, long-term goal is to encourage collaborative efforts to answer large-scale paleobiological questions by developing a useful database infrastructure and bringing together large data sets.

The Reptile Database 
This database provides information on the classification of all living reptiles by listing all species and their pertinent higher taxa. The database therefore covers all living snakes, lizards, turtles, amphisbaenians, tuataras, and crocodiles. It is a source of taxonomic data, thus providing primarily (scientific) names, synonyms, distributions and related data. The database is currently supported by the Systematics working group of the German Herpetological Society (DGHT)

WoRMS
The aim of a World Register of Marine Species (WoRMS) is to provide an authoritative and comprehensive list of names of marine organisms, including information on synonymy. While highest priority goes to valid names, other names in use are included so that this register can serve as a guide to interpret taxonomic literature.

Those are “current” classifications, which don’t reflect historical classifications (used by our ancestors), nor future classifications.

The four states of matter becoming > 500 states of matter for example.

Instead of “universal acceptance,” how does “working agreement for a specific purpose” sound?
Neo4j 1.8.1 – Stability and (Cypher) Performance

Filed under: Cypher,Graphs,Neo4j — Patrick Durusau @ 5:47 pm

Neo4j 1.8.1 – Stability and (Cypher) Performance by Michael Hunger.

A maintenance release for the Neo4j 1.8.* line.

Michael writes:

In particular, Cypher has been extended with support for the new Bidirectional Traverser Framework, meaning query times are in some cases cut down to a third of what they used to be. Also, Andres spent time optimizing memory consumption, so you can run more and larger Cypher queries faster than ever before!

We got started on extending JVM and Java version support by eliminating compilation issues for Java 7 on both Oracle JVM and OpenJDK – a good first step. We still have some way to go, notably rigorous testing as part of our continuous integration pipeline, and community feedback – this is where you come in. We have had some confusion over this, so we have now inserted checks and warnings that state clearly: we currently only support JDK 6.

For our enterprise customers we have added a new consistency checker that both runs faster and catches more problems, to ensure your backups are always in a good state. And we straightened out some behaviours in our HA protocol around cluster formation that were confusing.

Neo4j 1.8.1 (download)

Are Your Lights On?…

Filed under: Design,Programming — Patrick Durusau @ 5:29 pm

David Heinemeier Hansson describes: Are Your Lights On?: How to Figure Out What the Problem Really Is by Donald C. Gause and Gerald M. Weinberg as:

This isn’t technically a programming book, but it deals with the biggest problem facing developers none the less: What is the problem we’re trying to solve? Is it the right problem? Could we solve a different problem instead and that would be just as good? Nothing has increased my programming productivity more than being able to restate hard problems as simple ones.

in his post: The five programming books that meant most to me.

The other four merit your attention but if you are solving the wrong problem, the results won’t be viewed as great programming.

At least not by your clients.

6 Must-See Usability Testing Videos

Filed under: Interface Research/Design,Usability,Users — Patrick Durusau @ 4:49 pm

6 Must-See Usability Testing Videos by Paul Veugen.

From the post:

Usability testing. Some people love it, some hate it, many don’t get it. Personally, I think they are the best thing anyone can do to learn from their users. In the same time, they are emotionally exhausting for moderators.

Here are 6 usability testing videos I love. Four serious ones, two not so much.

Just the titles:

  1. An intro to usability testing by Amberlight Partners
  2. Jenn Downs on guerrilla usability testing at Mailchimp as well as a participant’s perspective
  3. Usability testing with a young child using a paper prototype
  4. Steve Krug’s usability testing demo
  5. Usability testing of fruit by blinkux
  6. Behind the one-way mirror: what if you have had such a participant?

Interesting range of usability testing examples.

None are beyond the capabilities of the average web author.

Titan-Android

Filed under: Graphs,Gremlin,Networks,TinkerPop,Titan — Patrick Durusau @ 3:34 pm

Titan-Android by David Wu.

From the webpage:

Titan-Android is a port/fork of Titan for the Android platform. It is meant to be a light-weight implementation of a graph database on mobile devices. The port removes HBase and Cassandra support as their usage make little sense on a mobile device (convince me otherwise!). Gremlin is only supported via the Java interface as I have not been able to port groovy successfully. Nevertheless, Titan-Android supports local storage backend via BerkeleyDB and supports the Tinkerpop stack natively.

Just in case there was an Android under the tree!

I first saw this in a tweet by Marko A. Rodriguez.

Semantic Assistants Wiki-NLP Integration

Filed under: Natural Language Processing,Semantics,Wiki — Patrick Durusau @ 3:27 pm

Natural Language Processing for MediaWiki: First major release of the Semantic Assistants Wiki-NLP Integration

From the post:

We are happy to announce the first major release of our Semantic Assistants Wiki-NLP integration. This is the first comprehensive open source solution for bringing Natural Language Processing (NLP) to wiki users, in particular for wikis based on the well-known MediaWiki engine and its Semantic MediaWiki (SMW) extension. It can run any NLP pipeline deployed in the General Architecture for Text Engineering (GATE), brokered as web services through the Semantic Assistants server. This allows you to bring novel text mining assistants to wiki users, e.g., for automatically structuring wiki pages, answering questions in natural language, quality assurance, entity detection, summarization, among others. The results of the NLP analysis are written back to the wiki, allowing humans and AI to work collaboratively on wiki content. Additionally, semantic markup understood by the SMW extension can be automatically generated from NLP output, providing semantic search and query functionalities.

Features:

  • Light-weight MediaWiki Extension
  • NLP Pipeline Independent Architecture
  • Flexible Wiki Input Handling
  • Flexible NLP Result Handling
  • Semantic Markup Generation
  • Wiki-independent Architecture

A promising direction for creation of author-curated text!

New EU Data Portal [Transparency/Innovation?]

Filed under: Data,Data Source,EU,Transparency — Patrick Durusau @ 2:30 pm

EU Commission unwraps public beta of open data portal with 5800+ datasets, ahead of Jan 2013 launch by Robin Wauters.

The EU Data Portal.

From the post:

Good news for open data lovers in the European Union and beyond: the European Commission on Christmas Eve quietly pushed live the public beta version of its all-new open data portal.

For the record: open data is general information that can be freely used, re-used and redistributed by anyone. In this case, it concerns all the information that public bodies in the European Union produce, collect or pay for (it’s similar to the United States government’s Data.gov).

This could include geographical data, statistics, meteorological data, data from publicly funded research projects, and digitised books from libraries.

The post always quotes the portal website as saying:

This portal is about transparency, open government and innovation. The European Commission Data Portal provides access to open public data from the European Commission. It also provides access to data of other Union institutions, bodies, offices and agencies at their request.

The published data can be downloaded by everyone interested to facilitate reuse, linking and the creation of innovative services. Moreover, this Data Portal promotes and builds literacy around Europe’s data.

Eurostat is the largest data contributor so signs of “transparency” should be there, if anywhere.

The first twenty (20) data sets from Eurostat are:

  • Quarterly cross-trade road freight transport by type of transport (1 000 t, Mio Tkm)
  • Turnover by residence of client and by employment size class for div 72 and 74
  • Generation of waste by sector
  • Standardised incidence rate of accidents at work by economic activity, severity and age
  • At-risk-of-poverty rate of older people, by age and sex (Source: SILC)
  • Telecommunication services: Access to networks (1 000)
  • Production of environmentally harmful chemicals, by environmental impact class
  • Fertility indicators
  • Area under wine-grape vine varieties broken down by vine variety, age of the vines and NUTS 2 regions – Romania
  • Severe material deprivation rate by most frequent activity status (population aged 18 and over)
  • Government bond yields, 10 years’ maturity – monthly data
  • Material deprivation for the ‘Economic strain’ and ‘Durables’ dimensions, by number of item (Source: SILC)
  • Participation in non-formal taught activities within (or not) paid hours by sex and working status
  • Number of persons by working status within households and household composition (1 000)
  • Percentage of all enterprises providing CVT courses, by type of course and size class
  • EU Imports from developing countries by income group
  • Extra-EU imports of feedingstuffs: main EU partners
  • Production and international trade of foodstuffs: Fresh fish and fish products
  • General information about the enterprises
  • Agricultural holders

When I think of government “transparency,” I think of:

  • Who is making the decisions?
  • What are their relationships to the people asking for the decisions? School, party, family, social, etc.
  • What benefits are derived from the decisions?
  • Who benefits from those decisions?
  • What are the relationships between those who benefit and those who decide?
  • Remembering it isn’t the “EU” that makes a decision for good or ill for you.

    Some named individual or group of named individuals, with input from other named individuals, with who they had prior relationships, made those decisions.

    Transparency in government would name the names and relationships of those individuals.

    BTW, I would be very interested to learn what sort of “innovation” you can derive from any of the first twenty (20) data sets listed above.

    The holidays may have exhausted my imagination because I am coming up empty.

    Educated Guesses Decorated With Numbers

    Filed under: Data,Data Analysis,Open Data — Patrick Durusau @ 1:48 pm

    Researchers Say Much to Be Learned from Chicago’s Open Data by Sam Cholke.

    From the post:

    HYDE PARK — Chicago is a vain metropolis, publishing every minute detail about the movement of its buses and every little skirmish in its neighborhoods. A team of researchers at the University of Chicago is taking that flood of data and using it to understand and improve the city.

    “Right now we have more data than we’re able to make use of — that’s one of our motivations,” said Charlie Catlett, director of the new Urban Center for Computation and Data at the University of Chicago.

    Over the past two years the city has unleashed a torrent of data about bus schedules, neighborhood crimes, 311 calls and other information. Residents have put it to use, but Catlett wants his team of computational experts to get a crack at it.

    “Most of what is happening with public data now is interesting, but it’s people building apps to visualize the data,” said Catlett, a computer scientist at the university and Argonne National Laboratory.

    Catlett and a collection of doctors, urban planners and social scientists want to analyze that data so to solve urban planning puzzles in some of Chicago’s most distressed neighborhoods and eliminate the old method of trial and error.

    “Right now we look around and look for examples where something has worked or appeared to work,” said Keith Besserud, an architect at Skidmore, Owings and Merrill's Blackbox Studio and part of the new center. “We live in a city, so we think we understand it, but it’s really not seeing the forest for the trees, we really don’t understand it.”

    Besserud said urban planners have theories but lack evidence to know for sure when greater density could improve a neighborhood, how increased access to public transportation could reduce unemployment and other fundamental questions.

    “We’re going to try to break down some of the really tough problems we’ve never been able to solve,” Besserud said. “The issue in general is the field of urban design has been inadequately served by computational tools.”

    In the past, policy makers would make educated guesses. Catlett hopes the work of the center will better predict such needs using computer models, and the data is only now available to answer some fundamental questions about cities.

    …(emphasis added)

    Some city services may be improved by increased data, such as staging ambulances near high density shooting locations based upon past experience.

    That isn’t the same as “planning” to reduce the incidence of unemployment or crime by urban planning.

    If you doubt that statement, consider the vast sums of economic data available for the past century.

    Despite that array of data, there are no universally acclaimed “truths” or “policies” for economic planning.

    The temptation to say “more data,” “better data,” “better integration of data,” etc. will solve problem X is ever present.

    Avoid disappointing your topic map customers.

    Make sure a problem is one data can help solve before treating it like one.

    I first saw this in a tweet by Tim O’Reilly.

    sigma.js

    Filed under: Graphs,Networks,Sigma.js,Visualization — Patrick Durusau @ 11:46 am

    sigma.js – Web network visualization made easy by Alexis Jacomy.

    From the webpage:

    sigma.js is an open-source lightweight JavaScript library to draw graphs, using the HTML canvas element. It has been especially designed to:

    • Display interactively static graphs exported from a graph visualization software – like Gephi
    • Display dynamically graphs that are generated on the fly

    From October of 2012:

    osdc2012-sigmajs-demo – French OSDC 2012 (demo)

    osdc2012-sigmajs-presentation – French OSDC 2012 (Landslide presentation)

    See also: Using Sigma.js with Neo4j.

    A tweet from Andreas Müller reminded me to create a separate post on sigma.js.

    December 25, 2012

    A Paywall In Your Future? [Curated Data As Revenue Stream]

    Filed under: News,Publishing — Patrick Durusau @ 8:23 pm

    The New York Times Paywall Is Working Better Than Anyone Had Guessed by Edmund Lee.

    From the post:

    Ever since the New York Times rolled out its so-called paywall in March 2011, a perennial dispute has waged. Anxious publishers say they can’t afford to give away their content for free, while the blogger set claim paywalls tend to turn off readers accustomed to a free and open Web.

    More than a year and a half later, it’s clear the New York Times’ paywall is not only valuable, it’s helped turn the paper’s subscription dollars, which once might have been considered the equivalent of a generous tithing, into a significant revenue-generating business. As of this year, the company is expected to make more money from subscriptions than from advertising — the first time that’s happened.

    Digital subscriptions will generate $91 million this year, according to Douglas Arthur, an analyst with Evercore Partners. The paywall, by his estimate, will account for 12 percent of total subscription sales, which will top $768.3 million this year. That’s $52.8 million more than advertising. Those figures are for the Times newspaper and the International Herald Tribune, largely considered the European edition of the Times.

    It’s a milestone that upends the traditional 80-20 ratio between ads and circulation that publishers once considered a healthy mix and that is now no longer tenable given the industrywide decline in newsprint advertising. Annual ad dollars at the Times, for example, has fallen for five straight years.

    More importantly, subscription sales are rising faster than ad dollars are falling. During the 12 months after the paywall was implemented, the Times and the International Herald Tribune increased circulation dollars 7.1 percent compared with the previous 12-month period, while advertising fell 3.7 percent. Subscription sales more than compensated for the ad losses, surpassing them by $19.2 million in the first year they started charging readers online.

    I don’t think gate-keeper and camera-ready copy publishers should take much comfort from this report.

    Unlike those outlets, the New York Times has a “value-add” with regard to the news it reports.

    Much like UI/UX design, the open question is: What do users see as a value-add? (Hopefully a significant number of users.)

    A life or death question for a new content stream, fighting for attention.

    Textbook for data visualization?

    Filed under: Graphics,Visualization — Patrick Durusau @ 5:55 pm

    Textbook for data visualization? by Andrew Gelman.

    Andrew posts a request for a data visualization textbook.

    The comments have some familiar titles but others are not.

    Are your favorites present or missing?

    If missing, please post a comment with your suggestion.

    Thanks!

    Quandl [> 2 million financial/economic datasets]

    Filed under: Data,Dataset,Time Series — Patrick Durusau @ 4:19 pm

    Quandl (alpha)

    From the homepage:

    Quandl is a collaboratively curated portal to over 2 million financial and economic time-series datasets from over 250 sources. Our long-term mission is to make all numerical data on the internet easy to find and easy to use.

    Interesting enough but the detail from the “about” page are even more so:

    Our Vision

    The internet offers a rich collection of high quality numerical data on thousands of subjects. But the potential of this data is not being reached at all because the data is very difficult to actually find. Furthermore, it is also difficult to extract, validate, format, merge, and share.

    We have a solution: We’re building an intelligent search engine for numerical data. We’ve developed technology that lets people quickly and easily add data to Quandl’s index. Once this happens, the data instantly becomes easy to find and easy to use because it gains 8 essential attributes:

    Findability Quandl is essentially a search engine for numerical data. Every search result on Quandl is an actual data set that you can use right now. Once data from anywhere on the internet becomes known to Quandl, it becomes findable by search and (soon) by browse.
    Structure Quandl is a universal translator for data formats. It accepts numerical data no matter what format it happens to be published in and then delivers it in any format you request it. When you find a dataset on Quandl, you’ll be able to export anywhere you want, in any format you want.
    Validity Every dataset on Quandl has a simple link back to the same data on the publisher’s web site which gives you 100% certainty on validity.
    Fusibility Any data set on Quandl is totally compatible with any and all other data on Quandl. You can merge multiple datasets on Quandl quickly and easily (coming soon).
    Permanence Once a dataset is on Quandl, it stays there forever. It is always up-to-date and available at a permanent, unchanging URL.
    Connectivity Every dataset on Quandl is accessible by a simple API. Whether or not the original publisher offered an API no longer matters because Quandl always does. Quandl is the universal API for numerical data on the internet.
    Recency Every single dataset on Quandl is guaranteed to be the most recent version of that data, retrieved afresh directly from the original publisher.
    Utility Data on Quandl is organized and presented for maximum utility: Actual data is examinable immediately; the data is graphed (properly); description, attribution, units, and export tools are clear and concise.

    I have my doubts about the “fusibility” claims. You can check the US Leading Indicators data list and note that “level” and “units” use different units of measurement. Other semantic issues lurk just beneath the surface.

    Still, the name of the engine does not begin with “B” or “G” and illustrates there is enormous potential for curated data collections.

    Come to think of it, topic maps are curated data collections.

    Are you in need of a data curator?

    I first saw this in a tweet by Gregory Piatetsky.

    Static and Dynamic Semantics of NoSQL Languages […Combining Operators…]

    Filed under: NoSQL,Query Language,Semantics — Patrick Durusau @ 3:59 pm

    Static and Dynamic Semantics of NoSQL Languages (PDF) by Véronique Benzaken, Giuseppe Castagna, Kim Nguy˜ên and Jérôme Siméon.

    Abstract:

    We present a calculus for processing semistructured data that spans differences of application area among several novel query languages, broadly categorized as “NoSQL”. This calculus lets users define their own operators, capturing a wider range of data processing capabilities, whilst providing a typing precision so far typical only of primitive hard-coded operators. The type inference algorithm is based on semantic type checking, resulting in type information that is both precise, and flexible enough to handle structured and semistructured data. We illustrate the use of this calculus by encoding a large fragment of Jaql, including operations and iterators over JSON, embedded SQL expressions, and co-grouping, and show how the encoding directly yields a typing discipline for Jaql as it is, namely without the addition of any type definition or type annotation in the code.

    From the conclusion:

    On the structural side, the claim is that combining recursive records and pairs by unions, intersections, and negations suffices to capture all possible structuring of data, covering a palette ranging from comprehensions, to heterogeneous lists mixing typed and untyped data, through regular expressions types and XML schemas. Therefore, our calculus not only provides a simple way to give a formal semantics to, reciprocally compare, and combine operators of different NoSQL languages, but also offers a means to equip these languages, in they current definition (ie, without any type definition or annotation), with precise type inference.

    With lots of work in between the abstract and conclusion.

    The capacity to combine operators of different NoSQL languages sounds relevant to a topic maps query language.

    Yes?

    I first saw this in a tweet by Computer Science.

    Open Source CRM [Lack of TMs – The New Acquisition “Poison Pill”?]

    Filed under: CRM,Integration,Topic Maps — Patrick Durusau @ 3:25 pm

    Zurmo sets out to enchant the open source CRM space

    From the post:

    Being “fed up with the existing open source CRM applications”, the team at Zurmo have released their own open source customer relationship management (CRM) software – Zurmo 1.0. The CRM software, which has been in development for two years, includes deal tracking features, contact and activity management, and has scores and badges that can be managed through a built-in gamification system.

    Zurmo 1.0 has been translated into ten languages and features a RESTful API to further integration with other applications. Location data is provided by Google Maps and Geocode. The application’s permission system supports roles for individual users and groups, and allows administrators to create ad-hoc teams. The application is designed to be modern and easy to use and integrates social-network-like functionality at its centre, which functions to distribute tasks, solicit advice, and publish accomplishments.

    Describing what led the company to create another CRM system, Zurmo Co-Founder Ray Stoeckicht said: “We believe in CRM, but users continue to perceive it as a clunky, burdensome tool that wastes their time and only provides value to management. This space needs a major disruption and user adoption needs to be the focus.” He goes on to describe the application as “enchanting” and says that a major focus in the development of Zurmo 1.0 was the gamification aspects, which are designed to get the users to follow CRM best practices and to make correct use of the system more enjoyable. One example of gamification is “Missions“, where an employee can challenge another in exchange for a reward.

    If two or more CRM systems are integrated with other applications, separately, what do you think happens if those CRM systems attempt to merge? (Without topic map capabilities.)

    Not that the merging need be automatic, but if the semantics of the “other” applications and its data are defined by a topic map, doesn’t that ease future merging of CRM systems?

    Assuming that every possessor of a CRM system is eyeing other possessor of CRM systems as possible acquisitions. 😉

    Will the lack of data systems capable of rapid and reliable integration become the new “poison pill” for 2013?

    Will the lack of data systems capable of rapid and reliable integration be a mark against management of a purchaser?

    Either? Both?

    December 24, 2012

    Microsoft Open Technologies releases Windows Azure support for Solr 4.0

    Filed under: Azure Marketplace,Microsoft,Solr — Patrick Durusau @ 4:08 pm

    Microsoft Open Technologies releases Windows Azure support for Solr 4.0 by Brian Benz.

    From the post:

    Microsoft Open Technologies is pleased to share the latest update to the Windows Azure self-deployment option for Apache Solr 4.0.

    Solr 4.0 is the first release to use the shared 4.x branch for Lucene & Solr and includes support for SolrCloud functionality. SolrCloud allows you to scale a single index via replication over multiple Solr instances running multiple SolrCores for massive scaling and redundancy.

    To learn more about Solr 4.0, have a look at this 40 minute video covering Solr 4 Highlights, by Mark Miller of LucidWorks from Apache Lucene Eurocon 2011.

    To download and install Solr on Windows Azure visit our GitHub page to learn more and download the SDK.

    Another alternative for implementing the best of Lucene/Solr on Windows Azure is provided by our partner LucidWorks. LucidWorks Search on Windows Azure delivers a high-performance search solution that enables quick and easy provisioning of Lucene/Solr search functionality without any need to install, manage or operate Lucene/Solr servers, and it supports pre-built connectors for various types of enterprise data, structured data, unstructured data and web sites.

    Beyond the positive impact for Solr and Azure in general, this means your Solr skills will be useful in new places.

    Political Data Yearbook interactive

    Filed under: Government,Government Data — Patrick Durusau @ 3:39 pm

    Political Data Yearbook interactive

    From the webpage:

    Political Data Yearbook captures election results, national referenda, changes in government, and institutional reforms for a range of countries, within and beyond the EU.

    Particularly useful if your world consists of the EU + Australia, Canada, Iceland, Israel, Norway, Switzerland and the USA. 😉

    To put that into perspective, only the third ranking country in terms of population, the USA, gets listed.

    Omitted are (in population order): China, India, Indonesia, Brazil, Pakistan, Bangladesh, Nigeria, Russia and Japan. Or about 60% of the world’s population.

    Africa, South America, the Middle East (except for Israel), Mexico and Latin America are omitted as well.

    Suggestions of resources to suggest on rapidly expanding markets?

    24 Christmas Gifts from is.R

    Filed under: Data Analysis,R — Patrick Durusau @ 2:56 pm

    24 Christmas Gifts from is.R by David Smith.

    From the post:

    The is.R blog has been on a roll in December with their Advent CalendaR feature: daily tips about R to unwrap each day leading up to Christmas. If you haven't been following it, start with today's post and scroll down. Sadly there isn't a tag to collect all these great posts together, but here are a few highlights:

    A new to me blog, is.R, a great idea to copy for Christmas next year (posts on the Advent calendar), and high quality posts to enjoy!

    Now that really is a bundle of Christmas joy!

    Coursera’s Data Analysis with R course starts Jan 22

    Filed under: CS Lectures,Data Analysis,R — Patrick Durusau @ 2:48 pm

    Coursera’s Data Analysis with R course starts Jan 22 by David Smith.

    From the post:

    Following on from Coursera’s popular course introducing the R language, a new course on data analysis with R starts on January 22. The simply-titled Data Analysis course will provide practically-oriented instruction on how to plan, carry out, and communicate analyses of real data sets with R.

    See also: Computing for Data Analysis course, which starts January 2nd.

    Being sober by January 2nd is going to be a challenge but worth the effort. 😉

    Geospatial Intelligence Forum

    Filed under: Integration,Intelligence,Interoperability — Patrick Durusau @ 2:32 pm

    Geospatial Intelligence Forum: The Magazine of the National Intelligence Community

    Apologies but I could not afford a magazine subscription for every reader of this blog.

    The next best thing is a free magazine that may be useful in your data integration/topic map practice.

    Defense intelligence has been a hot topic for the last decade and there are no signs that is going to change any time soon.

    I was browsing through Geospatial Intelligence Forum (GIF) when I encountered:

    Closing the Interoperability Gap by Cheryl Gerber.

    From the article:

    The current technology gaps can be frustrating for soldiers to grapple with, particularly in the middle of battlefield engagements. “This is due, in part, to stovepiped databases forcing soldiers who are working in tactical operations centers to perform many work-arounds or data translations to present the best common operating picture to the commander,” said Dr. Joseph Fontanella, AGC director and Army geospatial information officer.

    Now there is a use case for interoperability, being “…in the middle of battlefield engagements.”

    Cheryl goes on to identify five (5) gaps in interoperability.

    GIF looks like a good place to pick up riffs, memes, terminology and even possible contacts.

    Enjoy!

    10 Rules for Persistent URIs [Actually only one] Present of Persistent URIs

    Filed under: Linked Data,Semantic Web,WWW — Patrick Durusau @ 2:11 pm

    Interoperability Solutions for European Public Administrations got into the egg nog early:

    D7.1.3 – Study on persistent URIs, with identification of best practices and recommendations on the topic for the MSs and the EC (PDF) (I’m not kidding, go see for yourself.)

    Five (5) positive rules:

    1. Follow the pattern: http://(domain)/(type)/(concept)/(reference)
    2. Re-use existing identifiers
    3. Link multiple representations
    4. Implement 303 redirects for real-world objects
    5. Use a dedicated servive

    Five (5) negative rules:

    1. Avoid stating ownership
    2. Avoid version numbers
    3. Avoid using auto-increment
    4. Avoid query strings
    5. Avoid file extensions

    If the goal is “persistent” URIs, only the “Use a dedicated server” has any relationship to making a URIs “persistent.”

    That is that five (5) or ten (10) years from now, a URI used as an identifier will return the same value as today.

    The other nine rules have no relationship to persistence. Good arguments can be made for some of them, but persistence isn’t one of them.

    Why the report hides behind the rhetoric of persistence I cannot say.

    But you can satisfy yourself that only a “dedicated server” can persist a URI, whatever its form.

    W3C confusion over identifiers and locators for web resources continues to plague this area.

    There isn’t anything particularly remarkable about using a URI as an identifier. So long as it is understood that URI identifiers are just like any other identifier.

    That is they can be indexed, annotated, searched for and returned to users with data about the object of the identification.

    Viewed that way, that once upon a time there was a resource with the location specified by a URI, has little or nothing to do with the persistent of that URI.

    So long as we have indexed the URI, that index can serve as a resolution of that URI/identifier for as long as the index persists. With additional information should we choose to create and provide it.

    The EU document concedes as much when it says:

    Without exception, all the use cases discussed in section 3 where a policy of URI persistence has been adopted, have used a dedicated service that is independent of the data originator. The Australian National Data Service uses a handle resolver, Dublin Core uses purl.org, services, data.gov.uk and publications.europa.eu are all also independent of a specific government department and could readily be transferred and run by someone else if necessary. This does not imply that a single service should be adopted for multiple data providers. On the contrary – distribution is a key advantage of the Web. It simply means that the provision of persistent URIs should be independent of the data originator.

    That is if you read: “…independent of the data originator” to mean independent of a particular location on the WWW.

    No changes in form, content, protocols, server software, etc., required. And you get persistent URIs.

    Merry Christmas to all and to all…, persistent URIs as identifiers (not locators)!

    (I first saw this at: New Report: 10 Rules for Persistent URIs)

    December 23, 2012

    OpenGamma updates its open source financial analytics platform [TM Opportunity in 2013]

    Filed under: Analytics,Finance Services,Topic Maps — Patrick Durusau @ 8:26 pm

    OpenGamma updates its open source financial analytics platform

    From the post:

    OpenGamma has released version 1.2 of its open source financial analytic and risk management platform. Released as Apache 2.0 licensed open source in April, the Java-based platform offers an architecture for delivering real-time available trading and risk analytics for front-office-traders, quants, and risk managers.
    Version 1.2 includes a newly rebuilt beta of a new web GUI offering multi-pane analytics views with drag and drop panels, independent pop-out panels, multi-curve and surface viewers, and intelligent tab handling. Copy and paste is now more extensive and is capable of handing complex structures.
    Underneath, the Analytics Library has been expanded to include support for Credit Default Swaps, Extended Futures, Commodity Futures and Options databases, and equity volatility surfaces. Data Management has improved robustness with schema checking on production systems and an auto-upgrade tool being added to handle restructuring of the futures/forwards database. The market and reference data’s live system now uses OpenGamma’s own component system. The Excel Integration module has also been enhanced and thanks to a backport now works with Excel 2003. A video shows the Excel module in action:

    Integration with OpenGamma billed by OpenGamma as:

    While true green-field development does exist in financial services, it’s exceptionally rare. Firms already have a variety of trade processing, analytics, and risk systems in place. They may not support your current requirements, or may be lacking in capabilities/flexibility; but no firm can or should simply throw them all away and start from scratch.

    We think risk technology architecture should be designed to use and complement systems already supporting traders and risk managers. Whether proprietary or vendor solutions, considerable investments have been made in terms of time and money. Discarding them and starting from scratch risks losing valuable data and insight, and adds to the cost of rebuilding.

    That being said, a primary goal of any project rethinking analytics or risk computation needs to be the elimination of all the problems siloed, legacy systems have: duplication of technology, lack of transparency, reconciliation difficulties, inefficient IT resourcing, etc.

    The OpenGamma Platform was built from scratch specifically to integrate with any legacy data source, analytics library, trading system, or market data feed. Once that integration is done against our rich set of APIs and network endpoints, you can make use of it across any project based on the OpenGamma Platform.

    A very valuable approach to integration, being able to access legacy or even current data sources.

    But that leaves the undocumented semantics of data from those feeds on the cutting room floor.

    The unspoken semantics of data from integrated feeds is like dry rot just waiting to make its presence known.

    Suddenly and at the worst possible moment.

    Compare that to documented data identity and semantics, which enables reliable re-use/merging of data from multiple sources.


    So we are clear, I am not suggesting a topic maps platform with financial analytics capabilities.

    I am suggesting incorporation of topic map capabilities into existing applications, such as OpenGamma.

    That would take data integration to a whole new level.

    OrientDB 1.3 with new SQL functions and better performance

    Filed under: Graphs,OrientDB — Patrick Durusau @ 11:39 am

    OrientDB 1.3 with new SQL functions and better performance

    From the post:

    NuvolaBase is glad to announce this new release 1.3 and the new Web Site of OrientDB:  http://www.orientdb.org!

    What’s new with 1.3?

    • SQL: new eval() function to execute expressions
    • SQL: new if() and ifnull() functions
    • SQL: supported server-side configuration for functions
    • SQL: new DELETE VERTEX and DELETE EDGE commands
    • SQL: execution of database functions from SQL commands
    • SQL: new create cluster command
    • Graph: bundled 2 algorithms: Dijkstra and ShortestPath between vertices
    • Performance: improved opening time when a connections is reused from pool
    • Performance: better management of indexes in ORDER BY
    • Schema: new API to handle custom fields
    • HTTP/REST: new support for fetch-plan and limit in “command”
    • Moved from Google Code to GitHub: orientdb
    • Many bugs fixed

    Now that’s good tidings for Christmas!

    Standard Upper Merged Ontology (SUMO), One of the “Less Fortunate” at Christmas Time.

    Filed under: Ontology,SUMO — Patrick Durusau @ 11:15 am

    At this happy time of the year you should give some thought to the “less fortunate,” such as the Standard Upper Merged Ontology (SUMO).

    Elementary school physics teaches four (4) states of matter: solid, liquid, gas, plasma, which SUMO enshrines as:

    (subclass PhysicalState InternalAttribute)
    (contraryAttribute Solid Liquid Gas Plasma)
    (exhaustiveAttribute PhysicalState Solid Fluid Liquid Gas Plasma)
    (documentation PhysicalState EnglishLanguage "The physical state of an &%Object. There
    are three reified instances of this &%Class: &%Solid, &%Liquid, and &%Gas.
    Physical changes are not characterized by the transformation of one
    substance into another, but rather by the change of the form (physical
    states) of a given substance. For example, melting an iron nail yields a
    substance still called iron.")
    ...

    Best thing is just to say it, there are over 500 phases of matter. A new method for classifying the states of matter offers insight into the design of superconductors and quantum computers.

    SUMO is still “valid” in the sense Newtonian physics are still “valid,” provided your instruments or requirements are crude enough.

    Use of these new states in research and engineering are underway, making indexing and retrieval active concerns.

    Should we could ask researchers to withhold publications until SUMO and other ontology based systems have time to catch up?

    Other alternatives?


    I first saw this in: The 500 Phases of Matter: New System Successfully Classifies Symmetry-Protected Phases (Science Daily).

    See also:

    X. Chen, Z.-C. Gu, Z.-X. Liu, X.-G. Wen. Symmetry-Protected Topological Orders in Interacting Bosonic Systems. Science, 2012; 338 (6114): 1604 DOI: 10.1126/science.1227224

    December 22, 2012

    The Untapped Big Data Gap (2012) [Merry Christmas Topic Maps!]

    Filed under: BigData,Marketing,Topic Maps — Patrick Durusau @ 3:04 pm

    The latest Digital Universe Study by International Data Corporation (IDC), sponsored by EMC has good tidings for topic maps:

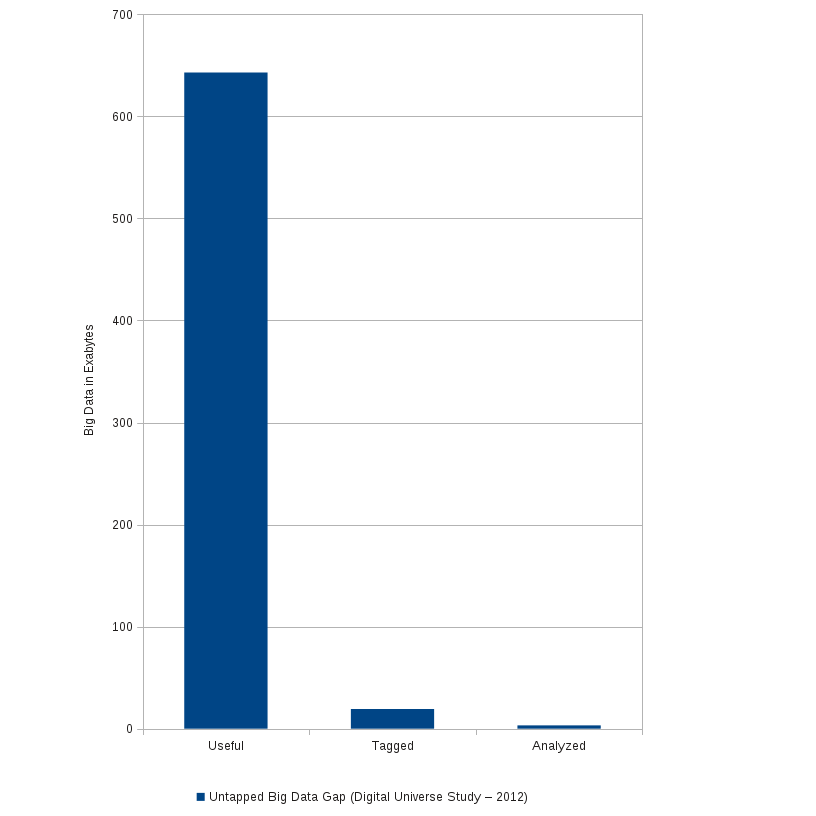
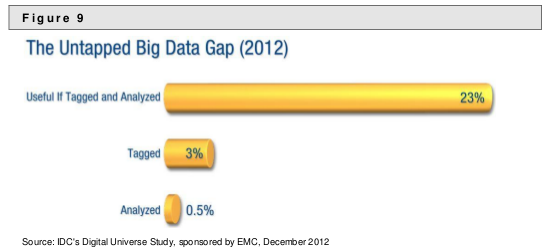
    All in all, in 2012, we believe 23% of the information in the digital universe (or 643 exabytes) would be useful for Big Data if it were tagged and analyzed. However, technology is far from where it needs to be, and in practice, we think only 3% of the potentially useful data is tagged, and even less is analyzed.

    Call this the Big Data gap — information that is untapped, ready for enterprising digital explorers to extract the hidden value in the data. The bad news: This will take hard work and significant investment. The good news: As the digital universe expands, so does the amount of useful data within it.

    But their “good news” is blunted by a poor graphic:

    Digital Universe Study - Untapped Big Data Chart

    A graphic poor enough to mislead John Burn-Murdock to mis-report in Study: less than 1% of the world’s data is analysed, over 80% is unprotected (Guardian):

    The global data supply reached 2.8 zettabytes (ZB) in 2012 – or 2.8 trillion GB – but just 0.5% of this is used for analysis, according to the Digital Universe Study.

    and,

    Just 3% of all data is currently tagged and ready for manipulation, and only one sixth of this – 0.5% – is used for analysis. The gulf between availability and exploitation represents a significant opportunity for businesses worldwide, with global revenues surrounding the collection, storage, and analysis of big data set to reach $16.9bn in 2015 – a fivefold increase since 2010.

    The 3% and 0.5% figures apply to the amount of “potentially useful data, as is made clear by the opening prose quote in this post.

    A clearer chart on that point:

    Durusau's Re-renering of the Untapped Big Data chart

    Or if you want the approximate numbers: 643 exabytes of “potentially useful data,” of which 3%, or 19.29 exabytes is tagged, and 0.5%, or 3.21 exabytes has been analyzed.

    Given the varying semantics of the tagged data, to say nothing of the more than 624 Exabytes of untagged data, there major opportunities for topic maps in 2013!

    Merry Christmas Topic Maps!

    December 21, 2012

    The Twitter of Babel: Mapping World Languages through Microblogging Platforms

    Filed under: Diversity,Semantic Diversity,Semantics — Patrick Durusau @ 5:38 pm

    The Twitter of Babel: Mapping World Languages through Microblogging Platforms by Delia Mocanu, Andrea Baronchelli, Bruno Gonçalves, Nicola Perra, Alessandro Vespignani.

    Abstract:

    Large scale analysis and statistics of socio-technical systems that just a few short years ago would have required the use of consistent economic and human resources can nowadays be conveniently performed by mining the enormous amount of digital data produced by human activities. Although a characterization of several aspects of our societies is emerging from the data revolution, a number of questions concerning the reliability and the biases inherent to the big data “proxies” of social life are still open. Here, we survey worldwide linguistic indicators and trends through the analysis of a large-scale dataset of microblogging posts. We show that available data allow for the study of language geography at scales ranging from country-level aggregation to specific city neighborhoods. The high resolution and coverage of the data allows us to investigate different indicators such as the linguistic homogeneity of different countries, the touristic seasonal patterns within countries and the geographical distribution of different languages in multilingual regions. This work highlights the potential of geolocalized studies of open data sources to improve current analysis and develop indicators for major social phenomena in specific communities.

    So, rather on the surface homogeneous languages, users can use their own natural, heterogeneous languages, which we can analyze as such?

    Cool!

    Semantic and linguistic heterogeneity has persisted from the original Tower of Babel until now.

    The smart money will be riding on managing semantic and linguistic heterogeneity.

    Other money can fund emptying the semantic ocean with a tea cup.

    « Newer PostsOlder Posts »

    Powered by WordPress