Another Word For It Patrick Durusau on Topic Maps and Semantic Diversity

June 23, 2012

Elements of Software Construction [MIT 6.005]

Filed under: Software,Subject Identity,Topic Maps — Patrick Durusau @ 6:59 pm

Elements of Software Construction

Description:

This course introduces fundamental principles and techniques of software development. Students learn how to write software that is safe from bugs, easy to understand, and ready for change.

Topics include specifications and invariants; testing, test-case generation, and coverage; state machines; abstract data types and representation independence; design patterns for object-oriented programming; concurrent programming, including message passing and shared concurrency, and defending against races and deadlock; and functional programming with immutable data and higher-order functions.

From the MIT OpenCourseware site.

Of interest to anyone writing topic map software.

It should also be of interest to anyone evaluating how software shapes what subjects we can talk about and how we can talk about them. Data structures have the same implications.

Not necessary to undertake such investigations in all cases. There are many routine uses for common topic map software.

Being able to see when the edges of a domain don’t quite fit or there may be gaps in coverage for an information system, are necessary skills for non-routine cases.

Big Data in Genomics and Cancer Treatment

Filed under: BigData,Genome,Hadoop,MapReduce — Patrick Durusau @ 6:48 pm

Big Data in Genomics and Cancer Treatment by Tanya Maslyanko.

From the post:

Why genomics?

Big data. These are two words the world has been hearing a lot lately and it has been in relevance to a wide array of use cases in social media, government regulation, auto insurance, retail targeting, etc. The list goes on. However, a very important concept that should receive the same (if not more) recognition is the presence of big data in human genome research.

Three billion base pairs make up the DNA present in humans. It’s probably safe to say that such a massive amount of data should be organized in a useful way, especially if it presents the possibility of eliminating cancer. Cancer treatment has been around since its first documented case in Egypt (1500 BC) when humans began distinguishing between malignant and benign tumors by learning how to surgically remove them. It is intriguing and scientifically helpful to take a look at how far the world’s knowledge of cancer has progressed since that time and what kind of role big data (and its management and analysis) plays in the search for a cure.

The most concerning issue with cancer, and the ultimate reason for why it still hasn’t been completely cured, is that it mutates differently for every individual and reacts in unexpected ways with people’s genetic make up. Professionals and researchers in the field of oncology have to assert the fact that each patient requires personalized treatment and medication in order to manage the specific type of cancer that they have. Elaine Mardis, PhD, co-director of the Genome Institute at the School of Medicine, believes that it is essential to identify mutations at the root of each tumor and to map their genetic evolution in order to make progress in the battle against cancer. “Genome analysis can play a role at multiple time points during a patient’s treatment, to identify ‘driver’ mutations in the tumor genome and to determine whether cells carrying those mutations have been eliminated by treatment.”

A not terribly technical but useful summary and pointers to the use of Hadoop in connection with genomics and cancer research/treatment. It may help give some substance to the buzz words “big data.”

Korematsu Maps

Filed under: Intelligence,Security — Patrick Durusau @ 6:37 pm

Just in case you need Korematsu maps of the United States, that is where immigrant populations are located, take a look at: Maps of the Foreign Born in the US.

For those of you unfamiliar with the Korematsu case, it involved the mass detention of people of Japanese ancestry during WW II. With no showing that any of the detainees were dangerous, disloyal, etc.

The thinking at the time and when the Supreme Court heard the case after the end of WW II, was that the fears of the many, out weighed the rights of the few.

You may be called upon to create maps to assist in mass detentions by race, ethnic or religious backgrounds. Just wanted you to know what to call them.

The Central Intelligence Agency’s 9/11 File

Filed under: Intelligence,Security — Patrick Durusau @ 6:24 pm

The Central Intelligence Agency’s 9/11 File

From the post:

The National Security Archive today is posting over 100 recently released CIA documents relating to September 11, Osama bin Laden, and U.S. counterterrorism operations. The newly-declassified records, which the Archive obtained under the Freedom of Information Act, are referred to in footnotes to the 9/11 Commission Report and present an unprecedented public resource for information about September 11.

The collection includes rarely released CIA emails, raw intelligence cables, analytical summaries, high-level briefing materials, and comprehensive counterterrorism reports that are usually withheld from the public because of their sensitivity. Today’s posting covers a variety of topics of major public interest, including background to al-Qaeda’s planning for the attacks; the origins of the Predator program now in heavy use over Afghanistan, Pakistan and Iran; al-Qaeda’s relationship with Pakistan; CIA attempts to warn about the impending threat; and the impact of budget constraints on the U.S. government’s hunt for bin Laden.

Today’s posting is the result of a series of FOIA requests by National Security Archive staff based on a painstaking review of references in the 9/11 Commission Report.

Possibly interesting material for topic map practice.

What has been redacted from the CIA documents? Based upon your mapping of other documents available on 9/11?

For extra points, include a summary of “why” you think the material was redacted?

Won’t be able to verify or check your answers but will be good practice at putting information in context to discover what may be missing.

NICT Daedalus: 3D Real-Time Cyber-Attack Alert Visualization

Filed under: Graphics,Security,Visualization — Patrick Durusau @ 6:10 pm

NICT Daedalus: 3D Real-Time Cyber-Attack Alert Visualization

From Information Aesthetics, a really nice 3-D graphic:

3D real-time graphics, rapidly moving particles and dangerous cyber attacks: it is all there.

The visualization system is called the “NICT Daedalus Cyber-attack alert system”, where Daedalus stands for “Direct Alert Environment for Darknet and Livenet Unified Security.” The system is specifically developed to observe large groups of computers for any suspicious activity, as it visualizes any suspected activity as it moves through the network.

Points to: diginfo.tv, for a video of system.

Impressive demo in real time!

But the demo does not include the integration of information from other information and/or security systems.

Such as physical security systems indicating the presence/absence of particular users, where particular users enter secure facilities, etc.

Network based cyber-attacks are an important security vector but other, less sophisticated avenues for attack, can be ignored only at your peril.

Hudson 3.0.0 Milestone 3 Available [continuous integration]

Filed under: Continuous Integration,Hudson — Patrick Durusau @ 4:26 pm

Hudson 3.0.0 Milestone 3 Available

From the webpage:

The fourth milestone (alpha) release of Hudson from Eclipse is now available for download and evaluation from the Eclipse Download page. This version has stabilized the final library set to be used by Hudson Core at Eclipse and introduces a new initial setup feature which is used to help the administrator correctly configure the instance. You can read more here. Note that this milestone version is intended for evaluation only and should not be used in production.

And:

Hudson is a continuous integration (CI) tool written in Java, which runs in a servlet container, such as Apache Tomcat or the GlassFish application server. It supports SCM tools including CVS, Subversion, Git and Clearcase and can execute Apache Ant and Apache Maven based projects, as well as arbitrary shell scripts and Windows batch commands.

Although any topic map software project would benefit from Hudson as a software build tool, “continuous integration” struck me as a useful notion for the substance of topic maps as well.

Including but not necessarily involving changes in how merging would occur in some cases. For example, if additional information were added to a topic map that would change the warnings given to patients about medications, the medications may already have been dispensed.

The map isn’t “wrong,” presently, but actions need to be triggered because of prior actions registered in the topic map. Not for all prior actions but just those within a particular time window.

Assuming you have treated dispensing events for medication as topics, the addition of associations with warnings could automatically trigger relevant warnings to other patients.

Sounds like “continuous integration” may have use beyond software projects!

Fastcase Introduces e-Books, Beginning with Advance Sheets

Filed under: Law,Law - Sources,Legal Informatics — Patrick Durusau @ 4:07 pm

Fastcase Introduces e-Books, Beginning with Advance Sheets

From the post:

According to the Fastcase blog post, Fastcase advance sheets will be available “for each state, federal circuit, and U.S. Supreme Court”; will be free of charge and “licensed under [a] Creative Commons BY-SA license“; and will include summaries. Each e-Book Advance Sheet will contain “one month’s judicial opinions (designated as published and unpublished) for specific states or courts.”

According to Sean Doherty’s post, future Fastcase e-Books will include “e-book case reporters with official pagination and links” into the Fastcase database, as well as “topical reporters” on U.S. law, covering fields such as securities law and antitrust law.

According to the Fastcase blog post, Fastcase’s approach to e-Books is inspired in part by CALI‘s Free Law Reporter, which makes case law available as e-Books in EPUB format.

For details, see the links in the post at Legal Informatics.

I mention it because not only could you have “topical reporters” but information products that are tied to even narrower areas of case law.

Such as litigation that a firm has pending or very narrow areas of liability (for example) of interest to a particular client. Granting there are “case watch” resources in every trade zine, but hardly detailed enough to do more than “excite the base” as they say.

With curated content from a topic map application, rather than “exciting the base,” you could be sharpening the legal resources you can whistle up on behalf of your client. Increasing their appreciate and continued interest in representation by you.

DEX 4.6 Released!

Filed under: DEX,Graphs — Patrick Durusau @ 3:57 pm

DEX 4.6 Released!

Features:

DEX 4.6 makes DEX aCiD.

  • Durability: Changes will persist thanks to the complete Recovery Manager. The recovery manager keeps your DEX databases automatically backedup all the time, and provides recovery tools in case you may need to delete unfinished Tx.
  • Consistency: After each Tx the GBD is consistent, guaranteed with the operations order.
  • Atomicity: Better autocommitted transactions (not rollback yet).
  • Isolation: Simple isolated Tx with S/X blocking.

(From the release page.)

Useful links:

Downloads

Documentation, including a new “Getting Started.”

Using TEXT attribute (NEW 4.6 interface!) – Java

I appreciated the “Getting Started” document offering the example application in Java, C# and C++.

On the other hand, it is a bit “lite” in terms of examples.

So I looked at the Technical Documentation because it was described as:

Complete technical documentation of the API, with examples of use, in pdf and html formats.

So, searching on the term “example” (in the pdf JavaDoc documentation for DEX 4.6) I find:

  • com.sparsity.dex.gdb.Condition – regex examples
  • com.sparsity.dex.gdb.Objects – “example”
  • com.sparsity.dex.gdb.Session – “example” While I am here, correction: “Objects or Values instances or even session attributes are an example of temporary data.” -> Objects, values instances, and session attributes are examples of temporary data.
  • com.sparsity.dex.io.CSVReader – “example”
  • com.sparsity.dex.script.ScriptParser – one line examples from pp. 268-270

Having said all that, the documentation isn’t a reason to avoid DEX.

I am going to throw a copy on my Ubuntu box before the end of the month.

June 22, 2012

Hacking and Trailblazing

Filed under: Mapping,Maps,Security — Patrick Durusau @ 4:22 pm

Ajay Ohri has written two “introduction” posts on hacking:

How to learn to be a hacker easily

How to learn Hacking Part 2

I thought “hacker/hacking” would be popular search terms.

“Hot” search terms this week: “Lebron James” 500,000+ searches (US), “Kate Upton” 50,000+ searches (US). (Shows what I know about “hot” search terms.)

What Ajay has created, as we all have at one time or another, is a collection of resources on a particular subject.

If you think of the infoverse as being an navigable body of information, Ajay has blazed a trail to particular locations that have information on a specific subject. More importantly, we can all follow that trail, which saves us time and effort.

Like a research/survey article in a technical journal, Ajay’s trail blazing suffers from two critical and related shortcomings:

First, we as human readers are the only ones who can take advantage of the branches and pointers in his trail. For example, when Ajay says:

The website 4chan is considered a meeting place to meet other hackers. The site can be visually shocking http://boards.4chan.org/b/
(http://www.decisionstats.com/how-to-learn-to-be-a-hacker-easily/)

Written as a prose narrative, it isn’t possible to discover 4chan and other hacker “meeting” sites. Not difficult for us, but then each one of us has to read the entire article for that pointer. I suppose this must be what Lars Marius means by “unstructured.” I stand corrected. (“visually shocking?” Only if you are really sensitive. Soft porn, profanity, juvenile humor.)

Second, where Ajay says:

Lena’s Reverse Engineering Tutorial-”Use Google.com for finding the Tutorial” (http://www.decisionstats.com/how-to-learn-hacking-part-2/)

I can’t add an extension, Reverse Engineering, a five-day course on reverse engineering.

Or, a warning that http://www.megaupload.com/?d=BDNJK4J8, displays:

seizure banner

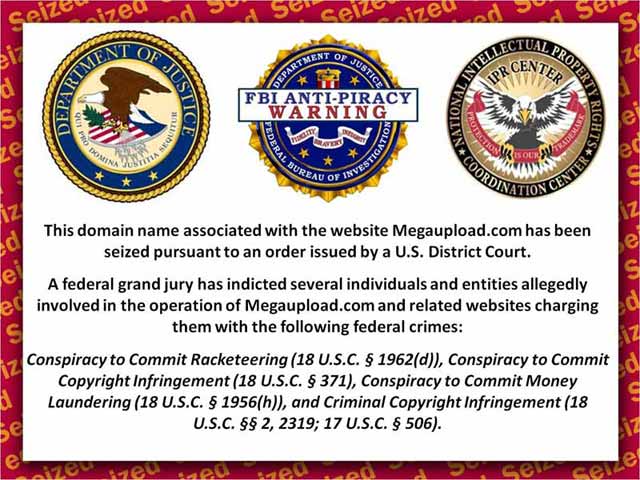
Ajay’s trail stops where Ajay stopped.

I can write a separate document as a trail, but have no way to tie that trail to Ajay’s.

At least today, I would ask the design questions as:

  1. How do we blaze trails subject to machine-assisted navigation?
  2. How do we enable machine-assisted navigation across trails?

There are unspoken assumptions and questions in both of those formulations but it is the best I can do today.

Suggestions/comments?


PS: Someone may be watching the link that leads to the Megaupload warning. Just so you know.

PPS: Topic maps need a jingoistic logo for promotion.

Like a barracuda, wearing only a black beret, proxy drawing from the TMRM as a tatoo, a hint that its “target” is just in front of it.

Top: Topic Maps. Reading under the barracuda: “If you can map it, you can hit it….”

Virtual Documents: “Search the Impossible Search”

Filed under: Indexing,Search Data,Search Engines,Virtual Documents — Patrick Durusau @ 4:17 pm

Virtual Documents: “Search the Impossible Search”

From the post:

The solution was to build an indexing pipeline specifically to address this user requirement, by creating “virtual documents” about each member of staff. In this case, we used the Aspire content processing framework as it provided a lot more flexibility than the indexing pipeline of the incumbent search engine, and many of the components that were needed already existed in Aspire’s component library.

[graphic omitted]

Merging was done selectively. For example, documents were identified that had been authored by the staff member concerned and from those documents, certain entities were extracted including customer names, dates and specific industry jargon. The information captured was kept in fields, and so could be searched in isolation if necessary.

The result was a new class of documents, which existed only in the search engine index, containing extended information about each member of staff; from basic data such as their billing rate, location, current availability and professional qualifications, through to a range of important concepts and keywords which described their previous work, and customer and industry sector knowledge.

Another tool to put in your belt but I wonder if there is a deeper lesson to be learned here?

Creating a “virtual” document, unlike anyone that existed in the target collection and indexing those “virtual” documents was a clever solution.

But it retains the notion of a “container” or “document” that is examined in isolation from all other “documents.”

Is that necessary? What are we missing if we retain it?

I don’t have any answers to those questions but will be thinking about them.

Comments/suggestions?

Wanted: Your Help in Testing Neo4j JDBC Driver

Filed under: JDBC,Neo4j — Patrick Durusau @ 4:00 pm

Wanted: Your Help in Testing Neo4j JDBC Driver

The Neo4j team requests your assistance in testing the Neo4j JDBC driver.

Or at least you will find that if you jump down to: Next stop: Public Testing in that post. (Single topic posts would make pointing to such calls easier.)

A good opportunity to do some testing (over the weekend) and contribute to the project.

Instructions are given.

Business Intelligence and Reporting Tools (BIRT)

Filed under: BIRT,Business Intelligence,Reporting — Patrick Durusau @ 3:50 pm

Business Intelligence and Reporting Tools (BIRT)

From the homepage:

BIRT is an open source Eclipse-based reporting system that integrates with your Java/Java EE application to produce compelling reports.

Being reminded by the introduction that reports can consist of lists, charts, crosstabs, letters & documents, compound reports, I was encouraged to see:

BIRT reports consist of four main parts: data, data transforms, business logic and presentation.

  • Data – Databases, web services, Java objects all can supply data to your BIRT report. BIRT provides JDBC, XML, Web Services, and Flat File support, as well as support for using code to get at other sources of data. BIRT’s use of the Open Data Access (ODA) framework allows anyone to build new UI and runtime support for any kind of tabular data. Further, a single report can include data from any number of data sources. BIRT also supplies a feature that allows disparate data sources to be combined using inner and outer joins.
  • Data Transforms – Reports present data sorted, summarized, filtered and grouped to fit the user’s needs. While databases can do some of this work, BIRT must do it for “simple” data sources such as flat files or Java objects. BIRT allows sophisticated operations such as grouping on sums, percentages of overall totals and more.
  • Business Logic – Real-world data is seldom structured exactly as you’d like for a report. Many reports require business-specific logic to convert raw data into information useful for the user. If the logic is just for the report, you can script it using BIRT’s JavaScript support. If your application already contains the logic, you can call into your existing Java code.
  • Presentation – Once the data is ready, you have a wide range of options for presenting it to the user. Tables, charts, text and more. A single data set can appear in multiple ways, and a single report can present data from multiple data sets.

I was clued into BIRT by Actuate, so you might want to pay them a visit as well.

Anytime you are manipulating data, for analysis or reporting, you are working with subjects.

Topic maps are a natural for planning or documenting your transformations or reports.

Or let me put it this way: Do you really want to hunt down what you think you did six months ago for the last report? And then spend a day or two in frantic activity correcting what you mis-remember? There are other options. Your choice.

Sage Bionetworks and Amazon SWF

Sage Bionetworks and Amazon SWF

From the post:

Over the past couple of decades the medical research community has witnessed a huge increase in the creation of genetic and other bio molecular data on human patients. However, their ability to meaningfully interpret this information and translate it into advances in patient care has been much more modest. The difficulty of accessing, understanding, and reusing data, analysis methods, or disease models across multiple labs with complimentary expertise is a major barrier to the effective interpretation of genomic data. Sage Bionetworks is a non-profit biomedical research organization that seeks to revolutionize the way researchers work together by catalyzing a shift to an open, transparent research environment. Such a shift would benefit future patients by accelerating development of disease treatments, and society as a whole by reducing costs and efficacy of health care.

To drive collaboration among researchers, Sage Bionetworks built an on-line environment, called Synapse. Synapse hosts clinical-genomic datasets and provides researchers with a platform for collaborative analyses. Just like GitHub and Source Forge provide tools and shared code for software engineers, Synapse provides a shared compute space and suite of analysis tools for researchers. Synapse leverages a variety of AWS products to handle basic infrastructure tasks, which has freed the Sage Bionetworks development team to focus on the most scientifically-relevant and unique aspects of their application.

Amazon Simple Workflow Service (Amazon SWF) is a key technology leveraged in Synapse. Synapse relies on Amazon SWF to orchestrate complex, heterogeneous scientific workflows. Michael Kellen, Director of Technology for Sage Bionetworks states, “SWF allowed us to quickly decompose analysis pipelines in an orderly way by separating state transition logic from the actual activities in each step of the pipeline. This allowed software engineers to work on the state transition logic and our scientists to implement the activities, all at the same time. Moreover by using Amazon SWF, Synapse is able to use a heterogeneity of computing resources including our servers hosted in-house, shared infrastructure hosted at our partners’ sites, and public resources, such as Amazon’s Elastic Compute Cloud (Amazon EC2). This gives us immense flexibility is where we run computational jobs which enables Synapse to leverage the right combination of infrastructure for every project.”

The Sage Bionetworks case study (above) and another one, NASA JPL and Amazon SWF, will get you excited about reaching out to the documentation on Amazon Simple Workflow Service (Amazon SWF).

In ways that presentations that consist of reading slides about management advantages to Amazon SWF simply can’t reach. At least not for me.

Take the tip and follow the case studies, then onto the documentation.

Full disclosure: I have always been fascinated by space and really hard bioinformatics problems. And have < 0 interest in DRM antics on material if piped to /dev/null would raise a user's IQ.

Uncovering disassortativity in large scale-free networks

Filed under: Disassortativity,Networks,Scale-Free — Patrick Durusau @ 3:09 pm

Uncovering disassortativity in large scale-free networks by Nelly Litvak and Remco van der Hofstad.

Abstract:

Mixing patterns in large self-organizing networks, such as the Internet, the World Wide Web, social and biological networks are often characterized by degree-degree {dependencies} between neighbouring nodes. In this paper we propose a new way of measuring degree-degree {dependencies}. We show that the commonly used assortativity coefficient significantly underestimates the magnitude of {dependencies}, especially in large disassortative networks. We mathematically explain this phenomenon and validate the results on synthetic graphs and real-world network data. As an alternative, we suggest to use rank correlation measures such as the well-known Spearman’s rho. Our experiments convincingly show that Spearman’s rho produces consistent values in graphs of different sizes but similar structure, and it is able to reveal strong (positive or negative) {dependencies} in large graphs. In particular, using the Spearman’s rho we show that preferential attachment model exhibits significant negative degree-degree {dependencies}. We also discover much stronger negative {degree-degree dependencies} in Web graphs than was previously thought. We conclude that rank correlations provide a suitable and informative method for uncovering network mixing patterns.

If you are using graphs/networks and your analysis relies on dependencies between nodes, this could be of interest.

Graphs that involve large numbers of nodes in terrorism analysis, for example.

Being mindful that one person’s “terrorist” is another person’s defender of the homeland.

Research Data Australia down to Earth

Filed under: Geographic Data,Geographic Information Retrieval,Mapping,Maps — Patrick Durusau @ 2:47 pm

Research Data Australia down to Earth

From the post:

Context: free cloud servers, a workshop and an idea

In this post I look at some work we’ve been doing at the University of Western Sydney eResearch group on visualizing metadata about research data, in a geographical context. The goal is to build a data discovery service; one interface we’re exploring is the ability to ‘fly’ around Google Earth looking for data, from Research Data Australia (RDA). For example, a researcher could follow a major river and see what data collections there are along its course that might be of (re-)use. True, you can search the RDA site by dragging a marker on a map but this experiment is a more immersive approach to exploring the same data.

The post is a quick update on a work in progress, with some not very original reflections on the use of cloud servers. I am putting it here on my own blog first, will do a human-readable summary over at UWS soon, any suggestions or questions welcome.

You can try this out if you have Google Earth by downloading a KML file. This is a demo service only – let us know how you go.

This work was inspired by a workshop on cloud computing: this week Andrew (Alf) Leahy and I attended a NeCTAR and Australian National Data Service (ANDS) one day event, along with several UWS staff. The unstoppable David Flanders from ANDS asked us to run a ‘dojo’, giving technically proficient researchers and eResearch collaborators a hand-on experience with the NeCTAR research cloud, where all Australian University researchers with access to the Australian Access Federation login system are entitled to run free cloud-hosted virtual servers. Free servers! Not to mention post-workshop beer[i]. So senseis Alf and and PT worked with a small group of ‘black belts’ in a workshop loosely focused on geo-spatial data. Our idea was “Visualizing the distribution of data collections in Research Data Australia using Google Earth”[ii]. We’d been working on a demo of how this might be done for a few days, which we more-or less got running on the train from the Blue Mountains in to Sydney Uni in the morning.

When you read about “exploring” the data, bear in mind the question of how to record that “exploration?” Explorers used to keep journals, ships logs, etc. to record their explorations.

How do you record (if you do), your explorations of data? How do you share them if you do?

Given the ease of recording our explorations, no more long hand with a quill pen, is it odd that we don’t record our intellectual explorations?

Or do we want others to see a result that makes us look more clever than we are?

Merging Data Presents Practical Challenges

Filed under: BigData,Merging — Patrick Durusau @ 2:40 pm

Merging Data Presents Practical Challenges

From the post:

Merging structured and unstructured data remains a great challenge for many enterprise users and enterprise search capabilities are lagging behind the trend to collect as much data as possible–with the intent of eventually finding the infrastructure to address it.

The independent, non-profit research group, the Association for Information and Image Management, (AIIM) with backing from sponsor Actuate (BIRT BI vendor) hit on some of this challenges with the release of a new survey-based report.

Blah, blah, blah.

Which brings to the reason you should read and encourage others to read this blog:

http://www.xenos.com/xe/info/aiim-big-data-report – Link to where you can register and get a copy of the report.

I hunted through various press releases, etc. and included a link to the source of the materials quoted.

Some commercial sites apparently either don’t want you to see the source materials or don’t know how to author hyperlinks. Hard to say for sure.

I want you to:

  1. Know where material came from, and
  2. Have the opportunity (whether you take it or no is your issue) to agree/disagree with my comments on material. Can’t do that or at least not easily if you have to hunt it down.

Once found by any of us, information should remain found for all of us. (I rather like that, may have to make further use of it.)

From Classical to Quantum Shannon Theory

Filed under: Communication,Information Theory,Shannon — Patrick Durusau @ 2:38 pm

From Classical to Quantum Shannon Theory by Mark M. Wilde

Abstract:

The aim of this book is to develop “from the ground up” many of the major, exciting, pre- and post-millenium developments in the general area of study known as quantum Shannon theory. As such, we spend a significant amount of time on quantum mechanics for quantum information theory (Part II), we give a careful study of the important unit protocols of teleportation, super-dense coding, and entanglement distribution (Part III), and we develop many of the tools necessary for understanding information transmission or compression (Part IV). Parts V and VI are the culmination of this book, where all of the tools developed come into play for understanding many of the important results in quantum Shannon theory.

From Chapter 1:

You may be wondering, what is quantum Shannon theory and why do we name this area of study as such? In short, quantum Shannon theory is the study of the ultimate capability of noisy physical systems, governed by the laws of quantum mechanics, to preserve information and correlations. Quantum information theorists have chosen the name quantum Shannon theory to honor Claude Shannon, who single-handedly founded the fi eld of classical information theory, with a groundbreaking 1948 paper [222]. In particular, the name refers to the asymptotic theory of quantum information, which is the main topic of study in this book. Information theorists since Shannon have dubbed him the “Einstein of the information age.”1 The name quantum Shannon theory is fit to capture this area of study because we use quantum versions of Shannon’s ideas to prove some of the main theorems in quantum Shannon theory.

This is of immediate importance if you are interested in current research in information theory. Of near-term importance if you are interested in practical design of algorithms for quantum information systems.

BADREX: In situ expansion and coreference of biomedical abbreviations using dynamic regular expressions

Filed under: Biomedical,Regexes — Patrick Durusau @ 2:16 pm

BADREX: In situ expansion and coreference of biomedical abbreviations using dynamic regular expressions by Phil Gooch.

Abstract:

BADREX uses dynamically generated regular expressions to annotate term definition-term abbreviation pairs, and corefers unpaired acronyms and abbreviations back to their initial definition in the text. Against the Medstract corpus BADREX achieves precision and recall of 98% and 97%, and against a much larger corpus, 90% and 85%, respectively. BADREX yields improved performance over previous approaches, requires no training data and allows runtime customisation of its input parameters. BADREX is freely available from https://github.com/philgooch/BADREX-Biomedical-Abbreviation-Expander as a plugin for the General Architecture for Text Engineering (GATE) framework and is licensed under the GPLv3.

From the conclusion:

The use of regular expressions dynamically generated from document content yields modestly improved performance over previous approaches to identifying term definition–term abbreviation pairs, with the benefit of providing in-place annotation, expansion and coreference in a single pass. BADREX requires no training data and allows runtime customisation of its input parameters.

Although not mentioned by the author, a reader can agree/disagree with an expansion as they are reading the text. Could provide for faster feedback/correction of the expansion.

Assuming you accept a correct/incorrect view of expansions. I prefer agree/disagree as the more general rule. Correct/incorrect is the result of the application of a specified rule.

June 21, 2012

Basic Time Series with Cassandra

Filed under: Cassandra,Time,Time Series — Patrick Durusau @ 4:24 pm

Basic Time Series with Cassandra

From the post:

One of the most common use cases for Cassandra is tracking time-series data. Server log files, usage, sensor data, SIP packets, stuff that changes over time. For the most part this is a straight forward process but given that Cassandra has real-world limitations on how much data can or should be in a row, there are a few details to consider.

As it says in the title, “basic” time series, the post concludes with:

Indexing and Aggregation

Indexing and aggregation of time-series data is a more complicated topic as they are highly application dependent. Various new and upcoming features of Cassandra also change the best practices for how things like aggregation are done so I won’t go into that. For more details, hit #cassandra on irc.freenode and ask around. There is usually somebody there to help.

But why would you collect time-series data if you weren’t going to index and/or aggregate it?

Anyone care to suggest “best practices?”

Mapping and Monitoring Cyber Threats

Filed under: Malware,Mapping,Security — Patrick Durusau @ 4:05 pm

Mapping and Monitoring Cyber Threats

From the post:

Threats to information security are part of everyday life for government agencies and companies both big and small. Monitoring network activity, setting up firewalls, and establishing various forms of authentication are irreplaceable components of IT security infrastructure, yet strategic defensive work increasingly requires the added context of real world events. The web and its multitude of channels covering emerging threat vectors and hacker news can help provide warning signs of potentially disruptive information security events.

However, the challenge that analysts typically face is an overwhelming volume of intelligence that requires brute force aggregation, organization, and assessment. What if significant portions of the first two tasks could be accomplished more efficiently allowing for greater resources allocated to the all important third step of analysis?

We’ll outline how Recorded Future can help security teams harness the open source intelligence available on various threat vectors and attacks, activity of known cyber organizations during particular periods of time, and explicit warnings as well as implicit risks for the future.

Interesting but I would add to the “threat” map known instances where recordable media can be used, email or web traffic traceable to hacker lists/websites, offices or departments with prior security issues and the like.

Security can become too narrowly focused on technological issues, ignoring that a large number of security breaches are the result of human lapses or social engineering. A bit broader mapping of security concerns can help keep the relative importance of threats in perspective.

Hortonworks Data Platform v1.0 Download Now Available

Filed under: Hadoop,HBase,HDFS,Hive,MapReduce,Oozie,Pig,Sqoop,Zookeeper — Patrick Durusau @ 3:36 pm

Hortonworks Data Platform v1.0 Download Now Available

From the post:

If you haven’t yet noticed, we have made Hortonworks Data Platform v1.0 available for download from our website. Previously, Hortonworks Data Platform was only available for evaluation for members of the Technology Preview Program or via our Virtual Sandbox (hosted on Amazon Web Services). Moving forward and effective immediately, Hortonworks Data Platform is available to the general public.

Hortonworks Data Platform is a 100% open source data management platform, built on Apache Hadoop. As we have stated on many occasions, we are absolutely committed to the Apache Hadoop community and the Apache development process. As such, all code developed by Hortonworks has been contributed back to the respective Apache projects.

Version 1.0 of Hortonworks Data Platform includes Apache Hadoop-1.0.3, the latest stable line of Hadoop as defined by the Apache Hadoop community. In addition to the core Hadoop components (including MapReduce and HDFS), we have included the latest stable releases of essential projects including HBase 0.92.1, Hive 0.9.0, Pig 0.9.2, Sqoop 1.4.1, Oozie 3.1.3 and Zookeeper 3.3.4. All of the components have been tested and certified to work together. We have also added tools that simplify the installation and configuration steps in order to improve the experience of getting started with Apache Hadoop.

I’m a member of the general public! And you probably are too! 😉

See the rest of the post for more goodies that are included with this release.

SchemafreeDB

Filed under: Database,Web Applications — Patrick Durusau @ 3:24 pm

SchemafreeDB (the FAQ)

From the blog page:

A Database for Web Applications

It’s been about 2 weeks since we announced the preview of SchemafreeDB. The feedback was loud and clear, we need to work on the site design. We listened and now have what we think is a big improvement in design and message.

What’s The Message

In redesigning the site we thought more about what we wanted to say and how we should better convey that message. We realized we were focusing primarily on features. Features make a product but they do not tell the product’s story. The main character in the SchemafreeDB story is web development. We are web developers and we created SchemafreeDB out of necessity and desire. With that in mind we have created a more “web application” centric message. Below is our new messaging in various forms.

The FAQ says that SchemafreeDB is different from every other type of DB and better/faster, etc.

I would appreciate insight you may have into statements like:

What is “join-free SQL” and why is this a good thing?

With SchemafreeDB, you can query deeply across complex structures via a simple join-free SQL syntax. e.g: WHERE $s:person.address.city=’Rochester’ AND $n:person.income>50000

This simplicity gives you new efficiencies when working with complex queries, thus increasing your overall productivity as a developer.

The example isn’t a complex query nor do I know anyone who would think so.

Are any of you using this service?

Graph DB + Bioinformatics: Bio4j,…

Filed under: Amazon Web Services AWS,Bioinformatics,Neo4j — Patrick Durusau @ 3:04 pm

Graph DB + Bioinformatics: Bio4j, recent applications and future directions by Pablo Pareja.

If you haven’t seen one of Pablo’s slide decks on Bio4j, get ready for a real treat!

Let me quote the numbers from slide 42, which is entitled: “Bio4j + MG7 + 24 Chip-Seq samples”

157 639 502 nodes

742 615 705 relationships

632 832 045 properties

149 relationship types

44 node types

And it works just fine!

Granting he is not running this on his cellphone but if you are going to process serious data, you need serious computing power. (OK, he uses Amazon Web Services. Like I said, not his cellphone.)

Did I mention everything done by Oh no sequences! (www.ohnosequences.com) is 100% Open source?

There is much to learn here. Enjoy!

Knowledge Discovery Using Cloud and Distributed Computing Platforms (KDCloud, 2012)

Filed under: Cloud Computing,Conferences,Distributed Systems,Knowledge Discovery — Patrick Durusau @ 2:49 pm

Knowledge Discovery Using Cloud and Distributed Computing Platforms (KDCloud, 2012)

From the website:

Paper Submission August 10, 2012

Acceptance Notice October 01, 2012

Camera-Read Copy October 15, 2012

Workshop December 10, 2012 Brussels, Belgium

Collocated with the IEEE International Conference on Data Mining, ICDM 2012

From the website:

The 3rd International Workshop on Knowledge Discovery Using Cloud and Distributed Computing Platforms (KDCloud, 2012) provides an international platform to share and discuss recent research results in adopting cloud and distributed computing resources for data mining and knowledge discovery tasks.

Synopsis: Processing large datasets using dedicated supercomputers alone is not an economical solution. Recent trends show that distributed computing is becoming a more practical and economical solution for many organizations. Cloud computing, which is a large-scale distributed computing, has attracted significant attention of both industry and academia in recent years. Cloud computing is fast becoming a cheaper alternative to costly centralized systems. Many recent studies have shown the utility of cloud computing in data mining, machine learning and knowledge discovery. This workshop intends to bring together researchers, developers, and practitioners from academia, government, and industry to discuss new and emerging trends in cloud computing technologies, programming models, and software services and outline the data mining and knowledge discovery approaches that can efficiently exploit this modern computing infrastructures. This workshop also seeks to identify the greatest challenges in embracing cloud computing infrastructure for scaling algorithms to petabyte sized datasets. Thus, we invite all researchers, developers, and users to participate in this event and share, contribute, and discuss the emerging challenges in developing data mining and knowledge discovery solutions and frameworks around cloud and distributed computing platforms.

Topics: The major topics of interest to the workshop include but are not limited to:

  • Programing models and tools needed for data mining, machine learning, and knowledge discovery
  • Scalability and complexity issues
  • Security and privacy issues relevant to KD community
  • Best use cases: are there a class of algorithms that best suit to cloud and distributed computing platforms
  • Performance studies comparing clouds, grids, and clusters
  • Performance studies comparing various distributed file systems for data intensive applications
  • Customizations and extensions of existing software infrastructures such as Hadoop for streaming, spatial, and spatiotemporal data mining
  • Applications: Earth science, climate, energy, business, text, web and performance logs, medical, biology, image and video.

It’s December, Belgium and an interesting workshop. Can’t ask for much more than that!

Tilera’s TILE-Gx Processor Family and the Open Source Community [topic maps lab resource?]

Filed under: Multi-Core,Researchers,Scientific Computing,Topic Maps — Patrick Durusau @ 2:15 pm

Tilera’s TILE-Gx Processor Family and the Open Source Community Deliver the World’s Highest Performance per Watt to Networking, Multimedia, and the Cloud

It’s summer and on hot afternoons it’s easy to look at all the cool stuff at online trade zines. Like really high-end processors that we could stuff in our boxes, to run, well, really complicated stuff to be sure. 😉

On one hand we should be mindful that our toys have far more processing power than mainframes of not too long ago. So we need to step up our skill at using the excess capacity on our desktops.

On the other hand, it would be nice to have access to cutting edge processors that will be common place in another cycle or two, today!

From the post:

Tilera® Corporation, the leader in 64-bit manycore general purpose processors, announced the general availability of its Multicore Development Environment™ (MDE) 4.0 release on the TILE-Gx processor family. The release integrates a complete Linux distribution including the kernel 2.6.38, glibc 2.12, GNU tool chain, more than 3000 CentOS 6.2 packages, and the industry’s most advanced manycore tools developed by Tilera in collaboration with the open source community. This release brings standards, familiarity, ease of use, quality and all the development benefits of the Linux environment and open source tools onto the TILE-Gx processor family; both the world’s highest performance and highest performance per watt manycore processor in the market. Tilera’s MDE 4.0 is available now.

“High quality software and standard programming are essential elements for the application development process. Developers don’t have time to waste on buggy and hard to program software tools, they need an environment that works, is easy and feels natural to them,” said Devesh Garg, co-founder, president and chief executive officer, Tilera. “From 60 million packets per second to 40 channels of H.264 encoding on a Linux SMP system, this release further empowers developers with the benefits of manycore processors.”

Using the TILE-Gx processor family and the MDE 4.0 software release, customers have demonstrated high performance, low latency, and the highest performance per watt on many applications. These include Firewall, Intrusion Prevention, Routers, Application Delivery Controllers, Intrusion Detection, Network Monitoring, Network Packet Brokering, Application Switching for Software Defined Networking, Deep Packet Inspection, Web Caching, Storage, High Frequency Trading, Image Processing, and Video Transcoding.

The MDE provides a comprehensive runtime software stack, including Linux kernel 2.6.38, glibc 2.12, binutil, Boost, stdlib and other libraries. It also provides full support for Perl, Python, PHP, Erlang, and TBB; high-performance kernel and user space PCIe drivers; high performance low latency Ethernet drivers; and a hypervisor for hardware abstraction and virtualization. For development tools the MDE includes standard C/C++ GNU compiler v4.4 and 4.6; an Eclipse Integrated Development Environment (IDE); debugging tools such as gdb 7 and mudflap; profiling tools including gprof, oprofile, and perf_events; native and cross build environments; and graphical manycore application debugging and profiling tools.

Should a topic maps lab offer this sort of resource to a geographically distributed set of researchers? (Just curious. I don’t have funding but should the occasion arise.)

Even with the cloud, thinking topic map researchers need access to high-end architectures for experiments with data structures and processing techniques.

Working with Graph Data from Neo4j in QlikView

Filed under: Business Intelligence,Graphs,Neo4j — Patrick Durusau @ 1:48 pm

Working with Graph Data from Neo4j in QlikView

From the post:

There are numerous examples of problems which can be handled efficiently by graph databases. A graph is made up of nodes and relationships between nodes (or vertices and edges): http://en.wikipedia.org/wiki/Graph_database

Now we can use graph data in a business intelligence / business discovery solution like QlikView to do some more business related analytics.

Neo4j is a high-performance, NoSQL graph database with all the features of a mature and robust database. It is an open source project supported by Neo Technology, implemented in Java. You can read more about it here: http://neo4j.org

Here are some slides about graph problems and use cases for Neo4j: http://www.slideshare.net/peterneubauer/neo4j-5-cool-graph-examples-4473985

Since the Neo4j JDBC driver is available we can use the QlikView JDBC Connector from TIQ Solutions and Cypher – a declarative graph query language – for expressive and efficient querying of the graph data. Take a look into the Cypher documentation to understand the syntax of this human query language, because it is totally different from SQL: http://docs.neo4j.org/chunked/1.7/cypher-query-lang.html

A very interesting presentation and it only requires your time to see the potential for benefits (or not) from using Neo4j and QlikView. (Some people who try the software may not benefit at all. It is as important to identify them quickly as it is those who will greatly benefit from it.)

It fails to make the case for business analytics, mostly because it doesn’t frame a business analytics problem and then solving it. Sorting movies by the average age of actors could be an answer to a BI question but which one isn’t readily apparent.

BaseX 7.3 (The Summer Edition) is now available!

Filed under: BaseX,XML,XML Database,XML Schema,XPath,XQuery — Patrick Durusau @ 7:47 am

BaseX 7.3 (The Summer Edition) is now available!

From the post:

we are glad to announce a great new release of BaseX, our XML database and XPath/XQuery 3.0 processor! Here are the latest features:

  • Many new internal XQuery Modules have been added, and existing ones have been revised to ensure long-term stability of your future XQuery applications
  • A new powerful Command API is provided to specify BaseX commands and scripts as XML
  • The full-text fuzzy index was extended to also support wildcard queries
  • The simple map operator of XQuery 3.0 gives you a compact syntax to process items of sequences
  • BaseX as Web Application can now start its own server instance
  • All command-line options will now be executed in the given order
  • Charles Foster’s latest XQJ Driver supports XQuery 3.0 and the Update and Full Text extensions

For those of you in the Northern Hemisphere, we wish you a nice summer! No worries, we’ll stay busy..

Just in time for the start of summer in the Northern Hemisphere!

Something you can toss onto your laptop before you head to the beach.

Err, huh? Well, even if you don’t take BaseX 7.3 to the beach, it promises to be good fun for the summer and more serious work should the occasion arise.

I count twenty-three (23) modules in addition to the XQuery functions specified by the latest XPath/XQuery 3.0 draft.

Just so you know, the BaseX database server listens to port 1984 by default.

Lessons from Amazon RDS on Bringing Existing Apps to the Cloud

Filed under: Amazon Web Services AWS,Cloud Computing — Patrick Durusau @ 5:56 am

Lessons from Amazon RDS on Bringing Existing Apps to the Cloud by Nati Shalom.

From the post:

Its a common believe that Cloud is good for green field apps. There are many reasons for this, in particular the fact that the cloud forces a different kind of thinking on how to run apps. Native cloud apps were designed to scale elastically, they were designed with complete automation in mind, and so forth. Most of the existing apps (a.k.a brown field apps) were written in a pre-cloud world and therefore don’t support these attributes. Adding support for these attributes could carry a significant investment. In some cases, this investment could be so big that it would make more sense to go through a complete re-write.

In this post I want to challenge this common belief. Over the past few years I have found that many stateful applications running on the cloud don’t support all those attributes, elasticity in particular. One of the better-known examples of this is MySQL and its Amazon cloud offering, RDS, which I’ll use throughout this post to illustrate my point.

Amazon RDS as an example for migrating a brown-field applications

MySQL was written in a pre-cloud world and therefore fits into the definition of a brown-field app. As with many brown-field apps, it wasn’t designed to be elastic or to scale out, and yet it is one of the more common and popular services on the cloud. To me, this means that there are probably other attributes that matter even more when we consider our choice of application in the cloud. Amazon RDS is the cloud-enabled version of MySQL. It can serve as a good example to find what those other attributes could be.

You have to admit that the color imagery is telling. Pre-cloud applications are “brown-field” apps and cloud apps are “green.”

I think the survey numbers about migrating to the cloud are fairly soft and not always consistent. There will be “green” and “brown” field apps created or migrated to the cloud.

But brown field apps will remain just as relational databases did not displace all the non-relational databases, which persist to this day.

Technology is as often “in addition to” as it is “in place of.”

June 20, 2012

NoLogic (Not only Logic) – #5,000

Filed under: Logic,Marketing — Patrick Durusau @ 8:09 pm

I took the precaution to say “Not only Logic” so I would not have to reach back and invent a soothing explanation for saying “NoLogic.”

The marketing reasons for parroting “NoSQL” are obvious and I won’t belabor them here.

There are some less obvious reasons for saying “NoLogic.”

Logic, as in formal logic (description logic for example), is rarely used by human user. Examples mainly exist in textbooks and journal articles. And of late, in semantic web proposals.

Ask anyone in your office to report the number of times they used formal logic to make a decision in the last week. We both know the most likely answer, by a very large margin.

But we rely upon searches everyday that are based upon the use of digital logic.

Searches that are quite useful in assisting non-logical users but we limit ourselves in refining those search results. By more logic. Which we don’t use ourselves.

Isn’t that odd?

Or take the “curse of dimensionality.” Viewed from the perspective of data mining, Baeza-Yates & Ribeiro-Neto point out that “…a large feature space might render document classifiers impractical.” p.320

Those are features that can be identified with the document.

What of the dimensions of a user who is a former lawyer, theology student, markup editor, Ancient Near Easter amateur, etc., all of which have an impact on how they view any particular document and its relevance to a search result? Or to make connections to another document?

Some of those dimensions would be shared by other users, some would not.

But in either case, human users are untroubled by the “curse of dimensionality.” In part I would suggest because “NoLogic” comes easy for the human user. We may not be able to articulate all the dimensions, but we are likely to pick results similar users will find useful.

We should not forgo logic, either as digital logic or formal reasoning systems, when those assist us.

We should be mindful that logic does not represent all views of the world.

In other words, not only logic (NoLogic).

HBase Write Path

Filed under: Hadoop,HBase,HDFS — Patrick Durusau @ 4:41 pm

HBase Write Path by Jimmy Xiang.

From the post:

Apache HBase is the Hadoop database, and is based on the Hadoop Distributed File System (HDFS). HBase makes it possible to randomly access and update data stored in HDFS, but files in HDFS can only be appended to and are immutable after they are created. So you may ask, how does HBase provide low-latency reads and writes? In this blog post, we explain this by describing the write path of HBase — how data is updated in HBase.

The write path is how an HBase completes put or delete operations. This path begins at a client, moves to a region server, and ends when data eventually is written to an HBase data file called an HFile. Included in the design of the write path are features that HBase uses to prevent data loss in the event of a region server failure. Therefore understanding the write path can provide insight into HBase’s native data loss prevention mechanism.

Whether you intend to use Hadoop for topic map processing or not, this will be a good introduction to updating data in HBase. Not all applications using Hadoop are topic maps so this may serve you in other contexts as well.

« Newer PostsOlder Posts »

Powered by WordPress