Another Word For It Patrick Durusau on Topic Maps and Semantic Diversity

March 3, 2012

Skytree: Big Data Analytics

Skytree: Big Data Analytics

Released this last week, Skytree offers both local as well as cloud-based data analytics.

From the website:

Skytree Server can accurately perform machine learning on massive datasets at high speed.

In the same way a relational database system (or database accelerator) is designed to perform SQL queries efficiently, Skytree Server is designed to efficiently perform machine learning on massive datasets.

Skytree Server’s scalable architecture performs state-of-the-art machine learning methods on data sets that were previously too big for machine learning algorithms to process. Leveraging advanced algorithms implemented on specialized systems and dedicated data representations tuned to machine learning, Skytree Server delivers up to 10,000 times performance improvement over existing approaches.

Currently supported machine learning methods:

  • Neighbors (Nearest, Farthest, Range, k, Classification)
  • Kernel Density Estimation and Non-parametric Bayes Classifier
  • K-Means
  • Linear Regression
  • Support Vector Machines (SVM)
  • Fast Singular Value Decomposition (SVD)
  • The Two-point Correlation

There is a “free” local version with a data limit (100,000 records) and of course the commercial local and cloud versions.

Comments?

Tutorial: Data Discovery Portal

Filed under: Astroinformatics — Patrick Durusau @ 10:09 pm

Tutorial: Data Discovery Portal from the US Virtual Astronomical Observatory. Also available as a screencast: http://bit.ly/xwyyyb.

The Data Discovery Tool is only one among many that is accessible through the US Virtual Astronomical Observatory. More tools have been developed by observatories around the world.

The problem they faced years ago was that astronomical data was too voluminous to be easily transferred to users in bulk for local analysis. So, the entire community set about creating protocols for interfaces with that data, wherever it was stored. Which enables the analysis of that data remotely or downloading very small subsets of relevant data.

This does not diminish the importance of semantic mappings as nomenclature changes and as new theories spawn new terminologies. It does give a framework within which mappings would be useful.

I am sure there are other scientific data sharing initiatives that I have simply not encountered. Your pointers and suggestions about the same will be greatly appreciated!

nessDB v1.8 with LSM-Tree

Filed under: Memory,nessDB — Patrick Durusau @ 10:09 pm

nessDB v1.8 with LSM-Tree

From the webpage:

nessDB is a fast Key-Value database(embedded), supports Redis-Protocol(PING,SET,MSET,GET,MGET,DEL,EXISTS,INFO,SHUTDOWN).

Which is written in ANSI C with BSD LICENSE and works in most POSIX systems without external dependencies.

nessDB is very efficient on disk-based random access, since it’s using log-structured-merge (LSM) trees.

V1.8 FEATURES
=============
a. Better performances on Random-Read/Random-Write
b. Log recovery
c. Using LSM-Tree as storage engine
d. Background detached-thread merging
e. Level LRU
f. Support billion data

This came in over the nosql mailing list.

Pointers to literature on how “disk-based random access” has shaped our thinking/technology for processing? Or how going “off cache” for random access is going to shape the next mind-set about processing?

Twitter Streaming with EventMachine and DynamoDB

Filed under: Dynamo,EventMachine,MongoDB,Tweets — Patrick Durusau @ 7:28 pm

Twitter Streaming with EventMachine and DynamoDB

From the post:

This week Amazon Web Services launched their latest database offering ‘DynamoDB’ – a highly-scalable NoSQL database service.

We’ve been using a couple of NoSQL database engines at work for a while now: Redis and MongoDB. Mongo allowed us to simplify many of our data models and represent more faithfully the underlying entities we were trying to represent in our applications and Redis is used for those projects where we need to make sure that a person only classifies an object once.1

Whether you’re using MongoDB or MySQL, scaling the performance and size of a database is non-trivial and is a skillset in itself. DynamoDB is a fully managed database service aiming to offer high-performance data storage and retrieval at any scale, regardless of request traffic or storage requirements. Unusually for Amazon Web Services, they’ve made a lot of noise about some of the underlying technologies behind DynamoDB, in particular they’ve utilised SSD hard drives for storage. I guess telling us this is designed to give us a hint at the performance characteristics we might expect from the service.

» A worked example

As with all AWS products there are a number of articles outlining how to get started with DynamoDB. This article is designed to provide an example use case where DynamoDB really shines – parsing a continual stream of data from the Twitter API. We’re going to use the Twitter streaming API to capture tweets and index them by user_id and creation time.

Wanted to include something a little different after all the graph database and modeling questions. 😉

I need to work on something like this to more effectively use Twitter as an information stream. Passing all mentions of graphs and related terms along for further processing, perhaps by a map between Twitter userIDs and known authors. Could be interesting.

Bipartite Graphs as Intermediate Model for RDF

Filed under: Hypergraphs,RDF,Semantic Web — Patrick Durusau @ 7:28 pm

Bipartite Graphs as Intermediate Model for RDF by Jonathan Hayes and Claudio Gutierrez.

Abstract:

RDF Graphs are sets of assertions in the form of subject-predicate-object triples of information resources. Although for simple examples they can be understood intuitively as directed labeled graphs, this representation does not scale well for more complex cases, particularly regarding the central notion of connectivity of resources.

We argue in this paper that there is need for an intermediate representation of RDF to enable the application of well-established methods from Graph Theory. We introduce the concept of Bipartite Statement-Value Graph and show its advantages as intermediate model between the abstract triple syntax and data structures used by applications. In the light of this model we explore issues like transformation costs, data/schema structure, the notion of connectivity, and database mappings.

A quite different take on the representation of RDF than in Is That A Graph In Your Cray? Here we encounter hypergraphs for modeling RDF.

Suggestions on how to rank graph representations of RDF?

Or perhaps better, suggestion on how to rank graph representations for use cases?

Putting the question of what (connections/properties) we want to model before the question of how (RDF, etc.) we intend to model it.

Isn’t that the right order?

Comments?

Populating the Semantic Web…

Filed under: Data Mining,Entity Extraction,Entity Resolution,RDF,Semantic Web — Patrick Durusau @ 7:28 pm

Populating the Semantic Web – Combining Text and Relational Databases as RDF Graphs by Kate Bryne.

I ran across this while looking for RDF graph material today. Delighted to find someone interested in the problem of what do we do with existing data, even if new data is in some semantic web format?

Abstract:

The Semantic Web promises a way of linking distributed information at a granular level by interconnecting compact data items instead of complete HTML pages. New data is gradually being added to the SemanticWeb but there is a need to incorporate existing knowledge. This thesis explores ways to convert a coherent body of information from various structured and unstructured formats into the necessary graph form. The transformation work crosses several currently active disciplines, and there are further research questions that can be addressed once the graph has been built.

Hybrid databases, such as the cultural heritage one used here, consist of structured relational tables associated with free text documents. Access to the data is hampered by complex schemas, confusing terminology and difficulties in searching the text effectively. This thesis describes how hybrid data can be unified by assembly into a graph. A major component task is the conversion of relational database content to RDF. This is an active research field, to which this work contributes by examining weaknesses in some existing methods and proposing alternatives.

The next significant element of the work is an attempt to extract structure automatically from English text using natural language processing methods. The first claim made is that the semantic content of the text documents can be adequately captured as a set of binary relations forming a directed graph. It is shown that the data can then be grounded using existing domain thesauri, by building an upper ontology structure from these. A schema for cultural heritage data is proposed, intended to be generic for that domain and as compact as possible.

Another hypothesis is that use of a graph will assist retrieval. The structure is uniform and very simple, and the graph can be queried even if the predicates (or edge labels) are unknown. Additional benefits of the graph structure are examined, such as using path length between nodes as a measure of relatedness (unavailable in a relational database where there is no equivalent concept of locality), and building information summaries by grouping the attributes of nodes that share predicates.

These claims are tested by comparing queries across the original and the new data structures. The graph must be able to answer correctly queries that the original database dealt with, and should also demonstrate valid answers to queries that could not previously be answered or where the results were incomplete.

This will take some time to read but it looks quite enjoyable.

MapReduceXMT

Filed under: MapReduceXMT,OWL,RDF — Patrick Durusau @ 7:28 pm

MapReduceXMT from Sandia National Laboratories.

From the webpage:

Welcome to MapReduceXMT

MapReduceXMT is a library that ports the MapReduce paradigm to the Cray XMT.

MapReduceXMT is copyrighted and released under a Berkeley open source license. However, the code is still very much in development and there has not been a formal release of the software.

SPEED-MT Semantic Processing Executed Efficiently and Dynamically

This trac site is currently being used to house SPEED-MT, which contains a set of algorithms and data structures for processing semantic web data on the Cray XMT.

SPEED-MT Modules

  • Dictionary Encoding
  • Decoding
  • RDFS/OWL Closure
  • RDF Stats
  • RDF Dedup

OK, so this one is tied a little more closely to the Cray XMT. 😉

But modules are ones that are likely to be of interest for processing RDF triples/quads.

This was cited in “High-performance Computing Applied to Semantic Databases” article that I covered in Is That A Graph In Your Cray?

MultiThreaded Graph Library (MTGL)

Filed under: Graphs,MultiThreaded Graph Library (MTGL) — Patrick Durusau @ 7:27 pm

MultiThreaded Graph Library (MTGL) from Sandia National Laboratories.

From the webpage:

The MultiThreaded Graph Library (MTGL) is a collection of algorithms and data structures designed to run on shared-memory platforms such as the massively multithreaded Cray XMT, or, with support from the Qthreads library, on Symmetric Multiprocessor (SMP) machines or multi-core workstations. The software and API is modeled after the Boost Graph Library, though the internals differ in order to leverage shared memory machines.

The MTGL is copyrighted and released under a Berkeley open source license. If you are a developer, you may get the most recent unreleased version of the MTGL (after logging in) by clicking the “Browse Source” tab at the top of this page, then clicking on “trunk,” and finally clicking on the “zip archive” link. See below for the MTGL 1.0 release, which will have various improvements and will not include deprecated/experimental code.

This was cited and used in the “High-performance Computing Applied to Semantic Databases” article that I covered in Is That A Graph In Your Cray?

As of 2/15/2012, version 1.1 is available.

You may not have time on a Cray but if you have a multi-core workstation this library may spark some creative thoughts!

Is That A Graph In Your Cray?

Filed under: Cray,Graphs,Neo4j,RDF,Semantic Web — Patrick Durusau @ 7:27 pm

If you want more information about graph processing in Cray’s uRIKA (I did), try: High-performance Computing Applied to Semantic Databases by Eric L. Goodman, Edward Jimenez, David Mizell, Sinan al-Saffar, Bob Adolf, and David Haglin.

Abstract:

To-date, the application of high-performance computing resources to Semantic Web data has largely focused on commodity hardware and distributed memory platforms. In this paper we make the case that more specialized hardware can offer superior scaling and close to an order of magnitude improvement in performance. In particular we examine the Cray XMT. Its key characteristics, a large, global shared memory, and processors with a memory-latency tolerant design, offer an environment conducive to programming for the Semantic Web and have engendered results that far surpass current state of the art. We examine three fundamental pieces requisite for a fully functioning semantic database: dictionary encoding, RDFS inference, and query processing. We show scaling up to 512 processors (the largest configuration we had available), and the ability to process 20 billion triples completely in memory.

Unusual to see someone apologize for only having “…512 processors (the largest configuration we had available)….,” but that isn’t why I am citing the paper. 😉

The “dictionary encoding” (think indexing) techniques may prove instructive, even if you don’t have time on a Cray XMT. The techniques presented achieve a compression of the raw data between 3.2. and 4.4.

Take special note of the statement: “To simplify the discussion, we consider only semantic web data represented in N-Triples.” Actually the system presented processes only subject, edge, object triples. Unlike Neo4j, for instance, it isn’t a generalized graph engine.

Specialized hardware/software is great but let’s be clear about that upfront. You may need more than RDF graphs can offer. Like edges with properties.

Other specializations include, a process of “closure” has several simplifications to enable a single pass through the RDFS rule set and querying doesn’t allow a variable in the predicate position.

Granting that this results in a hardware/software combination that can claim “interactivity” on large data sets, but what is the cost of making that a requirement?

Take the best known “connect the dots” problem of this century, 9/11. Analysts did not need “interactivity” with large data sets measured in nano-seconds. Batch processing that lasted for a week or more would have been more than sufficient. Most of the information that was known was “known” by various parties for months.

More than that, the amount of relevant was quite small when compared to the “Semantic Web.” There were known suspects (as there are now), with known associates, with known travel patterns, so eliminating all the business/frequent flyers from travel data is a one time filter, plus any > 40 females traveling on US passports (grandmothers). Similar criteria can reduce information clutter, allowing analysts to focus on important data, as opposing to paging through “hits” in a simulation of useful activity.

I would put batch processing of graphs of relevant information against interactive churning of big data in a restricted graph model any day. How about you?

March 2, 2012

Breaking into the NoSQL Conversation

Filed under: NoSQL,RDF,Semantic Web — Patrick Durusau @ 8:05 pm

Breaking into the NoSQL Conversation by Rob Gonzalez.

Semantic Web Community: I’m disappointed in us! Or at least in our group marketing prowess. We have been failing to capitalize on two major trends that everyone has been talking about and that are directly addressable by Semantic Web technologies! For shame.

I’m talking of course about Big Data and NoSQL. Given that I’ve already given my take on how Semantic Web technology can help with the Big Data problem on SemanticWeb.com, this time around I’ll tackle NoSQL and the Semantic Web.

After all, we gave up SQL more than a decade ago. We should be part of the discussion. Heck, even the XQuery guys got in on the action early!

(much content omitted, read at your leisure)

AllegroGraph, Virtuoso, and Systap can all scale, and can all shard like Mongo. We have more mature, feature rich, and robust APIs via Sesame and others to interact with the data in these stores. So why aren’t we in the conversation? Is there something really obvious that I’m missing?

Let’s make it happen. For more than a decade our community has had a vision for how to build a better web. In the past, traditional tools and inertia have kept developers from trying new databases. Today, there are no rules. It’s high time we stepped it up. On the web we can compete with MongoDB directly on those use cases. In the enterprise we can combine the best of SQL and NoSQL for a new class of flexible, robust data management tools. The conversation should not continue to move so quickly without our voice.

I hate to disappoint but the reason the conversation is moving so quickly is the absence of the Semantic Web voice.

Consider my post earlier today about the new hardware/software release by Cray, A Computer More Powerful Than Watson. The release refers to RDF as a “graph format.”

With good reason. The uRIKA system doesn’t use RDF for reasoning at all. It materializes all the implied nodes and searches the materialized graph. Impressive numbers but reasoning it isn’t.

Inertia did not stop developers from trying new databases. New databases that met no viable (commercially that is) use cases went unused. What’s so hard to understand about that?

An essay on why programmers need to learn statistics

Filed under: Data,Statistics — Patrick Durusau @ 8:05 pm

An essay on why programmers need to learn statistics from Simply Statistics.

Truly an amazing post!

But it doesn’t apply just to programmers, anyone evaluating data needs to understand statistics and perhaps more importantly, have the ability to know when the data isn’t quite right. Math is correct but the data is too clean, too good, too …., something that makes you uneasy with the data.

Consider the Duke Saga for example.

The Library In Your Pocket

Filed under: Library,Library software — Patrick Durusau @ 8:04 pm

The Library In Your Pocket by Meredith Farkas.

A delightful slidedeck of suggestions for effective delivery of content to mobile devices for libraries.

Since topic maps deliver content as well, I thought at least some of the suggestions would be useful there as well.

The effective design of library websites for mobile access seems particularly appropriate for topic maps.

Do you have a separate interface for mobile access? Care to say a few words about it?

Call for Participation: OASIS LegalDocumentML (LegalDocML) Technical Committee

Filed under: Law,Law - Sources,Legal Informatics — Patrick Durusau @ 8:04 pm

Call for Participation: OASIS LegalDocumentML (LegalDocML) Technical Committee

If you are interested in topic maps and legal documents, take note of the following:

Those wishing to become voting members of the committee must join by 22 March 2012.

The committee’s first meeting will be held 29 March 2012, by telephone.

Legal publishers take particular note if your publication system is using other formats.

Topic maps can provide mappings between the deliverables of this TC and your current format.

How large that step will be, will depend on the outcome of TC deliberations. Participation in the TC may influence those deliberations.

Let me know if you need more information.

Cray Parlays Supercomputing Technology Into Big Data Appliance

Filed under: Cray,Graphs,YarcData — Patrick Durusau @ 8:04 pm

Cray Parlays Supercomputing Technology Into Big Data Appliance by Michael Feldman.

From the post:

For the first time in its history, Cray has built something other than a supercomputer. On Wednesday, the company’s newly hatched YarcData division launched “uRiKA,” a hardware-software solution aimed at real-time knowledge discovery with terascale-sized data sets. The system is designed to serve businesses and government agencies that need to do high-end analytics in areas as diverse as social networking, financial management, healthcare, supply chain management, and national security.

As befits Cray’s MO, their target market for uRiKA, (pronounced Eureka) is slanted toward the cutting edge. It uses a graph-based data approach to do interactive analytics with large, complex, and often dynamic data sets. “We are not trying to be everything for everybody,” says YarcData general manager Arvind Parthasarathi. (emphasis added) (YarcData is a new division at Cray. Just a little more name confusion for everyone.

Read the article for the hardware/performance stats but consider the following on graphs:

More to the point, uRiKA is designed to analyze graphs rather than simple tabular databases. A graph, one of the fundamental data abstractions in computer science, is basically a structure whose objects are linked together by some relationship. It is especially suited to structures like website links, social networks, and genetic maps — essentially any data set where the relationships between the objects are as important as the objects themselves.

This type of application exists further up the analytics food change than most business intelligence or data mining applications. In general, a lot of these more traditional applications involve searching for particular items or deriving simple relationships. The YarcData technology is focused on relationship discovery. And since it’s uses graph structures, the system can support graph-based reasoning and deductions to uncover new relationships.

A typical example is pattern-based queries — does x resemble y? This might not lead to a definitive answer, but will provide a range of possibilities, which can then be further refined. So, for example, one of the YarcData’s early customers is a government agency that is interested in finding “persons of interest.” They maintain profiles of terrorists, criminals or other ne’er-do-wells, and are using uRiKA to search for patterns of specific behaviors and activities. A credit card company could use the same basic algorithms to search for fraudulent transactions.

YarcData uses the term “relationship analytics” to describe this approach. While that might sound a bit Oprah-ish, it certainly emphasizes the importance of extracting knowledge from how the objects are connected rather than just their content. This is not to be confused with relational databases, which are organized in tabular form and use simpler forms of querying.

And:

After data is ingested, it needs to be converted to an internal format called RDF, or Resource Description Framework (in case you were wondering, uRiKA stands for Universal RDF Integration Knowledge Appliance), an industry standard graph format for representing information in the Web. According to Mufti, they are providing tools for RDF data conversion and are also laying the groundwork for a standards-based software that allows for third-party conversion tools.

Industry standard is a common theme here. uRiKA’s software internals include SUSE Linux, Java, Apache, WS02, Google Gadgets, and Relfinder. That stack of interfaces allows users to write or port analytics applications to the platform without having to come up with a uRiKA-specific implementation. So Java, J2EE, SPARQL, and Gadget apps are all fair game. YarcData thinks this will be key to encouraging third-party developers to build applications on top of the system, since it doesn’t require them to use a whole new programming language or API.

At least as of today, CrayDoc has no documentation on conversion to the “…industry standard graph format…” RDF or the details of its graph operations.

Parthasarathi talks about shoehorning data into relational databases. I wonder why uRiKA shoehorns data into RDF?

Perhaps the documentation, when it appears, will explain the choice of RDF as a “data format.” (I know RDF isn’t a format, I am just repeating what the article says.)

I am curious because efficient graph structures are going to be necessary for a variety of problems. Has Cray/YarcData compared graph structures, RDF and others for performance on particular problems? If so, are the tests and test data available?

Before laying out sums in the “low hundreds of thousands of dollars,” I would want to know I wasn’t brute forcing solutions, when less costly and elegant solutions existed.
How Big Data Shapes Business Results

Filed under: BigData,Marketing — Patrick Durusau @ 8:04 pm

How Big Data Shapes Business Results by Timo Elliott.

From the post:

At this week’s SAP BI2012 conference, I had the honor of co-presenting the keynote, “How Big Data Shapes Business Results” with Steve Lucas, SAP EVP Business Analytics, Database & Technology, and with demo support from Fred Samson.

The big theme of the last year has been big data. There was a lot of innovation in many areas, but big data has had a huge impact on both how organizations plan their overall technology strategy as well as affecting other specific strategies such as analytics, cloud, mobile, social, and collaboration.

Steve kicked off by addressing the confusion (and cynicism) about the definition of “big data” — noting that people had supplied at least twenty different definitions in response to his question on Twitter. The popularity of the term has been driven by the rise of new open-source technology technology such as Hadoop, but it is now typically used to refer to what Gartner calls “extreme data”.

Extreme data is on the high end of one or more of the ‘3Vs’: Volume, Velocity, and Variety (and some note that there’s a fourth V, validity, that must be taken account of: data quality remains the #1 struggle for organizations trying to implement successful analytic projects).

To address all of these effectively, any “big data solution” has to encompass a wide range of different technologies. SAP is proposing a new “Big Data Processing Framework” that includes integration to new tools such as Hadoop, but also addresses the need for the other ‘V’s for a global approach to ingesting, storing, processing, and presenting data from both structured and less-structured sources. Many more details about this framework will be available in the coming months. (emphasis added)

Twenty different definitions of “big data?” No wonder I have been confused. Well, that’s one explanation anyway. 😉

There is another confusion, one that Timo the promotion of SAP solutions doesn’t address.

That confusion is whether “big data,” by any definition, is relevant for a project and/or enterprise.

Digital data is doubly every eighteen months, but that doesn’t mean that every project has to cope with the four V’s (Volume, Velocity, Variety, Validity).

Rather, every project has to cope with relevant big data and the relevant four V’s.

For acronym hounds, RBD (Relevant Big Data) and RVVVV (Relevant Volume, Velocity, Variety, Validity).

Unless and until you specify your RBD and RV4, you can’t meaningfully evaluate the solutions offered by SAP or anyone else for “big data.”

Their products work for their vision of “big data.”

Your project needs to work for your vision of “big data.”

Now there is a topic map project that the Economist or some similar group could undertake. Create a topic map to cut across the product hype around applications to deal with “big data” so consumers (even enterprises) can find products for their relevant big data.

BI Requirements Gathering: Leveraging What Exists

Filed under: Requirements — Patrick Durusau @ 8:04 pm

BI Requirements Gathering: Leveraging What Exists by Jonathan G. Geiger.

From the post:

Analysis of Existing Queries and Reports

Businesspeople who are looking for business intelligence capabilities typically are not starting from a clean slate. Over time, they have established a series queries and reports that are executed on an ad hoc or regular basis. These reports contain data that they receive and purportedly use. Understanding these provides both advantages and disadvantages when gathering requirements. The major advantage is that using the existing deliverables helps to provide a basis for discussion. Commenting on something concrete is easier than generating new ideas. With the existing reports in hand, key questions to ask include:

This post includes references to Jonathan’s posts on interviewing and facilitation.

These posts are great guides to use in developing BI requirements. Your circumstances will vary so you will need to adapt these techniques to your particular circumstances. But they are a great starting place.

If your programmers object to requirements gathering because of their “methodology,” I suggest you point them to: Top Ten Reasons Systems Projects Fail by Dr. Paul Dorsey. Or you can search for “project failure rate” and pick any other collection about project failure.

You will not find a single study that points to adequate requirements as a reason for project failure. Quite often inadequate requirements are mentioned but never the contrary. Suspect there is a lesson there. Can you guess what it is?

Indexing Files via Solr and Java MapReduce

Filed under: Cloudera,Indexing,MapReduce,Solr — Patrick Durusau @ 8:04 pm

Indexing Files via Solr and Java MapReduce by Adam Smieszny.

From the post:

Several weeks ago, I set about to demonstrate the ease with which Solr and Map/Reduce can be integrated. I was unable to find a simple, yet comprehensive, primer on integrating the two technologies. So I set about to write one.

What follows is my bare-bones tutorial on getting Solr up and running to index each word of the complete works of Shakespeare. Note: Special thanks to Sematext for looking over the Solr bits and making sure they are sane. Check them out if you’re going to be doing a lot of work with Solr, ElasticSearch, or search in general and want to bring in the experts.

Looks like a nice weekend (if you are married, long night if not) project!

If you have the time, look over this post and report back on your experiences.

Particularly if you learn something new or see something others need to know about (such as other resources).

Ontolica

Filed under: Ontolica,SharePoint — Patrick Durusau @ 8:03 pm

Ontolica

I saw Ontolica mentioned in a blog post as a SharePoint search solution. Going to their site I found:

Ontolica for Sharepoint 2010 takes the basic capabilities of SharePoint Search and transforms them into a true enterprise collaboration platform and addresses key SharePoint maturity challenges.The complete solution is easily-deployed to provide more relevant results, faster search navigation, and deep scalability. Best of all, Ontolica Search allows SharePoint administrators to implement customizations without programing. By selecting options in the administrator interface and immediately deploying them to end-users. It install in minutes , and can be adapted and customized without risk to meet the needs of almost any organization.

Being topic map oriented by nature, ;-), I looked for aggregation capabilities:

Need to find all of the documents on your farm that are tagged with a case-number, as well as all of the documents from your file-shares that contain that case-number in their content? With Ontolica Aggregate this is simple. And unlike content query solutions, Ontolica Aggregate leverages the power of the SharePoint search infrastructure, to provide unlimited scalability, and virtual libraries of any size.

In other words I can find all the documents that have the same case-number.

Are you as unimpressed as I am?

The other capabilities, formats supported, previews, filters, suggestions, yawn, visit the site for a complete list of features found on most if not all SharePoint enhancement software.

I won’t repeat the stories you already know about SharePoint and why it needs enhancement. No argument there.

I do have two suggestions:

  1. Consider a topic map based solution to augment your present SharePoint installation. (Try Networked Planet)
  2. Suggest to MS that it incorporate topic map capabilities into SharePoint X. Sharepoint X archives would be accessible as Sharepoint changes and to access Sharepoint data in other applications. (Imagine, mapping, not migrating data. I wonder which vendor would benefit from that?)

A Computer More Powerful Than Watson

Filed under: Design — Patrick Durusau @ 8:03 pm

Who is Dr. Fill?

😉

The Economist in A match for angry words, reports on the construction of a cross-word playing computer, Dr. Fill, that must meet this constraint:

Dr Ginsberg gave himself an additional constraint in building his solver: that it fit on a laptop. That requires his software to be cleverer than Watson, which had many terabytes of data to sift through, but also makes it portable for shows. Dr Ginsberg says this is possible because crossword puzzle clues have correct answers that can be tested against the grid.

The story is amusing and the jury is still the success of Dr. Fill.

The important lesson is that Dr. Fill was designed to take advantage of the constraints imposed by the problem. Dr. Fill makes no attempt to be a fully general solution and therein lies the cleverness of its design. It solves the problem posed, not all other possible problems or variants.

How many unasked problems does your latest solution solve?

March 1, 2012

Is Wikipedia Going To Explode?

Filed under: Combinatorics,Wikipedia — Patrick Durusau @ 9:10 pm

I ran across a problem in Wikipedia that may mean it is about to explode. You decide.

You have heard about the danger of “combinatorial explosions” if we have more than one identifier. Every identifier has to be mapped to every other identifier.

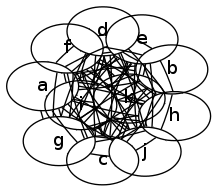
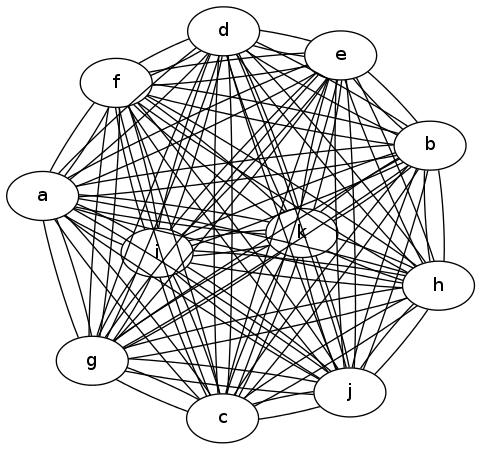
Imagine that a – j represent different identifiers for the same subject.

This graphic represents a “small” combinatorial explosion.

combinatorial explosion

If that looks hard to read, here is a larger version:

Large Explosion

Is that better? 😉

Here is where I noticed the problem: the Wikipedia XML file has synonyms for the entries.

The article on anarchism has one hundred and one other names:

  1. af:Anargisme
  2. als:Anarchismus
  3. ar:لاسلطوية
  4. an:Anarquismo
  5. ast:Anarquismu
  6. az:Anarxizm
  7. bn:নৈরাজ্যবাদ
  8. zh-min-nan:Hui-thóng-tī-chú-gī
  9. be:Анархізм
  10. be-x-old:Анархізм
  11. bo:གཞུང་མེད་ལམ་སྲོལ།
  12. bs:Anarhizam
  13. br:Anveliouriezh
  14. bg:Анархизъм
  15. ca:Anarquisme
  16. cs:Anarchismus
  17. cy:Anarchiaeth
  18. da:Anarkisme
  19. pdc:Anarchism
  20. de:Anarchismus
  21. et:Anarhism
  22. el:Αναρχισμός
  23. es:Anarquismo
  24. eo:Anarkiismo
  25. eu:Anarkismo
  26. fa:آنارشیسم
  27. hif:Khalbali
  28. fo:Anarkisma
  29. fr:Anarchisme
  30. fy:Anargisme
  31. ga:Ainrialachas
  32. gd:Ain-Riaghailteachd
  33. gl:Anarquismo
  34. ko:아나키즘
  35. hi:अराजकता
  36. hr:Anarhizam
  37. id:Anarkisme
  38. ia:Anarchismo
  39. is:Stjórnleysisstefna
  40. it:Anarchismo
  41. he:אנרכיזם
  42. jv:Anarkisme
  43. kn:ಅರಾಜಕತಾವಾದ
  44. ka:ანარქიზმი
  45. kk:Анархизм
  46. sw:Utawala huria
  47. lad:Anarkizmo
  48. krc:Анархизм
  49. la:Anarchismus
  50. lv:Anarhisms
  51. lb:Anarchismus
  52. lt:Anarchizmas
  53. jbo:nonje’asi’o
  54. hu:Anarchizmus
  55. mk:Анархизам
  56. ml:അരാജകത്വവാദം
  57. mr:अराजकता
  58. arz:اناركيه
  59. ms:Anarkisme
  60. mwl:Anarquismo
  61. mn:Анархизм
  62. nl:Anarchisme
  63. ja:アナキズム
  64. no:Anarkisme
  65. nn:Anarkisme
  66. oc:Anarquisme
  67. pnb:انارکی
  68. ps:انارشيزم
  69. pl:Anarchizm
  70. pt:Anarquismo
  71. ro:Anarhism
  72. rue:Анархізм
  73. ru:Анархизм
  74. sah:Анархизм
  75. sco:Anarchism
  76. simple:Anarchism
  77. sk:Anarchizmus
  78. sl:Anarhizem
  79. ckb:ئانارکیزم
  80. sr:Анархизам
  81. sh:Anarhizam
  82. fi:Anarkismi
  83. sv:Anarkism
  84. tl:Anarkismo
  85. ta:அரசின்மை
  86. th:อนาธิปไตย
  87. tg:Анархизм
  88. tr:Anarşizm
  89. uk:Анархізм
  90. ur:فوضیت
  91. ug:ئانارخىزم
  92. za:Fouzcwngfujcujyi
  93. vec:Anarchismo
  94. vi:Chủ nghĩa vô chính phủ
  95. fiu-vro:Anarkism
  96. war:Anarkismo
  97. yi:אנארכיזם
  98. zh-yue:無政府主義
  99. diq:Anarşizm
  100. bat-smg:Anarkėzmos
  101. zh:无政府主义

Now you can imagine the “combinatorial explosion” that awaits the entry on anarchism in Wikipedia, one hundred and two names (102, including English) when compared to my ten identifiers.

Except that Wikipedia leaves the relationships between all these identifiers for anarchism unspecified.

You can call them into existence, one to the other, as needed, but then you assume the burden of processing them. All the identifiers remain available to other users for their purposes as well.

Hmmm, with the language prefixes mapping to scopes, this looks like a good source for names and variant names for topics in a topic map.

What do you think?


According to my software, this is post #4,000. Looking for ways to better deliver information about topic maps and their construction. Suggestions (not to mention support) welcome!

A Coder Interview With John D. Cook

Filed under: Programming,Writing — Patrick Durusau @ 9:03 pm

A Coder Interview With John D. Cook

I have cited John D. Cook’s blog more than once.

I must confess that I cited this interview for the following quote:

What advice would you offer to an up-and-coming programmer?

Learn to express yourself clearly in writing. Buy a copy of Strunk and White and read it once a year.

If you’re a genius programmer but you cannot or will not write English prose, your influence will be limited.

Retrofitting Programming Languages for a Parallel World

Filed under: Parallel Programming,Parallelism — Patrick Durusau @ 9:02 pm

Retrofitting Programming Languages for a Parallel World by James Reinders.

From the post:

The most widely used computer programming languages today were not designed as parallel programming languages. But retrofitting existing programming languages for parallel programming is underway. We can compare and contrast retrofits by looking at four key features, five key qualities, and the various implementation approaches.

In this article, I focus on the features and qualities, leaving the furious debates over best approaches (language vs. library vs. directives, and abstract and portable vs. low-level with lots of controls) for another day.

Four key features:

  • Memory model
  • Synchronization
  • Tasks, not threads
  • Data, parallel support

Five qualities to desire:

  • Composability
  • Sequential reasoning
  • Communication minimization
  • Performance portability
  • Safety

Parallel processing as the default isn’t that far in the future.

Do you see any of these issues as not being relevant for the processing of topic maps?

And unlike programming languages, topic maps by definition can operate in semantically heterogeneous environments.

How’s that for icing on the cake of parallel processing?

The time to address the issues of parallel processing of topic maps is now.

Suggestions?

Target, Pregnancy and Predictive Analytics (parts 1 and 2)

Filed under: Data Analysis,Machine Learning,Predictive Analytics — Patrick Durusau @ 9:02 pm

Dean Abbott wrote a pair of posts on a New York Times article about Target predicting if customers are pregnant.

Target, Pregnancy and Predictive Analytics (part 1)

Target, Pregnancy and Predictive Analytics (part 2)

Read both I truly liked his conclusion that models give us the patterns in data but it is up to us to “recognize” the patterns as significant.

BTW, I do wonder what the different is between the New York Times snooping for secrets to sell newspapers versus Target to sell products? If you know, please give a shout!

10 Tips for Data Visualization

Filed under: Interface Research/Design,Visualization — Patrick Durusau @ 9:02 pm

10 Tips for Data Visualization by David Steier, William D. Eggers, Joe Leinbach, Anesa Diaz-Uda.

From the post:

After disaster strikes or government initiatives fail, in hindsight, we see all too often that warning signs were overlooked by decision-makers. Or sophisticated technology was installed, but nobody took the time to learn to use it. It’s often labeled “user error,” or “problem between keyboard and chair.” In analytics, the problem is especially acute — the most sophisticated analytics models in the world are futile unless decision-makers understand and act on the results appropriately.

This problem often arises because designers haven’t truly considered how those using the fancy dashboards, maps or policy visualizations will interact with the analytics. They may become enamored of the model’s power and try to fit every piece of data into it. However, in offering more options and parameters to control the model’s operation, and filling up every pixel of screen real estate, designers can fail to recognize that most government decision-makers are inundated with inputs, pressed for time and can only focus on essentials. As Yale professor and information design guru Edward Tufte wrote, “Clutter and confusion are not attributes of information; they are failures of design.”

In many cases, users can’t answer basic questions like “What should I pay attention to?” and “Now that I’ve seen this, what should I do?” If the answers aren’t readily apparent, the interface and analytics aren’t solving a problem — rather, they might be creating a bigger one. As one federal executive said recently, “No tweet stops bleeding.Unless something has actually changed, it’s just information. What pieces of data are actually going to help us make a better decision?”

Agencies should consider a more user-centric and outcome-centric approach to analytics design to visualize policy problems and guide executives toward better, faster, more informed decisions.

The good news is that government leaders are getting serious about making sense of their data, and constant advances in graphic, mobile and Web technology make it possible to translate “big data” into meaningful, impactful visual interfaces. Using visualization tools to present advanced analytics can help policymakers more easily understand a topic, create an instant connection to unseen layers of data, and provide a sense of scale in dealing with large, complex data sets.

Read the post to pick up the ten tips. And re-read them about every three months or so.

I am curious about the point under letting users lead that reads:

If enough users believe an interface is unsatisfactory, the designer is well advised to accept their judgment.

That runs counter to my belief that an interface exists solely to assist the user in some task. What other purpose would an interface have? Or should I say what other legitimate purpose would an interface have? 😉 (Outside of schools where interfaces are designed to educate or challenge the user. If I am on deadline with a project, the last think I want is an interface that attempts to educate or challenge me.)

Transactional Lucene

Filed under: Lucene,Searching — Patrick Durusau @ 9:01 pm

Transactional Lucene

Mike McCandless writes:

Many users don’t appreciate the transactional semantics of Lucene’s APIs and how this can be useful in search applications. For starters, Lucene implements ACID properties:

If you have some very strong coffee and time to play with your experimental setup of Lucene, this is a post to get lost in.

When I read a post like this it sparks one idea and then another and pretty soon most of the afternoon is gone.

Paper vs. Electronic Brick, What’s the Difference?

Filed under: Books,eBooks,Law,Law - Sources — Patrick Durusau @ 9:01 pm

I think the comparison that Elmer Masters is looking for in The Future of The (Case)Book Is The Web, is paper vs. electronic brick, what’s the difference?

He writes:

Recently there has been an explosion of advances in the ebook arena. New tools, new standards and formats, and new platforms seem to be coming out every day. The rush to get books into an “e” format is on, but does it make a real difference?

The “e” versions of books offer little in the way of improvement over the print version of the same book. Sure, these new formats provide a certain increase in accessibility over print by running on devices that are lighter than print books and allow for things like increasing font size, but there is little else. It is, after all, just a matter of reading the same text on some sort of screen instead of paper.

Markelaw school booksters will tell you that the Kindle, Nook, iPad, and various software readers are the future of the book, an evolutionary, if not revolutionary, step in reading and learning. But that does not ring true. These platforms are really just another form for print. So now beside hard cover and paperback, you can get the same content on any number of electronic platforms. Is that so revolutionary? Things like highlighting and note taking are just replications of the analog versions. Like their analog counterparts, notes and highlights on these platforms are typically locked to the hardware or software reader, no better than the highlights and margin notes of print books. These are just closed platforms, “e” or print, just silos of information.

Unlocking the potential of a book that is locked to a specific platform requires moving the book to an open platform with no real limits like the web. On the web the the book is suddenly expansive. Anything that you can do on the web, you can do with a book. As an author, reader, student, teacher, scholar; anything is possible with a book that is on the open web. The potential for linking, including external material, use of media, note taking, editing, markup, remixing are opened without the bounds of a specific reader platform. A book as a website provides the potential for unlimited customization that will work across any hardware platform.

If you have ever seen a print version of a law school casebook, you know what I mean by “paper brick.”

If you have a Kindle, Nook, etc., with a law school casebook, you know what I mean by “electronic brick.”

The latter is smaller, lighter, can carry more content, but it is still a brick, albeit an electronic one.

Elmer’s moniker “website” covers an HTML engine that serves out topic map augmented content.

We have all seen topic map engines that export to HTML output.

What about specifying HTML authoring that is by default the equivalent to the export a topic map?

And tools that automatically capture such website content and “merge” it with other specified content? A “point and click” interface for authors.

All from the FWB (Friendly Web Browser). 😉

The Lady Librarian of Toronto

Filed under: Librarian/Expert Searchers,Library — Patrick Durusau @ 9:00 pm

The Lady Librarian of Toronto

Cynthia Murrell writes:

Ah, the good old days. Canada’s The Globe and Mail profiles a powerhouse of a librarian who recently passed away at the age of 100 in “When Lady Librarians Always Wore Skirts and You didn’t Dare Make Noise.” When Alice Moulton began her career, libraries were very different than they are today. Writer Judy Stoffman describes:

When Alice Moulton went to work at the University of Toronto library in 1942, libraries were forbidding, restricted spaces organized around the near-sacred instrument known as the card catalogue. They were ruled by a chief librarian, always male, whose word was law. Staff usually consisted of prim maiden ladies, dressed in skirts and wearing serious glasses, like the character played by Donna Reed in It’s a Wonderful Life, in the alternate life she would have had without Jimmy Stewart.

The article about Alice Moulton is very much worth reading.

True enough that libraries are different today than they were say forty or more years ago, but not all of that has been for the good.

Libraries in my memory were places where librarians, who are experts at uncovering information, would assist patrons find more information than they thought possible. Often teaching the techniques necessary to use arcane publications to do so.

Make no mistake, librarians still fulfill that role in many places but it is a popular mistake among funders to think that searching the WWW should be good enough for anyone. Why spend extra money for reference services?

True, if you are interested in superficial information, then by all means, use the WWW. Ask your doctor to consult it on your next visit. Or your lawyer. Good enough for anyone else, should be good enough for you.

I read posts about “big data” everyday and post reports of some of them here. It will take technological innovations to master “big data,” but that is only part of the answer.

To find useful information in the universe of “big data,” we are going to need something else.

The something else is going to be librarians like Alice Moulton, who can find resources we never imagined existed.

Crowdsourcing and the end of job interviews

Filed under: Authoring Topic Maps,Crowd Sourcing — Patrick Durusau @ 9:00 pm

Crowdsourcing and the end of job interviews by Panos Ipeirotis.

From the post:

When you discuss crowdsourcing solutions with people that have not heard the concept before, they tend to ask the question: “Why is crowdsourcing so much cheaper than existing solutions that depend on ‘classic’ outsourcing?

Interestingly enough, this is not a phenomenon that appears only in crowdsourcing. The Sunday edition of the New York Times has an article titled Why Are Harvard Graduates in the Mailroom?. The article discusses the job searching strategy in some fields (e.g., Hollywood, academic, etc), where talented young applicants are willing to start with jobs that are paying well below what their skills deserve, in exchange for having the ability to make it big later in the future:

[This is] the model lottery industry. For most companies in the business, it doesn’t make economic sense to, as Google does, put promising young applicants through a series of tests and then hire only the small number who pass. Instead, it’s cheaper for talent agencies and studios to hire a lot of young workers and run them through a few years of low-paying drudgery…. This occupational centrifuge allows workers to effectively sort themselves out based on skill and drive. Over time, some will lose their commitment; others will realize that they don’t have the right talent set; others will find that they’re better at something else.

Interestingly enough, this occupational centrifuge is very close to the model of employment in crowdsourcing.

The author’s take is that esoteric interview questions aren’t as effective as using a crowdsourcing model. I suspect he may be right.

If that is true, how would you go about structuring a topic map authoring project for crowdsourcing? What framework would you erect going into the project? What sort of quality checks would you implement? Would you “prime the pump” with already public data to be refined?

Are we on the verge of a meritocracy of performance?

As opposed to once meritocracies of performance, now the lands of clannish and odd questions in interviews?

« Newer Posts

Powered by WordPress