Another Word For It Patrick Durusau on Topic Maps and Semantic Diversity

March 9, 2015

Machine learning and magic [ Or, Big Data and magic]

Filed under: BigData,Machine Learning,Marketing — Patrick Durusau @ 6:14 pm

Machine learning and magic by John D. Cook.

From the post:

When I first heard about a lie detector as a child, I was puzzled. How could a machine detect lies? If it could, why couldn’t you use it to predict the future? For example, you could say “IBM stock will go up tomorrow” and let the machine tell you whether you’re lying.

Of course lie detectors can’t tell whether someone is lying. They can only tell whether someone is exhibiting physiological behavior believed to be associated with lying. How well the latter predicts the former is a matter of debate.

I saw a presentation of a machine learning package the other day. Some of the questions implied that the audience had a magical understanding of machine learning, as if an algorithm could extract answers from data that do not contain the answer. The software simply searches for patterns in data by seeing how well various possible patterns fit, but there may be no pattern to be found. Machine learning algorithms cannot generate information that isn’t there any more than a polygraph machine can predict the future.

I supplied the alternative title because of the advocacy of “big data” as a necessity for all enterprises, with no knowledge at all of the data being collected or of the issues for a particular enterprise that it might address. Machine learning suffers from the same affliction.

Specific case studies don’t answer the question of whether machine learning and/or big data is a fit for your enterprise or its particular problems. Some problems are quite common but incompetency in management is the most prevalent of all (Dilbert) and neither big data nor machine learning than help with that problem.

Take John’s caution to heart for both machine learning and big data. You will be glad you did!

March 8, 2015

The internet of things and big data: Unlocking the power

Filed under: BigData,IoT - Internet of Things — Patrick Durusau @ 4:58 pm

The internet of things and big data: Unlocking the power by Charles McLellan.

From the post:

If you have somehow missed the hype, the IoT is a fast-growing constellation of internet-connected sensors attached to a wide variety of ‘things’. Sensors can take a multitude of possible measurements, internet connections can be wired or wireless, while ‘things’ can literally be any object (living or inanimate) to which you can attach or embed a sensor. If you carry a smartphone, for example, you become a multi-sensor IoT ‘thing’, and many of your day-to-day activities can be tracked, analysed and acted upon.

Big data, meanwhile, is characterised by ‘four Vs‘: volume, variety, velocity and veracity. That is, big data comes in large amounts (volume), is a mixture of structured and unstructured information (variety), arrives at (often real-time) speed (velocity) and can be of uncertain provenance (veracity). Such information is unsuitable for processing using traditional SQL-queried relational database management systems (RDBMSs), which is why a constellation of alternative tools — notably Apache’s open-source Hadoop distributed data processing system, plus various NoSQL databases and a range of business intelligence platforms — has evolved to service this market.

The IoT and big data are clearly intimately connected: billions of internet-connected ‘things’ will, by definition, generate massive amounts of data. However, that in itself won’t usher in another industrial revolution, transform day-to-day digital living, or deliver a planet-saving early warning system. As EMC and IDC point out in their latest Digital Universe report, organisations need to hone in on high-value, ‘target-rich’ data that is (1) easy to access; (2) available in real time; (3) has a large footprint (affecting major parts of the organisation or its customer base); and/or (4) can effect meaningful change, given the appropriate analysis and follow-up action.

As we shall see, there’s a great deal less of this actionable data than you might think if you simply looked at the size of the ‘digital universe’ and the number of internet-connected ‘things’.

On the question of business opportunities, you may want to look at: 5 Ways the Internet of Things Drives New $$$ Opportunities by Bill Schmarzo.

A graphic from the report summarizes those opportunities:

IoT-5oppotunities

Select the image to see a larger (and legible) version. Most of the posts where I have encountered it leave it barely legible.

See the: EMC Digital Universe study – with research and analysis by IDC.

From the executive summary:

In 2013, only 22% of the information in the digital universe would be a candidate for analysis, i.e., useful if it were tagged (more often than not, we know little about the data, unless it is somehow characterized or tagged – a practice that results in metadata); less than 5% of that was actually analyzed. By 2020, the useful percentage could grow to more than 35%, mostly because of the growth of data from embedded systems.

Ouch! I had been wondering when the ships of opportunity were going to run aground on semantic incompatibility and/or a lack of semantics.

Where does your big data solution store “metadata” about your data (both keys and values)?

Or have you build a big silo for big data?

March 6, 2015

Welcome to NDS Labs!

Filed under: BigData — Patrick Durusau @ 5:52 pm

Welcome to NDS Labs!

From the webpage:

Now what is it?

NDS Labs is an environment where developers can prototype tools and capabilities that help build out the NDS framework and services. Labs provides development teams with access to significant storage, machines that can run services, and useful tools for managing and manipulating data.

We have set up NDS Labs as a place to learn through building what is needed in a national data infrastructure. It’s an environment that enables a developer or a small team of developers to explore an innovative idea, prototype a service, or connect existing applications together to build out the NDS ecosystem.

Find out more about:

NDS Labs is just one way to join the NDS community.

Still in the early stages, formulating governance structures, etc. but certainly a deeply interesting project!

I first saw this in a tweet by Kirk Borne.

March 2, 2015

RAD – Outlier Detection on Big Data

Filed under: BigData,Outlier Detection — Patrick Durusau @ 8:35 pm

RAD – Outlier Detection on Big Data by Jeffrey Wong, Chris Colburn, Elijah Meeks, and Shankar Vedaraman.

From the post:

Outlier detection can be a pain point for all data driven companies, especially as data volumes grow. At Netflix we have multiple datasets growing by 10B+ record/day and so there’s a need for automated anomaly detection tools ensuring data quality and identifying suspicious anomalies. Today we are open-sourcing our outlier detection function, called Robust Anomaly Detection (RAD), as part of our Surus project.

As we built RAD we identified four generic challenges that are ubiquitous in outlier detection on “big data.”

  • High cardinality dimensions: High cardinality data sets – especially those with large combinatorial permutations of column groupings – makes human inspection impractical.
  • Minimizing False Positives: A successful anomaly detection tool must minimize false positives. In our experience there are many alerting platforms that “sound an alarm” that goes ultimately unresolved. The goal is to create alerting mechanisms that can be tuned to appropriately balance noise and information.
  • Seasonality: Hourly/Weekly/Bi-weekly/Monthly seasonal effects are common and can be mis-identified as outliers deserving attention if not handled properly. Seasonal variability needs to be ignored.
  • Data is not always normally distributed: This has been a particular challenge since Netflix has been growing over the last 24 months. Generally though, an outlier tool must be robust so that it works on data that is not normally distributed.

In addition to addressing the challenges above, we wanted a solution with a generic interface (supporting application development). We met these objectives with a novel algorithm encased in a wrapper for easy deployment in our ETL environment.

Looking for “suspicious anomalies” is always popular, in part because it implies someone has deliberately departed from “normal” behavior.

Certainly important but as the FBI staging terror plots we discussed earlier today, show that the normal FBI “mo” is to stage terror plots and an anomaly would be a real terror plot, one not staged by the FBI.

The lesson being don’t assume outliers are departures from a desired norm. Can be, but not always are.

March 1, 2015

Big Data Never Sleeps

Filed under: BigData — Patrick Durusau @ 5:34 pm

big-data-sleeps

Suggestion: Enlarge and print out this graphic on 8 1/2 x 11 (or A4 outside of the US) paper. When “big data” sales people come calling, hand them a copy of it and ask them to outline the relevancy of any of the shown data to your products and business model.

Don’t get me wrong, there are areas seen and unforeseen, where big data is going to have unimaginable impacts.

However, big data solutions will be sold where appropriate and where not. The only way to protect yourself is to ask the same questions of big data sales people as you would of any vendor selling you more conventional equipment for your business. What is the cost? What benefits do you gain? How does it impact your profit margins? Will it result in new revenue streams and what has been the experience of others with those streams?

Or do you want to be YouTube and still not making a profit? If you like churn perhaps so but churn is a business model for hedge fund managers for the most part.

I first saw this in a tweet by Veronique Milsant.

February 24, 2015

Big data: too much information

Filed under: BigData,Law,Law - Sources — Patrick Durusau @ 11:50 am

Big data: too much information by Joanna Goodman.

Joanna’s post was the source I used for part of the post Enhanced Access to UK Legislation. I wanted to call attention to her post because it covered more than just the legislation.gov.uk site and offered several insights into the role of big data in law.

Consider Joanna’s list of ways big data can help with litigation:

Big data analysis – nine ways it can help

1 Big data analytics use algorithms to interrogate large volumes of unstructured, anonymised data to identify correlations, patterns and trends.

2 Has the potential to uncover patterns – and opportunities – that are not immediately obvious.

3 Graphics are key – visual representation is the only clear and comprehensive way to present the outcomes of big data analysis.

4 E-discovery is an obvious practical application of big data to legal practice, reducing the time and cost of trawling through massive volumes of structured and unstructured data held in different places.

5 Can identify patterns and trends, using client and case data, in dispute resolution to predict the probability of case outcomes. This facilitates decision-making – for example whether a claimant should pursue a case or to settle.

6 In the UK, the Big Data for Law project is digitising the entire statute book so that all UK legislation can be analysed, together with publicly available data from legal publishers. This will create the most comprehensive record of all UK legislation ever created together with analytical tools.

7 A law firm can use big data analytics to offer its insurance clients a service that identifies potentially fraudulent claims.

8 Big data will be usable as a design tool, to identify design patterns within statutes – combinations of rules that are used repeatedly to meet policy goals.

9 Can include transactional data and data from external sources, which can be cut in different ways.

Just as a teaser because the rest of her post is as interesting as what I quoted above, how would you use big data to shape debt collection practices?

See Joanna’s post to find out!

February 22, 2015

BigQuery [first 1 TB of data processed each month is free]

Filed under: Big Query,BigData,Google BigQuery,Google Cloud — Patrick Durusau @ 2:33 pm

BigQuery [first 1 TB of data processed each month is free]

Apologies if this is old news to you but I saw a tweet by GoogleCloudPlatform advertising the “first 1 TB of data processed each month is free” and felt compelled to pass it on.

Like so much news on the Internet, if it is “new” to us, we assume it must be “new” to everyone else. (That is how the warnings of malware that will alter your DNA spread.)

It is a very temping offer.

Temping enough that I am going to spend some serious time looking at BigQuery.

What’s your query for BigQuery?

February 21, 2015

Museums: The endangered dead [Physical Big Data]

Filed under: BigData,Museums — Patrick Durusau @ 11:43 am

Museums: The endangered dead by Christopher Kemp.

Ricardo Moratelli surveys several hundred dead bats — their wings neatly folded — in a room deep inside the Smithsonian Institution in Washington DC. He moves methodically among specimens arranged in ranks like a squadron of bombers on a mission. Attached to each animal’s right ankle is a tag that tells Moratelli where and when the creature was collected, and by whom. Some of the tags have yellowed with age — they mark bats that were collected more than a century ago. Moratelli selects a small, compact individual with dark wings and a luxurious golden pelage. It fits easily in his cupped palm.

To the untrained eye, this specimen looks identical to the rest. But Moratelli, a postdoctoral fellow at the Smithsonian’s National Museum of Natural History, has discovered that the bat in his hands is a new species. It was collected in February 1979 in an Ecuadorian forest on the western slopes of the Andes. A subadult male, it has been waiting for decades for someone such as Moratelli to recognize its uniqueness. He named it Myotis diminutus1. Before Moratelli could take that step, however, he had to collect morphometric data — precise measurements of the skull and post-cranial skeleton — from other specimens. In all, he studied 3,000 other bats from 18 collections around the world.

Myotis diminutus is not alone. And neither is Ricardo Moratelli.

Across the world, natural-history collections hold thousands of species awaiting identification. In fact, researchers today find many more novel animals and plants by sifting through decades-old specimens than they do by surveying tropical forests and remote landscapes. An estimated three-quarters of newly named mammal species are already part of a natural-history collection at the time they are identified. They sometimes sit unrecognized for a century or longer, hidden in drawers, half-forgotten in jars, misidentified, unlabelled.

A reminder that not all “big data” is digital, at least not yet.

The number of specimens already collected number in the billions worldwide. As Chris makes clear, many are languishing for lack of curators and in some cases, the collected specimens are the only evidence such creatures ever lived on the Earth.

Vint Cerf (“Father of the Internet,” not Al Gore) has warned of a “…’forgotten century…” of digital data.

As bad as a lost century of digital data may sound, our neglect of natural history collections threatens the loss millions of years of evolutionary history, forever.

PS: Read Chris’ post in full and push for greater funding for natural history collections. The history we save may turn out to be critically important.

Basic Understanding of Big Data…. [The need for better filtering tools]

Filed under: BigData,Intelligence — Patrick Durusau @ 11:12 am

Basic Understanding of Big Data. What is this and How it is going to solve complex problems by Deepak Kumar.

From the post:

Before going into details about what is big data let’s take a moment to look at the below slides by Hewlett-Packard.

What_is_BigData

The post goes on to describe big data but never quite reaches saying how it will solve complex problems.

I mention it for the HP graphic that illustrates the problem of big data for the intelligence community.

Yes, they have big data as in the three V’s: volume, variety, velocity and so need processing infrastructure to manage that as input.

However, the results they seek are not the product of summing clicks, likes, retweets, ratings and/or web browsing behavior, at least not for the most part.

The vast majority of the “big data” at their disposal is noise that is masking a few signals that they wish to detect.

I mention that because of the seeming emphasis of late on real time or interactive processing of large quantities of data, which isn’t a bad thing, but also not a useful thing when what you really want are the emails, phone contacts and other digital debris of say < one thousand (1,000) people (that number was randomly chosen as an illustration, I have no idea of the actual number of people being monitored). It may help to think of big data in the intelligence community as consisting of a vast amount of "big data" about which it doesn't care and a relatively tiny bit of data that it cares about a lot. The problem being one of separating the data into those two categories. Take the telephone metadata records as an example. There is some known set of phone numbers that are monitored and contacts to and from those numbers. The rest of the numbers and their data are of interest if and only if at some future date they are added to the known set of phone numbers to be monitored. When the monitored numbers and their metadata are filtered out, I assume that previously investigated numbers for pizza delivery, dry cleaning and the like are filtered from the current data, leaving only current high value contacts or new unknowns for investigation. An emphasis on filtering before querying big data would reduce the number of spurious connections simply because a smaller data set has less random data that could be seen as patterns with other data. Not to mention that the smaller the data set, more prior data could be associated with current data without overwhelming the analyst. You may start off with big data but the goal is a very small amount of actionable data.

February 20, 2015

Army Changing How It Does Requirements [How Are Your Big Data Requirements Coming?]

Filed under: BigData,Design,Requirements — Patrick Durusau @ 8:07 pm

Army Changing How It Does Requirements: McMaster by Sydney J. Freedberg Jr.

From the post:


So there’s a difficult balance to strike between the three words that make up “mobile protected firepower.” The vehicle is still just a concept, not a funded program. But past projects like FCS began going wrong right from those first conceptual stages, when TRADOC Systems Managers (TSMs) wrote up the official requirements for performance with little reference to what tradeoffs would be required in terms of real-world engineering. So what is TRADOC doing differently this time?

“We just did an Initial Capability Document [ICD] for ‘mobile protected firepower,’” said McMaster. “When we wrote that document, we brought together 18th Airborne Corps and other [infantry] and Stryker brigade combat team leadership” — i.e. the units that would actually use the vehicle — “who had recent operational experience.”

So they’re getting help — lots and lots of help. In an organization as bureaucratic and tribal as the Army, voluntarily sharing power is a major breakthrough. It’s especially big for TRADOC, which tends to take on priestly airs as guardian of the service’s sacred doctrinal texts. What TRADOC has done is a bit like the Vatican asking the Bishop of Boise to help draft a papal bull.

But that’s hardly all. “We brought together, obviously, the acquisition community, so PEO Ground Combat Vehicle was in on the writing of the requirements. We brought in the Army lab, TARDEC,” McMaster told reporters at a Defense Writers’ Group breakfast this morning. “We brought in Army Materiel Command and the sustainment community to help write it. And then we brought in the Army G-3 [operations and plans] and the Army G-8 [resources]” from the service’s Pentagon staff.

Traditionally, all these organizations play separate and unequal roles in the process. This time, said McMaster, “we wrote the document together.” That’s the model for how TRADOC will write requirements in the future, he went on: “Do it together and collaborate from the beginning.”

It’s important to remember how huge a hole the Army has to climb out of. The 2011 Decker-Wagner report calculated that, since 1996, the Army had wasted from $1 billion to $3 billion annually on two dozen different cancelled programs. The report pointed out an institutional problem much bigger than just the Future Combat System. Indeed, since FCS went down in flames, the Army has cancelled yet another major program, its Ground Combat Vehicle.

As I ask in the headline: How Are Your Big Data Requirements Coming?

Have you gotten all the relevant parties together? Have they all collaborated on making the business case for your use of big data? Or are your requirements written by managers who are divorced from the people to use the resulting application or data? (Think Virtual Case File.)

The Army appears to have gotten the message on requirements, temporarily at least. How about you?

February 16, 2015

Big Data, or Not Big Data: What is <your> question?

Filed under: BigData,Complexity,Data Mining — Patrick Durusau @ 7:55 pm

Big Data, or Not Big Data: What is <your> question? by Pradyumna S. Upadrashta.

From the post:

Before jumping on the Big Data bandwagon, I think it is important to ask the question of whether the problem you have requires much data. That is, I think its important to determine when Big Data is relevant to the problem at hand.

The question of relevancy is important, for two reasons: (i) if the data are irrelevant, you can’t draw appropriate conclusions (collecting more of the wrong data leads absolutely nowhere), (ii) the mismatch between the problem statement, the underlying process of interest, and the data in question is critical to understand if you are going to distill any great truths from your data.

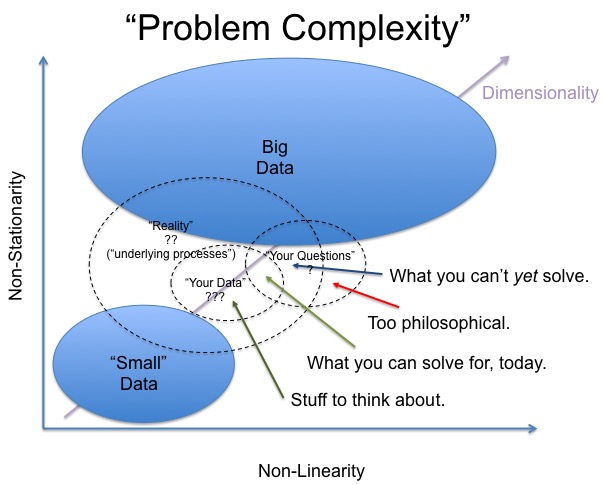
Big Data is relevant when you see some evidence of a non-linear or non-stationary generative process that varies with time (or at least, collection time), on the spectrum of random drift to full blown chaotic behavior. Non-stationary behaviors can arise from complex (often ‘hidden’) interactions within the underlying process generating your observable data. If you observe non-linear relationships, with underlying stationarity, it reduces to a sampling problem. Big Data implicitly becomes relevant when we are dealing with processes embedded in a high dimensional context (i.e., after dimension reduction). For high embedding dimensions, we need more and more well distributed samples to understand the underlying process. For problems where the underlying process is both linear and stationary, we don’t necessarily need much data

bigdata-complexity

Great post and a graphic that is worthy of being turned into a poster! (Pradyumna asks for suggestions on the graphic so you may want to wait a few days to see if it improves. Plus send suggestions if you have them.)

What is <your> question? wasn’t the starting point for: Dell: Big opportunities missed as Big Data remains big business.

The barriers to big data:

While big data has proven marketing benefits, infrastructure costs (35 per cent) and security (35 per cent) tend to be the primary obstacles for implementing big data initiatives.

Delving deeper, respondents believe analytics/operational costs (34 per cent), lack of management support (22 per cent) and lack of technical skills (21 per cent) are additional barriers in big data strategies.

“So where do the troubles with big data stem from?” asks Jones, citing cost (e.g. price of talent, storage, etc.), security concerns, uncertainty in how to leverage data and a lack of in-house expertise.

“In fact, only 36 percent of organisations globally have in-house big data expertise. Yet, the proven benefits of big data analytics should justify the investment – businesses just have to get started.

Do you see What is <your> question? being answered anywhere?

I didn’t, yet the drum beat for big data continues.

I fully agree that big data techniques and big data are important advances and they should be widely adopted and used, but only when they are appropriate to the question at hand.

Otherwise you will be like a non-profit I know that spent upward of $500,000+ on a CMS system that was fundamentally incompatible with their data. Wasn’t designed for document management. Fine system but not appropriate for the task at hand. It was like a sleeping dog in the middle of the office. No matter what you wanted to do, it was hard to avoid the dog.

Certainly could not admit that the purchasing decision was a mistake because those in charge would lose face.

Don’t find yourself in a similar situation with big data.

Unless and until someone produces an intelligible business plan that identifies the data, the proposed analysis of the data and the benefits of the results, along with cost estimates, etc., keep a big distance from big data. Make business ROI based decisions, not cult ones.

I first saw this in a tweet by Kirk Borne.

February 10, 2015

Big Data as statistical masturbation

Filed under: BigData,Marketing — Patrick Durusau @ 5:06 pm

Big Data as statistical masturbation by Rick Searle.

From the post:

It’s just possible that there is a looming crisis in yet another technological sector whose proponents have leaped too far ahead, and too soon, promising all kinds of things they are unable to deliver. It strange how we keep ramming our head into this same damned wall, but this next crisis is perhaps more important than deflated hype at other times, say our over optimism about the timeline for human space flight in the 1970’s, or the “AI winter” in the 1980’s, or the miracles that seemed just at our fingertips when we cracked the Human Genome while pulling riches out of the air during the dotcom boom- both of which brought us to a state of mania in the 1990’s and early 2000’s.

searle

The thing that separates a potentially new crisis in the area of so-called “Big-Data” from these earlier ones is that, literally overnight, we have reconstructed much of our economy, national security infrastructure and in the process of eroding our ancient right privacy on it’s yet to be proven premises. Now, we are on the verge of changing not just the nature of the science upon which we all depend, but nearly every other field of human intellectual endeavor. And we’ve done and are doing this despite the fact that the the most over the top promises of Big Data are about as epistemologically grounded as divining the future by looking at goat entrails.

Well, that might be a little unfair. Big Data is helpful, but the question is helpful for what? A tool, as opposed to a supposedly magical talisman has its limits, and understanding those limits should lead not to our jettisoning the tool of large scale data based analysis, but what needs to be done to make these new capacities actually useful rather than, like all forms of divination, comforting us with the idea that we can know the future and thus somehow exert control over it, when in reality both our foresight and our powers are much more limited.

Start with the issue of the digital economy. One model underlies most of the major Internet giants- Google, FaceBook and to a lesser extent Apple and Amazon, along with a whole set of behemoths who few of us can name but that underlie everything we do online, especially data aggregators such as Axicom. That model is to essentially gather up every last digital record we leave behind, many of them gained in exchange for “free” services and using this living archive to target advertisements at us.

It’s not only that this model has provided the infrastructure for an unprecedented violation of privacy by the security state (more on which below) it’s that there’s no real evidence that it even works.

Ouch! I wonder if Searle means “works” as in satisfies a business goal or objective? Not just work in the sense it doesn’t crash?

That would go a long way to explain the failure of the original Semantic Web vision despite the investment of $billions in its promotion. With the lack of a “works” for some business goal or objective, who cares if it “works” in some other sense?

You need to read Serle in full but one more tidbit to tempt you into doing so:


Here’s the problem with this line of reasoning, a problem that I think is the same, and shares the same solution to the issue of mass surveillance by the NSA and other security agencies. It begins with this idea that “the landscape will become apparent and patterns will naturally emerge.”

The flaw that this reasoning suffers has to do with the way very large data sets work. One would think that the fact that sampling millions of people, which we’re now able to do via ubiquitous monitoring, would offer enormous gains over the way we used to be confined to population samples of only a few thousand, yet this isn’t necessarily the case. The problem is the larger your sample size the greater your chance at false correlations.

Searle does cite Stefan Thurner, which we talked about in Newly Discovered Networks among Different Diseases…, who makes the case that any patterns you discover with big data are the starting point for research, not conclusions to be drawn from big data. Not the same thing.

PS: I do concede that Searle overlooks the non-healthy and incestuous masturbation among and between business management, management consultancies, vendors, and others with regard to big data. Quick or easy answers are never quick, easy, or even satisfying.

I first saw this in a post by Kirk Borne.

February 9, 2015

Working Group on Astroinformatics and Astrostatistics (WGAA)

Filed under: Astroinformatics,BigData — Patrick Durusau @ 7:53 pm

Working Group on Astroinformatics and Astrostatistics (WGAA)

From the webpage:

History: The WG was established at the 220th Meeting, June 2012 in Anchorage in response to a White Paper report submitted to the Astro2010 Decadal Survey.

Members: Any AAS member with an interest in these fields is invited to join.

Steering Committee: ~10 members including the chair; initially appointed by Council and in successive terms, nominated by the Working Group and confirmed by the AAS Council

Term: Three years staggered, with terms beginning and ending at the close of the Annual Summer Meeting. Members may be re-appointed.

Chair: Initially appointed by Council after consultation with the inaugural WG members. In successive terms, nominated by the Working Group; confirmed by the AAS Council.

Charge: The Working Group is charged with developing and spreading awareness of the applications of advanced computer science, statistics and allied branches of applied mathematics to further the goals of astronomical and astrophysical research.

The Working Group may interact with other academic, international, or governmental organizations, as appropriate, to advance the fields of astroinformatics and astrostatistics. It must report to Council annually on its activities, and is encouraged to make suggestions and proposals to the AAS leadership on ways to enhance the utility and visibility of its activities.

Astroinformatics and astronstatistics, modern astronomy in general, doesn’t have small data. All of its data is “Big Data.”

Members of your data team should select not-your-domain groups to monitor for innovations and new big data techniques.

I first saw this in a tweet by Kirk Borne.

PS: Kirk added a link to the paper that resulted in this group: Astroinformatics: A 21st Century Approach to Astronomy.

Warning High-Performance Data Mining and Big Data Analytics Warning

Filed under: BigData,Data Mining — Patrick Durusau @ 7:38 pm

Warning High-Performance Data Mining and Big Data Analytics Warning by Khosrow Hassibi.

Before you order this book, there are three things you need to take into account.

First, the book claims to target eight (8) separate audiences:

Target Audience: This book is intended for a variety of audiences:

(1) There are many people in the technology, science, and business disciplines who are curious to learn about big data analytics in a broad sense, combined with some historical perspective. They may intend to enter the big data market and play a role. For this group, the book provides an overview of many relevant topics. College and high school students who have interest in science and math, and are contemplating about what to pursue as a career, will also find the book helpful.

(2) For the executives, business managers, and sales staff who also have an interest in technology, believe in the importance of analytics, and want to understand big data analytics beyond the buzzwords, this book provides a good overview and a deeper introduction of the relevant topics.

(3) Those in classic organizations—at any vertical and level— who either manage or consume data find this book helpful in grasping the important topics in big data analytics and its potential impact in their
organizations.

(4) Those in IT benefit from this book by learning about the challenges of the data consumers: data miners/scientists, data analysts, and other business users. Often the perspectives of IT and analytics users are different on how data is to be managed and consumed.

(5) Business analysts can learn about the different big data technologies and how it may impact what they do today.

(6) Statisticians typically use a narrow set of statistical tools and usually work on a narrow set of business problems depending on their industry. This book points to many other frontiers in which statisticians can continue to play important roles.

(7) Since the main focus of the book is high-performance data mining and contrasting it with big data analytics in terms of commonalities and differences, data miners and machine learning practitioners gain a holistic view of how the two relate.

(8) Those interested in data science gain from the historical viewpoint of the book since the practice of data science—as opposed to the name itself—has existed for a long time. Big data revolution has significantly helped create awareness about analytics and increased the need for data science professionals.

Second, are you wondering how a book covers that many audiences and that much technology in a little over 300 pages? Review the Table of Contents. See how in depth the coverage appears to be to you.

Third, you do know that Mining of Massive Datasets by Jure Leskovec, Anand Rajaraman, Jeff Ullman, is available for free (electronic copy) and in hard copy from Cambridge University Press. Yes?

Its prerequisites are:

1. An introduction to database systems, covering SQL and related programming systems.

2. A sophomore-level course in data structures, algorithms, and discrete math.

3. A sophomore-level course in software systems, software engineering, and programming languages.

With one audience, satisfying technical prerequisites, Mining Massive Datasets (MMD) runs over five hundred (500) pages.

Up to you but I prefer narrower in depth coverage of topics.

February 8, 2015

The Parable of Google Flu… [big data hubris]

Filed under: Algorithms,BigData — Patrick Durusau @ 7:13 pm

The Parable of Google Flu: Traps in Big Data Analysis by David Lazer, Ryan Kennedy, Gary King, Alessandro Vespignani.

From the article:

In February 2013, Google Flu Trends (GFT) made headlines but not for a reason that Google executives or the creators of the flu tracking system would have hoped. Nature reported that GFT was predicting more than double the proportion of doctor visits for influenza-like illness (ILI) than the Centers for Disease Control and Prevention (CDC), which bases its estimates on surveillance reports from laboratories across the United States (1,2). This happened despite the fact that GFT was built to predict CDC reports. Given that GFT is often held up as an exemplary use of big data (3, 4), what lessons can we drawfrom this error?

The problems we identify are not limited to GFT. Research on whether search or social media can predict x has become commonplace (5-7) and is often put in sharp contrast with traditional methods and hypotheses. Although these studies have shown the value of these data, we are far from a place where they can supplant more traditional methods or theories (8). We explore two issues that contributed to GFT’s mistakes— big data hubris and algorithm dynamics— and offer lessons for moving forward in the big data age.

Highly recommended reading for big data advocates.

Not that I doubt the usefulness of big data, but I do doubt its usefulness in the absence of an analyst who understands the data.

Did you catch the aside about documentation?

There are multiple challenges to replicating GFT’s original algorithm. GFT has never documented the 45 search terms used, and the examples that have been released appear misleading (14) (SM). Google does provide a service, Google Correlate, which allows the user to identify search data that correlate with a given time series; however, it is limited to national level data, whereas GFT was developed using correlations at the regional level (13). The service also fails to return any of the sample search terms reported in GFT-related publications (13,14).

Document your analysis and understanding of data. Or you can appear in a sequel to Google Flu. Not really where I want my name to appear. You?

I first saw this in a tweet by Edward Tufte.

February 6, 2015

Big Data Processing with Apache Spark – Part 1: Introduction

Filed under: BigData,Spark — Patrick Durusau @ 2:45 pm

Big Data Processing with Apache Spark – Part 1: Introduction by Srini Penchikala.

From the post:

What is Spark

Apache Spark is an open source big data processing framework built around speed, ease of use, and sophisticated analytics. It was originally developed in 2009 in UC Berkeley’s AMPLab, and open sourced in 2010 as an Apache project.

Spark has several advantages compared to other big data and MapReduce technologies like Hadoop and Storm.

First of all, Spark gives us a comprehensive, unified framework to manage big data processing requirements with a variety of data sets that are diverse in nature (text data, graph data etc) as well as the source of data (batch v. real-time streaming data).

Spark enables applications in Hadoop clusters to run up to 100 times faster in memory and 10 times faster even when running on disk.

Spark lets you quickly write applications in Java, Scala, or Python. It comes with a built-in set of over 80 high-level operators. And you can use it interactively to query data within the shell.

In addition to Map and Reduce operations, it supports SQL queries, streaming data, machine learning and graph data processing. Developers can use these capabilities stand-alone or combine them to run in a single data pipeline use case.

In this first installment of Apache Spark article series, we’ll look at what Spark is, how it compares with a typical MapReduce solution and how it provides a complete suite of tools for big data processing.

If the rest of this series of posts is as comprehensive as this one, this will be a great overview of Apache Spark! Looking forward to additional posts in this series.

February 2, 2015

Who asks the questions? [Big Data]

Filed under: BigData,Government,Politics — Patrick Durusau @ 7:04 pm

“Who asks the questions?” is a section header in Follow The Data Down The Rabbit Hole by Mark Gazit.

The question of human bias hangs like a shadow over the accuracy and efficiency of big data analytics, and thus the viability of answers obtained thereof. If different humans can look at the same data and come to different conclusions, just how reliable can those deductions be?

There is no question that using data science to extract knowledge from raw data provides tremendous value and opportunity to organizations in any sector, but the way it is analyzed has crucial bearing on that value.

In order to extract meaningful answers from big data, data scientists must decide which questions to ask of the algorithms. However, as long as humans are the ones asking the questions, they will forever introduce unintentional bias into the equation. Furthermore, the data scientists in charge of choosing the queries are often much less equipped to formulate the “right questions” than the organization’s specialized domain experts.

For example, a compliance manager would ask much better questions about her area than a scientist who has no idea what her day-to-day work entails. The same goes for a CISO or the executive in charge of insider threats. Does this mean that your data team will have to involve more people all the time? And what happens if one of those people leaves the company?

Data science is necessary and important, and as data grows, so does the need for experienced data scientists. But at the same time, leaving all the computational work to humans makes it slower, less scientific, and quick to degrade in quality because the human mind cannot keep up with the quantum leap that big data is undergoing. (emphasis added)

I find Big Data hype such as:

But at the same time, leaving all the computational work to humans makes it slower, less scientific, and quick to degrade in quality because the human mind cannot keep up with the quantum leap that big data is undergoing. (emphasis added)

deeply problematic.

The “human mind” is responsible for the creation of “big data” and our biases and assumptions are built into the hardware and software that process it.

Why should that be any different for the questions we ask of “Big Data?” Who is there to pose questions other than the “human mind?” Or to set into motion a framework that asks questions within the parameters of a framework that originated with a “human mind?”

Claims that “…the human mind cannot keep up…” are references to “your” human mind and not the “human maid” of the person making the statement. They are about to claim to have the correct interpretation of some data set. Just as statisticians (or to be fair, people claiming to be statisticians) for years claimed there was no link between smoking and lung cancer.

Claims about the human (your) brain are always made with an agenda. An agenda that puts some “fact,” some policy, some principle beyond being questioned. Identify that “fact,” policy, or principle because it is where their evidence is the weakest, else they would not try to put it beyond question.

January 26, 2015

Humpty-Dumpty on Being Data-Driven

Filed under: BigData,Corporate Data,Enterprise Integration — Patrick Durusau @ 3:50 pm

What’s Hampering Corporate Efforts to be Data-Driven? by Michael Essany.

Michael summarizes a survey from Terradata that reports:

  • 47% of CEOs, or about half, believe that all employees have access to the data they need, while only 27% of other respondents agree.
  • 43% of CEOs think relevant data are captured and made available in real time, as opposed to 29% of other respondents.
  • CEOs are also more likely to think that employees extract relevant insights from data – 38% of them hold this belief, as compared to 24% among other the rest of respondents
  • 53% of CEOs think data utilization has made decision-making less hierarchical and further empowered employees, as compared to only 36% of the employees themselves.
  • 51% of CEOs believe data availability has improved employee engagement, satisfaction and retention, while only 35% of the rest agree.

As marketing literature, Terradata’s survey is targeted at laying the failure to become “data-driven” at the door of CEOs.

But Terradata didn’t ask or Michael did not report the answer to several other relevant questions:

What are the characteristics of a business that can benefit from being “data-driven?” If you are going to promote being “data-driven,” shouldn’t there be data to establish being “data-driven” benefits a business? Real data, not the power point slide hand wavy stuff.

Who signs the check for the enterprise is a more relevant question than the CEOs opinion about “data-driven,” IT in general or global warming.

And as Humpty-Dumpty would say, in a completely different context: “The question is, which is to be master, that’s all!”

I suppose as marketing glam it’s not bad but not all that impressive either. Data-driven marketing should be based on hard data and case studies with references. Upstairs/downstairs differences in perception hardly qualify as hard data.

I first saw this in a tweet by Kirk Borne.

January 1, 2015

MemSQL releases a tool to easily ship big data into its database

Filed under: BigData,Data,Data Pipelines — Patrick Durusau @ 5:43 pm

MemSQL releases a tool to easily ship big data into its database by Jordan Novet.

From the post:

Like other companies pushing databases, San Francisco startup MemSQL wants to solve low-level problems, such as easily importing data from critical sources. Today MemSQL is acting on that impulse by releasing a tool to send data from the S3 storage service on the Amazon Web Services cloud and from the Hadoop open-source file system into its proprietary in-memory SQL database — or the open-source MySQL database.

Engineers can try out the new tool, named MemSQL Loader, today, now that it’s been released under an open-source MIT license.

The existing “LOAD DATA” command in MemSQL and MySQL can bring data in, although it has its shortcomings, as Wayne Song, a software engineer at the startup, wrote in a blog post today. Song and his colleagues ran into those snags and started coding.

How very cool!

Not every database project seeks to “easily import… data from critical sources.” but I am very glad to see MemSQL take up the challenge.

Reducing the friction between data stores and tools will make data pipelines more robust, reducing the amount of time spent trouble shooting routine data traffic issues and increasing the time spend on analysis that fuels your ROI from data science.

True enough, if you want to make ASCII importing a $custom assistance from your staff task, that is one business model. On the whole I would not say it is a very viable one. Particularly with more production minded folks like MemSQL around.

What database are you going to extend MemSQL Loader to support?

December 26, 2014

Big Data – The New Science of Complexity

Filed under: BigData,Philosophy of Science,Science — Patrick Durusau @ 4:17 pm

Big Data – The New Science of Complexity by Wolfgang Pietsch.

Abstract:

Data-intensive techniques, now widely referred to as ‘big data’, allow for novel ways to address complexity in science. I assess their impact on the scientific method. First, big-data science is distinguished from other scientific uses of information technologies, in particular from computer simulations. Then, I sketch the complex and contextual nature of the laws established by data-intensive methods and relate them to a specific concept of causality, thereby dispelling the popular myth that big data is only concerned with correlations. The modeling in data-intensive science is characterized as ‘horizontal’—lacking the hierarchical, nested structure familiar from more conventional approaches. The significance of the transition from hierarchical to horizontal modeling is underlined by a concurrent paradigm shift in statistics from parametric to non-parametric methods.

A serious investigation of the “science” of big data, which I noted was needed in: Underhyped – Big Data as an Advance in the Scientific Method.

From the conclusion:

The knowledge established by big-data methods will consist in a large number of causal laws that generally involve numerous parameters and that are highly context-specific, i.e. instantiated only in a small number of cases. The complexity of these laws and the lack of a hierarchy into which they could be integrated prevent a deeper understanding, while allowing for predictions and interventions. Almost certainly, we will experience the rise of entire sciences that cannot leave the computers and do not fit into textbooks.

This essay and the references therein are a good vantage point from which to observe the development of a new science and its philosophy of science.

December 22, 2014

Underhyped – Big Data as an Advance in the Scientific Method

Filed under: BigData,Science — Patrick Durusau @ 6:26 pm

Underhyped – Big Data as an Advance in the Scientific Method by Yanpei Chen.

From the post:

Big data is underhyped. That’s right. Underhyped. The steady drumbeat of news and press talk about big data only as a transformative technology trend. It is as if big data’s impact goes only as far as creating tremendous commercial value for a selected few vendors and their customers. This view could not be further from the truth.

Big data represents a major advance in the scientific method. Its impact will be felt long after the technology trade press turns its attention to the next wave of buzzwords.

I am fortunate to work at a leading data management vendor as a big data performance specialist. My job requires me to “make things go fast” by observing, understanding, and improving big data systems. Specifically, I am expected to assess whether the insights I find represent solid information or partial knowledge. These processes of “finding out about things”, more formally known as empirical observation, hypothesis testing, and causal analysis, lie at the heart of the scientific method.

My work gives me some perspective on an under-appreciated aspect of big data that I will share in the rest of the article.

Searching for “big data” and “philosophy of science” returns almost 80,000 “hits” today. It is a connection I have not considered and if you know of any survey papers on the literature I would appreciate a pointer.

I enjoyed reading this essay but I don’t consider tracking medical treatment results and managing residential heating costs as examples of the scientific method. Both are examples of observation and analysis that is made easier by big data techniques but they don’t involve testing any hypotheses, prediction, testing, causal analysis.

Big data techniques are useful for such cases. But the use of big data techniques for all the steps of the scientific method, observation, formulation of hypotheses, prediction, testing and casual analysis, would be far more exciting.

Any pointers to use uses?

December 19, 2014

The top 10 Big data and analytics tutorials in 2014

Filed under: Analytics,Artificial Intelligence,BigData — Patrick Durusau @ 4:31 pm

The top 10 Big data and analytics tutorials in 2014 by Sarah Domina.

From the post:

At developerWorks, our Big data and analytics content helps you learn to leverage the tools and technologies to harness and analyze data. Let’s take a look back at the top 10 tutorials from 2014, in no particular order.

There are a couple of IBM product line specific tutorials but the majority of them you will enjoy whether you are an IBM shop or not.

Oddly enough, the post for the top ten (10) in 2014 was made on 26 September 2014.

Either Watson is far better than I have ever imagined or IBM has its own calendar.

In favor of an IBM calendar, I would point out that IBM has its own song.

A flag:

ibm-flag

IBM ranks ahead of Morocco in terms of GDP at $99.751 billion.

Does IBM have its own calendar? Hard to say for sure but I would not doubt it. 😉

December 16, 2014

Apache Spark I & II [Pacific Northwest Scala 2014]

Filed under: BigData,Spark — Patrick Durusau @ 5:49 pm

Apache Spark I: From Scala Collections to Fast Interactive Big Data with Spark by Evan Chan.

Description:

This session introduces you to Spark by starting with something basic: Scala collections and functional data transforms. We then look at how Spark expands the functional collection concept to enable massively distributed, fast computations. The second half of the talk is for those of you who want to know the secrets to make Spark really fly for querying tabular datasets. We will dive into row vs columnar datastores and the facilities that Spark has for enabling interactive data analysis, including Spark SQL and the in-memory columnar cache. Learn why Scala’s functional collections are the best foundation for working with data!

Apache Spark II: Streaming Big Data Analytics with Team Apache, Scala & Akka by Helena Edelson.

Description:

In this talk we will step into Spark over Cassandra with Spark Streaming and Kafka. Then put it in the context of an event-driven Akka application for real-time delivery of meaning at high velocity. We will do this by showing how to easily integrate Apache Spark and Spark Streaming with Apache Cassandra and Apache Kafka using the Spark Cassandra Connector. All within a common use case: working with time-series data, which Cassandra excells at for data locality and speed.

Back to back excellent presentations on Spark!

I need to replace my second monitor (died last week) so I can run the video at full screen with a REPL open!

Enjoy!

December 13, 2014

Hadoop

Filed under: BigData,Hadoop — Patrick Durusau @ 7:40 pm

Hadoop: What it is and how people use it: my own summary by Bob DuCharme.

From the post:

The web offers plenty of introductions to what Hadoop is about. After reading up on it and trying it out a bit, I wanted to see if I could sum up what I see as the main points as concisely as possible. Corrections welcome.

Hadoop is an open source Apache project consisting of several modules. The key ones are the Hadoop Distributed File System (whose acronym is trademarked, apparently) and MapReduce. The HDFS lets you distribute storage across multiple systems and MapReduce lets you distribute processing across multiple systems by performing your “Map” logic on the distributed nodes and then the “Reduce” logic to gather up the results of the map processes on the master node that’s driving it all.

This ability to spread out storage and processing makes it easier to do large-scale processing without requiring large-scale hardware. You can spread the processing across whatever boxes you have lying around or across virtual machines on a cloud platform that you spin up for only as long as you need them. This ability to inexpensively scale up has made Hadoop one of the most popular technologies associated with the buzzphrase “Big Data.”

If you aren’t already familiar with Hadoop or if you are up to your elbows in Hadoop and need a literate summary to forward to others, I think this post does the trick.

Bob covers the major components of the Hadoop ecosystem without getting lost in the weeds.

Recommended reading.

December 12, 2014

Introducing Atlas: Netflix’s Primary Telemetry Platform

Filed under: BigData,Graphs,Visualization — Patrick Durusau @ 5:15 pm

Introducing Atlas: Netflix’s Primary Telemetry Platform

From the post:

Various previous Tech Blog posts have referred to our centralized monitoring system, and we’ve presented at least one talk about it previously. Today, we want to both discuss the platform and ecosystem we built for time-series telemetry and its capabilities and announce the open-sourcing of its underlying foundation.

atlas image

How We Got Here

While working in the datacenter, telemetry was split between an IT-provisioned commercial product and a tool a Netflix engineer wrote that allowed engineers to send in arbitrary time-series data and then query that data. This tool’s flexibility was very attractive to engineers, so it became the primary system of record for time series data. Sadly, even in the datacenter we found that we had significant problems scaling it to about two million distinct time series. Our global expansion, increase in platforms and customers and desire to improve our production systems’ visibility required us to scale much higher, by an order of magnitude (to 20M metrics) or more. In 2012, we started building Atlas, our next-generation monitoring platform. In late 2012, it started being phased into production, with production deployment completed in early 2013.

The use of arbitrary key/value pairs to determine a metrics identity merits a slow read. As does the query language for metrics, said “…to allow arbitrarily complex graph expressions to be encoded in a URL friendly way.”

Posted to Github with a longer introduction here.

The Wikipedia entry on time series offers this synopsis on time series data:

A time series is a sequence of data points, typically consisting of successive measurements made over a time interval. Examples of time series are ocean tides, counts of sunspots, and the daily closing value of the Dow Jones Industrial Average. Time series are very frequently plotted via line charts. Time series are used in statistics, signal processing, pattern recognition, econometrics, mathematical finance, weather forecasting, earthquake prediction, electroencephalography, control engineering, astronomy, communications engineering, and largely in any domain of applied science and engineering which involves temporal measurements.

It looks to me like a number of users communities should be interested in this release from Netflix!

Speaking of series, it occurs to me that is you count the character lengths of blanks in the Senate CIA torture report, you should be able to make some fairly good guesses on some of the names.

I am hopeful it doesn’t come to that because anyone with access to the full 6,000 page uncensored report has a moral obligation to post it to public servers. Surely there is one person with access to that report with a moral conscience.

I first saw this in a tweet by Roy Rapoport

December 6, 2014

The Caltech-JPL Summer School on Big Data Analytics

Filed under: BigData,CS Lectures — Patrick Durusau @ 8:04 am

The Caltech-JPL Summer School on Big Data Analytics

From the webpage:

This is not a class as it is commonly understood; it is the set of materials from a summer school offered by Caltech and JPL, in the sense used by most scientists: an intensive period of learning of some advanced topics, not on an introductory level.

The school will cover a variety of topics, with a focus on practical computing applications in research: the skills needed for a computational (“big data”) science, not computer science. The specific focus will be on applications in astrophysics, earth science (e.g., climate science) and other areas of space science, but with an emphasis on the general tools, methods, and skills that would apply across other domains as well. It is aimed at an audience of practicing researchers who already have a strong background in computation and data analysis. The lecturers include computational science and technology experts from Caltech and JPL.

Students can evaluate their own progress, but there will be no tests, exams, and no formal credit or certificates will be offered.

Syllabus:

  1. Introduction to the school. Software architectures. Introduction to Machine Learning.
  2. Best programming practices. Information retrieval.
  3. Introduction to R. Markov Chain Monte Carlo.
  4. Statistical resampling and inference.
  5. Databases.
  6. Data visualization.
  7. Clustering and classification.
  8. Decision trees and random forests.
  9. Dimensionality reduction. Closing remarks.

If this sounds challenging, imagine doing it in nine (9) days!

The real advantage of intensive courses is you are not trying to juggle work/study/eldercare and other duties while taking the course. That alone may account for some of the benefits of intensive courses, the opportunity to focus on one task and that task alone.

I first saw this in a tweet by Gregory Piatetsky.

December 5, 2014

Databricks to run two massive online courses on Apache Spark

Filed under: BigData,Spark — Patrick Durusau @ 8:06 pm

Databricks to run two massive online courses on Apache Spark by Ameet Talwalkar and Anthony Joseph.

From the post:

In the age of ‘Big Data,’ with datasets rapidly growing in size and complexity and cloud computing becoming more pervasive, data science techniques are fast becoming core components of large-scale data processing pipelines.

Apache Spark offers analysts and engineers a powerful tool for building these pipelines, and learning to build such pipelines will soon be a lot easier. Databricks is excited to be working with professors from University of California Berkeley and University of California Los Angeles to produce two new upcoming Massive Open Online Courses (MOOCs). Both courses will be freely available on the edX MOOC platform in spring 2015. edX Verified Certificates are also available for a fee.

The first course, called Introduction to Big Data with Apache Spark, will teach students about Apache Spark and performing data analysis. Students will learn how to apply data science techniques using parallel programming in Spark to explore big (and small) data. The course will include hands-on programming exercises including Log Mining, Textual Entity Recognition, Collaborative Filtering that teach students how to manipulate data sets using parallel processing with PySpark (part of Apache Spark). The course is also designed to help prepare students for taking the Spark Certified Developer exam. The course is being taught by Anthony Joseph, a professor at UC Berkeley and technical advisor at Databricks, and will start on February 23rd, 2015.

The second course, called Scalable Machine Learning, introduces the underlying statistical and algorithmic principles required to develop scalable machine learning pipelines, and provides hands-on experience using PySpark. It presents an integrated view of data processing by highlighting the various components of these pipelines, including exploratory data analysis, feature extraction, supervised learning, and model evaluation. Students will use Spark to implement scalable algorithms for fundamental statistical models while tackling real-world problems from various domains. The course is being taught by Ameet Talwalkar, an assistant professor at UCLA and technical advisor at Databricks, and will start on April 14th, 2015.

2015 is going to be here before you know it! Time to start practicing with Spark in a sandbox or a local machine is now.

Looking forward to 2015!

Big Data Spain 2014

Filed under: BigData,Conferences — Patrick Durusau @ 7:35 pm

Big Data Spain 2014

Thirty-five videos, nineteen hours of content for a conference on November 17-18, 2014.

Very impressive content!

Since big data has started worrying about what data represents (think subject identity), I am tempted to start keeping closer track on videos for big data.

I really hate searching on a big data topic and getting the usual morass of results that date over a three to four year span, if you are lucky.

Is that a problem for you?

November 30, 2014

BigBench: Toward An Industry-Standard Benchmark for Big Data Analytics

Filed under: Benchmarks,BigData — Patrick Durusau @ 1:26 pm

BigBench: Toward An Industry-Standard Benchmark for Big Data Analytics by Bhaskar D Gowda and Nishkam Ravi.

From the post:

Benchmarking Big Data systems is an open problem. To address this concern, numerous hardware and software vendors are working together to create a comprehensive end-to-end big data benchmark suite called BigBench. BigBench builds upon and borrows elements from existing benchmarking efforts in the Big Data space (such as YCSB, TPC-xHS, GridMix, PigMix, HiBench, Big Data Benchmark, and TPC-DS). Intel and Cloudera, along with other industry partners, are working to define and implement extensions to BigBench 1.0. (A TPC proposal for BigBench 2.0 is in the works.)

BigBench Overview

BigBench is a specification-based benchmark with an open-source reference implementation kit, which sets it apart from its predecessors. As a specification-based benchmark, it would be technology-agnostic and provide the necessary formalism and flexibility to support multiple implementations. As a “kit”, it would lower the barrier of entry to benchmarking by providing a readily available reference implementation as a starting point. As open source, it would allow multiple implementations to co-exist in one place and be reused by different vendors, while providing consistency where expected for the ability to provide meaningful comparisons.

The BigBench specification comprises two key components: a data model specification, and a workload/query specification. The structured part of the BigBench data model is adopted from the TPC-DS data model depicting a product retailer, which sells products to customers via physical and online stores. BigBench’s schema uses the data of the store and web sales distribution channel and augments it with semi-structured and unstructured data as shown in Figure 1.

big bench figure 1

Figure 1: BigBench data model specification

The data model specification is implemented by a data generator, which is based on an extension of PDGF. Plugins for PDGF enable data generation for an arbitrary schema. Using the BigBench plugin, data can be generated for all three pats of the schema: structured, semi-structured and unstructured.

BigBench 1.0 workload specification consists of 30 queries/workloads. Ten of these queries have been taken from the TPC-DS workload and run against the structured part of the schema. The remaining 20 were adapted from a McKinsey report on Big Data use cases and opportunities. Seven of these run against the semi-structured portion and five run against the unstructured portion of the schema. The reference implementation of the workload specification is available here.

BigBench 1.0 specification includes a set of metrics (focused around execution time calculation) and multiple execution modes. The metrics can be reported for the end-to-end execution pipeline as well as each individual workload/query. The benchmark also defines a model for submitting concurrent workload streams in parallel, which can be extended to simulate the multi-user scenario.

The post continues with plans for BigBench 2.0 and Intel tests using BigBench 1.0 against various hardware configurations.

An important effort and very much worth your time to monitor.

None other than the Open Data Institute and Thomson Reuters have found that identifiers are critical to bringing value to data. With that realization and the need to map between different identifiers, there is an opportunity for identifier benchmarks in BigData. Identifiers that have documented semantics and the ability to merge with other identifiers.

A benchmark for BigData identifiers would achieve two very important goals:

First, it would give potential users a rough gauge of the amount of effort required to reach some X goal of identifiers. The cost of identifiers will vary for data set to data set but having no cost information at all, leaves potential users to expect the worst.

Second, as with the BigBench benchmark, potential users could compare apples to apples in judging the performance and characteristics of identifier schemes (such as topic map merging).

Both of those goals seem like worthy ones to me.

You?

November 17, 2014

This is your Brain on Big Data: A Review of “The Organized Mind”

This is your Brain on Big Data: A Review of “The Organized Mind” by Stephen Few.

From the post:

In the past few years, several fine books have been written by neuroscientists. In this blog I’ve reviewed those that are most useful and placed Daniel Kahneman’s Thinking, Fast & Slow at the top of the heap. I’ve now found its worthy companion: The Organized Mind: Thinking Straight in the Age of Information Overload.

the organized mind - book cover

This new book by Daniel J. Levitin explains how our brains have evolved to process information and he applies this knowledge to several of the most important realms of life: our homes, our social connections, our time, our businesses, our decisions, and the education of our children. Knowing how our minds manage attention and memory, especially their limitations and the ways that we can offload and organize information to work around these limitations, is essential for anyone who works with data.

See Stephen’s review for an excerpt from the introduction and summary comments on the work as a whole.

I am particularly looking forward to reading Levitin’s take on the transfer of information tasks to us and the resulting cognitive overload.

I don’t have the volume, yet, but it occurs to me that the shift from indexes (Readers Guide to Periodical Literature and the like) and librarians to full text search engines, is yet another example of the transfer of information tasks to us.

Indexers and librarians do a better job of finding information than we do because discovery of information is a difficult intellectual task. Well, perhaps, discovering relevant and useful information is a difficult task. Almost without exception, every search produces a result on major search engines. Perhaps not a useful result but a result none the less.

Using indexers and librarians will produce a line item in someone’s budget. What is needed is research on the differential between the results from indexer/librarians versus us and what that translates to as a line item in enterprise budgets.

That type of research could influence university, government and corporate budgets as the information age moves into high gear.

The Organized Mind by Daniel J. Levitin is a must have for the holiday wish list!

« Newer PostsOlder Posts »

Powered by WordPress