Another Word For It Patrick Durusau on Topic Maps and Semantic Diversity

September 13, 2015

Posts from 140 #DataScience Blogs

Filed under: BigData,Curation — Patrick Durusau @ 8:30 pm

Kirk Borne posted a link to:

http://dsguide.biz/reader/, referring to it as:

Recent posts from 150+ #DataScience Blogs worldwide, curated by @dsguidebiz http://dsguide.biz/reader/ #BigData #Analytics

By count of the sources listed on http://dsguide.biz/reader/sources, the number of sources is 140, as of September 13, 2015.

A wealth of posts and videos!

Everyone who takes advantage of this listing, however, will have to go through the same lists of posts by category.

That repetition, even with searching, seems like a giant time sink to me.

You?

September 12, 2015

Big Data Never Sleeps 3.0

Filed under: BigData,Programming — Patrick Durusau @ 7:37 pm

Kirk Borne posted this to twitter:

big-data-never-sleeps

Now, ask yourself how much of that data is relevant to any query you made yesterday? Or within the last week?

There are some legitimately large data sets, genomic, astronomical, oceanography, Large Hadron collider data and so many more.

The analysis of some big data sets require the processing of the entire data set but even with the largest data sets, say astronomical data sets, you may only be interested in a small portion of data for heavy analysis.

The overall amount of data keeps increasing to be sure, making the skill of selecting the right data for analysis all the more important.

The size of your data set matters far less than the importance of your results.

Let’s see a list in 2016 of the most important results from data analysis, skipping the size of the data sets as a qualifier.

September 11, 2015

Statistical Analysis Model Catalogs the Universe

Filed under: Astroinformatics,BigData — Patrick Durusau @ 7:26 pm

Statistical Analysis Model Catalogs the Universe by Kathy Kincade.

From the post:

The roots of tradition run deep in astronomy. From Galileo and Copernicus to Hubble and Hawking, scientists and philosophers have been pondering the mysteries of the universe for centuries, scanning the sky with methods and models that, for the most part, haven’t changed much until the last two decades.

Now a Berkeley Lab-based research collaboration of astrophysicists, statisticians and computer scientists is looking to shake things up with Celeste, a new statistical analysis model designed to enhance one of modern astronomy’s most time-tested tools: sky surveys.

A central component of an astronomer’s daily activities, surveys are used to map and catalog regions of the sky, fuel statistical studies of large numbers of objects and enable interesting or rare objects to be studied in greater detail. But the ways in which image datasets from these surveys are analyzed today remains stuck in, well, the Dark Ages.

“There are very traditional approaches to doing astronomical surveys that date back to the photographic plate,” said David Schlegel, an astrophysicist at Lawrence Berkeley National Laboratory and principal investigator on the Baryon Oscillation Spectroscopic Survey (BOSS, part of SDSS) and co-PI on the DECam Legacy Survey (DECaLS). “A lot of the terminology dates back to that as well. For example, we still talk about having a plate and comparing plates, when obviously we’ve moved way beyond that.”

Surprisingly, the first electronic survey — the Sloan Digital Sky Survey (SDSS) — only began capturing data in 1998. And while today there are multiple surveys and high-resolution instrumentation operating 24/7 worldwide and collecting hundreds of terabytes of image data annually, the ability of scientists from multiple facilities to easily access and share this data remains elusive. In addition, practices originating a hundred years ago or more continue to proliferate in astronomy — from the habit of approaching each survey image analysis as though it were the first time they’ve looked at the sky to antiquated terminology such as “magnitude system” and “sexagesimal” that can leave potential collaborators outside of astronomy scratching their heads.

It’s conventions like these in a field he loves that frustrate Schlegel.

Does 500 terabytes strike you as “big data?”

The Celeste project described by Kathy in her post and in greater detail in: Celeste: Variational inference for a generative model of astronomical images by Jeff Regier, et al., is an attempt to change how optical telescope image sets are thought about and processed. It’s initial project, sky surveys, will involve 500 terabytes of data.

Given the wealth of historical astronomical terminology, such as magnitude, the opportunities for mapping to new techniques and terminologies will abound. (Think topic maps.)

August 25, 2015

Looking for Big Data? Look Up!

Filed under: Astroinformatics,BigData,Science — Patrick Durusau @ 5:02 pm

Gaia’s first year of scientific observations

From the post:

After launch on 19 December 2013 and a six-month long in-orbit commissioning period, the satellite started routine scientific operations on 25 July 2014. Located at the Lagrange point L2, 1.5 million km from Earth, Gaia surveys stars and many other astronomical objects as it spins, observing circular swathes of the sky. By repeatedly measuring the positions of the stars with extraordinary accuracy, Gaia can tease out their distances and motions through the Milky Way galaxy.

For the first 28 days, Gaia operated in a special scanning mode that sampled great circles on the sky, but always including the ecliptic poles. This meant that the satellite observed the stars in those regions many times, providing an invaluable database for Gaia’s initial calibration.

At the end of that phase, on 21 August, Gaia commenced its main survey operation, employing a scanning law designed to achieve the best possible coverage of the whole sky.

Since the start of its routine phase, the satellite recorded 272 billion positional or astrometric measurements, 54.4 billion brightness or photometric data points, and 5.4 billion spectra.

The Gaia team have spent a busy year processing and analysing these data, en route towards the development of Gaia’s main scientific products, consisting of enormous public catalogues of the positions, distances, motions and other properties of more than a billion stars. Because of the immense volumes of data and their complex nature, this requires a huge effort from expert scientists and software developers distributed across Europe, combined in Gaia’s Data Processing and Analysis Consortium (DPAC).

In case you missed it:

Since the start of its routine phase, the satellite recorded 272 billion positional or astrometric measurements, 54.4 billion brightness or photometric data points, and 5.4 billion spectra.

It sounds like big data. Yes? 😉

Public release of the data is pending. Check back at the Gaia homepage for the latest news.

August 22, 2015

100 open source Big Data architecture papers for data professionals

Filed under: BigData — Patrick Durusau @ 7:41 pm

100 open source Big Data architecture papers for data professionals by Anil Madan.

From the post:

Big Data technology has been extremely disruptive with open source playing a dominant role in shaping its evolution. While on one hand it has been disruptive, on the other it has led to a complex ecosystem where new frameworks, libraries and tools are being released pretty much every day, creating confusion as technologists struggle and grapple with the deluge.

If you are a Big Data enthusiast or a technologist ramping up (or scratching your head), it is important to spend some serious time deeply understanding the architecture of key systems to appreciate its evolution. Understanding the architectural components and subtleties would also help you choose and apply the appropriate technology for your use case. In my journey over the last few years, some literature has helped me become a better educated data professional. My goal here is to not only share the literature but consequently also use the opportunity to put some sanity into the labyrinth of open source systems.

One caution, most of the reference literature included is hugely skewed towards deep architecture overview (in most cases original research papers) than simply provide you with basic overview. I firmly believe that deep dive will fundamentally help you understand the nuances, though would not provide you with any shortcuts, if you want to get a quick basic overview.

Jumping right in…

You will have a great background in Big Data if you read all one hundred (100) papers.

What you will be missing is an overview that ties the many concepts and terms together into a coherent narrative.

Perhaps after reading all 100 papers, you will start over to map the terms and concepts one to the other.

That would both useful and controversial within the field of Big Data!

Enjoy!

I first saw this in a tweet by Kirk Borne.

July 21, 2015

Get Smarter About Apache Spark

Filed under: BigData,Spark — Patrick Durusau @ 4:48 pm

Get Smarter About Apache Spark by Luis Arellano.

From the post:

We often forget how new Spark is. While it was invented much earlier, Apache Spark only became a top-level Apache project in February 2014 (generally indicating it’s ready for anyone to use), which is just 18 months ago. I might have a toothbrush that is older than Apache Spark!

Since then, Spark has generated tremendous interest because the new data processing platforms scales so well, is high performance (up to 100 times faster than alternatives), and is more flexible than other alternatives, both open source and commercial. (If you’re interested, see the trends on both Google searches and Indeed job postings.)

Spark gives the Data Scientist, Business Analyst, and Developer a new platform to manage data and build services as it provides the ability to compute in real-time via in-memory processing. The project is extremely active with ongoing development, and has serious investment from IBM and key players in Silicon Valley.

Luis has collected up links for absolute beginners, understanding the basics, intermediate learning and finally reaching the expert level.

None of the lists are overwhelming so give them a try.

July 15, 2015

Clojure At Scale @WalmartLabs

Filed under: BigData,Clojure,Functional Programming — Patrick Durusau @ 3:41 pm

From the description:

There are many resources to help you build Clojure applications. Most however use trivial examples that rarely span more than one project. What if you need to build a big clojure application comprising many projects? Over the three years that we’ve been using Clojure at WalmartLabs, we’ve had to figure this stuff out. In this session, I’ll discuss some of the challenges we’ve faced scaling our team and code base as well as our experience using Clojure in the enterprise.

I first saw this mentioned by Marc Phillips in a post titled: Walmart Runs Clojure At Scale. Marc mentions a tweet from Anthony Marcar that reads:

Our Clojure system just handled its first Walmart black Friday and came out without a scratch.

Black Friday,” is the Friday after the Thanksgiving holiday in the United States. Since 2005, it has been the busiest shopping day of the year and in 2014, $50.9 billion was spend on that one day. (Yes, billions with a “b.”)

Great narrative of issues encountered as this system was built to scale.

June 28, 2015

More Analytics Needed in Cyberdefense: [The first step towards cybersecurity is…]

Filed under: BigData,Cybersecurity,Security — Patrick Durusau @ 6:29 pm

More Analytics Needed in Cyberdefense by David Stegon.

Before you credit this report too much, consider the following points:

Crunching the Survey Numbers

MeriTalk, on behalf of Splunk, conducted an online survey of 150 Federal and 152 State and Local cyber security pros in March 2015. The report has a margin of error of ±5.6% at a 95% confidence level. (slide 15)

Federal Computer Week has 80,057 subscribers and approximately 21% of them are Senior IT Management. Federal Computer Week (FCW)

That’s 16,812 of the subscriber total and MeriTalk captured opinions from 150 “cyber security pros.”

Roughly that means that MeriTalk obtained opinions from the equivalent of 0.009% of the senior IT management subscribers to Federal Computer Week.

A survey of less than 0.009% of cyber security pros doesn’t fill me with confidence about these survey “results.”

Big Data analytics for Cyberdefense

In addition to being a tiny portion of “cyber security pros,” you have to wonder what “big data” the respondents thought would be analyzed?

OPM wasn’t running any logging on its servers! (The Absence of Proof Against China on OPM Hacks)

Care to wager that other federal agencies and contractors are not running logging on their networks? I didn’t think so.

Big data techniques, properly understood and applied can lead to valuable insights for cybersecurity. But note the qualifiers, “properly understood and applied…”

The first step towards cybersecurity is recognizing when vendors are taking your money and not improving your IT security.

June 2, 2015

Data Science on Spark

Filed under: BigData,Machine Learning,Spark — Patrick Durusau @ 2:43 pm

Databricks Launches MOOC: Data Science on Spark by Ameet Talwalkar and Anthony Joseph.

From the post:

For the past several months, we have been working in collaboration with professors from the University of California Berkeley and University of California Los Angeles to produce two freely available Massive Open Online Courses (MOOCs). We are proud to announce that both MOOCs will launch in June on the edX platform!

The first course, called Introduction to Big Data with Apache Spark, begins today [June 1, 2015] and teaches students about Apache Spark and performing data analysis. The second course, called Scalable Machine Learning, will begin on June 29th and will introduce the underlying statistical and algorithmic principles required to develop scalable machine learning pipelines, and provides hands-on experience using Spark. Both courses will be freely available on the edX MOOC platform, and edX Verified Certificates are also available for a fee.

Both courses are available for free on the edX website, and you can sign up for them today:

  1. Introduction to Big Data with Apache Spark
  2. Scalable Machine Learning

It is our mission to enable data scientists and engineers around the world to leverage the power of Big Data, and an important part of this mission is to educate the next generation.

If you believe in the wisdom of crowds, some 80K enrolled students as of yesterday.

So, what are you waiting for?

😉

June 1, 2015

Architectural Patterns for Near Real-Time Data Processing with Apache Hadoop

Filed under: Architecture,BigData,Data Streams,Hadoop — Patrick Durusau @ 1:35 pm

Architectural Patterns for Near Real-Time Data Processing with Apache Hadoop by Ted Malaska.

From the post:

Evaluating which streaming architectural pattern is the best match to your use case is a precondition for a successful production deployment.

The Apache Hadoop ecosystem has become a preferred platform for enterprises seeking to process and understand large-scale data in real time. Technologies like Apache Kafka, Apache Flume, Apache Spark, Apache Storm, and Apache Samza are increasingly pushing the envelope on what is possible. It is often tempting to bucket large-scale streaming use cases together but in reality they tend to break down into a few different architectural patterns, with different components of the ecosystem better suited for different problems.

In this post, I will outline the four major streaming patterns that we have encountered with customers running enterprise data hubs in production, and explain how to implement those patterns architecturally on Hadoop.

Streaming Patterns

The four basic streaming patterns (often used in tandem) are:

  • Stream ingestion: Involves low-latency persisting of events to HDFS, Apache HBase, and Apache Solr.
  • Near Real-Time (NRT) Event Processing with External Context: Takes actions like alerting, flagging, transforming, and filtering of events as they arrive. Actions might be taken based on sophisticated criteria, such as anomaly detection models. Common use cases, such as NRT fraud detection and recommendation, often demand low latencies under 100 milliseconds.
  • NRT Event Partitioned Processing: Similar to NRT event processing, but deriving benefits from partitioning the data—like storing more relevant external information in memory. This pattern also requires processing latencies under 100 milliseconds.
  • Complex Topology for Aggregations or ML: The holy grail of stream processing: gets real-time answers from data with a complex and flexible set of operations. Here, because results often depend on windowed computations and require more active data, the focus shifts from ultra-low latency to functionality and accuracy.

In the following sections, we’ll get into recommended ways for implementing such patterns in a tested, proven, and maintainable way.

Great post on patterns for near real-time data processing.

What I have always wondered about is how much of a use case is there for “near real-time processing” of data? If human decision makers are in the loop, that is outside of ecommerce and algorithmic trading, what is the value-add of “near real-time processing” of data?

For example, Kai Wähner in Real-Time Stream Processing as Game Changer in a Big Data World with Hadoop and Data Warehouse gives the following as common use cases for “near real-time processing” of data”

  • Network monitoring
  • Intelligence and surveillance
  • Risk management
  • E-commerce
  • Fraud detection
  • Smart order routing
  • Transaction cost analysis
  • Pricing and analytics
  • Market data management
  • Algorithmic trading
  • Data warehouse augmentation

Ecommerce, smart order routing, algorithmic trading all fall into the category of no human involved so those may need real-time processing.

But take network monitoring for example. From the news reports I understand that hackers had free run of the Sony network for months. I suppose you must have network monitoring at all before real-time network monitoring would be useful at all.

I would probe to make sure that “real-time” was necessary for the use cases at hand before simply assuming it. In smaller organizations, access to data and “real-time” results are more often a symptom of control issues as opposed to any actual use case for the data.

May 14, 2015

Where Big Data Projects Fail

Filed under: BigData,Project Management — Patrick Durusau @ 10:00 am

Where Big Data Projects Fail by Bernard Marr.

From the post:

Over the past 6 months I have seen the number of big data projects go up significantly and most of the companies I work with are planning to increase their Big Data activities even further over the next 12 months. Many of these initiatives come with high expectations but big data projects are far from fool-proof. In fact, I predict that half of all big data projects will fail to deliver against their expectations.

Failure can happen for many reasons, however there are a few glaring dangers that will cause any big data project to crash and burn. Based on my experience working with companies and organizations of all shapes and sizes, I know these errors are all too frequent. One thing they have in common is they are all caused by a lack of adequate planning.

(emphasis added)

To whet your appetite for the examples Marr uses, here are the main problems he identifies:

  • Not starting with clear business objectives
  • Not making a good business case
  • Management Failure
  • Poor communication
  • Not having the right skills for the job

Marr’s post should be mandatory reading at the start of every proposed big data project. And after reading it, the project team should prepare a detailed statement of the business objectives and the business case, along with how it will be determined the business objectives will be measured.

Or to put it differently, no big data project should start without the ability to judge its success or failure.

May 9, 2015

David Smith Slays Big Data Straw Person

Filed under: BigData,Business Intelligence — Patrick Durusau @ 4:36 pm

The Business Economics And Opportunity Of Open-Source Data Science by David Smith.

David sets out to slay the big data myth that: “It’s largely hype, with little practical business value.”

Saying:

The second myth, that big data is hype with no clear economic benefits, is also easy to disprove. The fastest-growing sectors of the global economy are enabled by big data technologies. Mobile and social services would be impossible today without big data fueled by open-source software. (Google’s search and advertising businesses were built on top of data science applications running on open-source software.)

You may have read on my blog earlier today, Slicing and Dicing Users – Google Style, which details how Google has built that search and advertising business. If rights to privacy don’t trouble you, Google’s business models beckons.

David is right that the straw person myth he erected, that big data is “…largely hype, with little practical business value,” is certainly a myth.

In his haste to slay that straw person, David overlooks is the repeated hype — there is value in big data. That is incorrect.

You can create value, lots of it, from big data, but that isn’t the same thing. Creating value from big data requires appropriate big data, technical expertise, a clear business plan for a product or service, marketing, all the things that any business requires.

The current hype about “…there is value in big data” reminds me of the header for lottery by the Virginia Company:

virginia-header

True enough, Virginia is quite valuable now and has been for some time. However, there was no gold on the ground to be gathered by the sack full and big data isn’t any different.

Value can and will be extracted from big data, but only by hard work and sound business plans.

Ask yourself, would you invest in a big data project proposed by this person?

john-smith

[Images are from: The Project Gutenberg EBook of The Virginia Company Of London, 1606-1624, by Wesley Frank Craven.]

PS: The vast majority of the time I deeply enjoy David Smith‘s posts but I do tire of seeing “there is value in big data” as a religious mantra at every turn. A number of investors are only going to hear “there is value in big data” and not stop to ask why or how? We all suffer when technology bubbles burst. Best not to build them at all.

May 6, 2015

Expand Your Big Data Capabilities With Unstructured Text Analytics

Filed under: BigData,Text Analytics,Unstructured Data — Patrick Durusau @ 7:58 pm

Expand Your Big Data Capabilities With Unstructured Text Analytics by Boris Evelson.

From the post:

Beware of insights! Real danger lurks behind the promise of big data to bring more data to more people faster, better and cheaper. Insights are only as good as how people interpret the information presented to them.

When looking at a stock chart, you can’t even answer the simplest question — “Is the latest stock price move good or bad for my portfolio?” — without understanding the context: Where you are in your investment journey and whether you’re looking to buy or sell.

While structured data can provide some context — like checkboxes indicating your income range, investment experience, investment objectives, and risk tolerance levels — unstructured data sources contain several orders of magnitude more context.

An email exchange with a financial advisor indicating your experience with a particular investment vehicle, news articles about the market segment heavily represented in your portfolio, and social media posts about companies in which you’ve invested or plan to invest can all generate much broader and deeper context to better inform your decision to buy or sell.

A thumbnail sketch of the complexity of extracting value from unstructured data sources. As such a sketch, there isn’t much detail but perhaps enough to avoid paying $2495 for the full report.

April 28, 2015

Present and Future of Big Data

Filed under: BigData — Patrick Durusau @ 6:57 pm

I thought you might find this amusing as a poster for your office.

Someday your grandchildren will find it similar to “The World of Tomorrow” at the 1939 World’s Fair.

Infographic: Big Data, present and future

April 12, 2015

US, Chile to ‘officially’ kick off LSST construction

Filed under: Astroinformatics,BigData — Patrick Durusau @ 5:01 pm

US, Chile to ‘officially’ kick off LSST construction

From the post:

From distant exploding supernovae and nearby asteroids to the mysteries of dark matter, the Large Synoptic Survey Telescope (LSST) promises to survey the night skies and provide data to solve the universe’s biggest mysteries. On April 14, news media are invited to join the U.S. National Science Foundation (NSF), the U.S. Department of Energy (DoE) and other public-private partners as they gather outside La Serena, Chile, to “officially” launch LSST’s construction in a traditional Chilean stone-laying ceremony.

LSST is an 8.4-meter, wide-field survey telescope that will image the entire visible sky a few times a week for 10 years. It is located in Cerro Pachón, a mountain peak in northern Chile, chosen for its clear air, low levels of light pollution and dry climate. Using a 3-billion pixel camera–the largest digital camera in the world–and a unique three-mirror construction, it will allow scientists to see a vast swath of sky, previously impervious to study.

The compact construction of LSST will enable rapid movement, allowing the camera to observe fleeting, rare astronomical events. It will detect and catalogue billions of objects in the universe, monitoring them over time and will provide this data–more than 30 terabytes each night–to astronomers, astrophysicists and the interested public around the world. Additionally, the digital camera will shed light on dark energy, which scientists have determined is accelerating the universe’s expansion. It will probe further into the mystery of dark energy, creating a unique dataset of billions of galaxies.

It’s not coming online tomorrow, first light in 2019 and full operation in 2022, but its not too early to start thinking about how to process such a flood of data. Astronomers have been working on those issues for some time so if you are looking for new ways to think about processing data, don’t forget to check with the astronomy department.

Even by today’s standards, thirty (30) terabytes of data a night is a lot of data.

Enjoy!

NIST Big Data interoperability Framework (Comments Wanted!)

Filed under: BigData,NIST — Patrick Durusau @ 3:49 pm

NIST Big Data interoperability Framework

The NIST Big Data Public Working Group (NBD-PWG) is seeking your comments on drafts of its first seven (7) deliverables. Comments are due by May 21, 2015.

NIST Big Data Definitions & Taxonomies Subgroup
1. M0392: Draft SP 1500-1 — Volume 1: Definitions
2. M0393: Draft SP 1500-2 — Volume 2: Taxonomies

NIST Big Data Use Case & Requirements Subgroup
3. M0394: Draft SP 1500-3 — Volume 3: Use Case & Requirements (See Use Cases Lising)

NIST Big Data Security & Privacy Subgroup
4. M0395: Draft SP 1500-4 — Volume 4: Security and Privacy

NIST Big Data Reference Architecture Subgroup
5. M0396: Draft SP 1500-5 — Volume 5: Architectures White Paper Survey
6. M0397: Draft SP 1500-6 — Volume 6: Reference Architecture

NIST Big Data Technology Roadmap Subgroup
7. M0398: Draft SP 1500-7 — Volume 7: Standards Roadmap

You can participate too:

Big Data professionals continue to be welcome to join the NBD-PWG to help craft the work contained in the volumes of the NIST Big Data Interoperability Framework. Please register to join our effort.

See the webpage for details on submitting comments. Or contact me if you want assistance in preparing and submitting comments.

April 9, 2015

Big Data To Identify Rogue Employees (Who To Throw Under The Bus)

Filed under: BigData,Prediction,Predictive Analytics — Patrick Durusau @ 3:23 pm

Big Data Algorithm Identifies Rogue Employees by Hugh Son.

From the post:

Wall Street traders are already threatened by computers that can do their jobs faster and cheaper. Now the humans of finance have something else to worry about: Algorithms that make sure they behave.

JPMorgan Chase & Co., which has racked up more than $36 billion in legal bills since the financial crisis, is rolling out a program to identify rogue employees before they go astray, according to Sally Dewar, head of regulatory affairs for Europe, who’s overseeing the effort. Dozens of inputs, including whether workers skip compliance classes, violate personal trading rules or breach market-risk limits, will be fed into the software.

“It’s very difficult for a business head to take what could be hundreds of data points and start to draw any themes about a particular desk or trader,” Dewar, 46, said last month in an interview. “The idea is to refine those data points to help predict patterns of behavior.”

Sounds worthwhile until you realize that $36 billion in legal bills “since the financial crisis” covers a period of seven (7) years, which works out to be about $5 billion per year. Considering that net revenue for 2014 was $21.8 billion, after deducting legal bills, they aren’t doing too badly. 2014 Annual Report

Hugh raises the specter of The Minority Report in terms of predicting future human behavior. True enough but much more likely to discover cues that resulted in prior regulatory notice with cautions to employees to avoid those “tells.” If the trainer reviews three (3) real JPMorgan Chase cases and all of them involve note taking and cell phone records (later traced), how bright do you have to be to get clued in?

People who don’t get clued in will either be thrown under the bus during the next legal crisis or won’t be employed at JPMorgan Chase.

If this were really a question of predicting human behavior the usual concerns about fairness, etc. would obtain. I suspect it is simply churn so that JPMorgan Chase appears to be taking corrective action. Some low level players will be outed, like the Walter Mitty terrorists the FBI keeps capturing in its web of informants. (I am mining some data now to collect those cases for a future post.)

It will be interesting to see if Jamie Dimon electronic trail is included as part of the big data monitoring of employees. Bets anyone?

April 8, 2015

Drawing Causal Inference from Big Data

Filed under: BigData,Inference — Patrick Durusau @ 7:03 pm

Drawing Causal Inference from Big Data.

Overview:

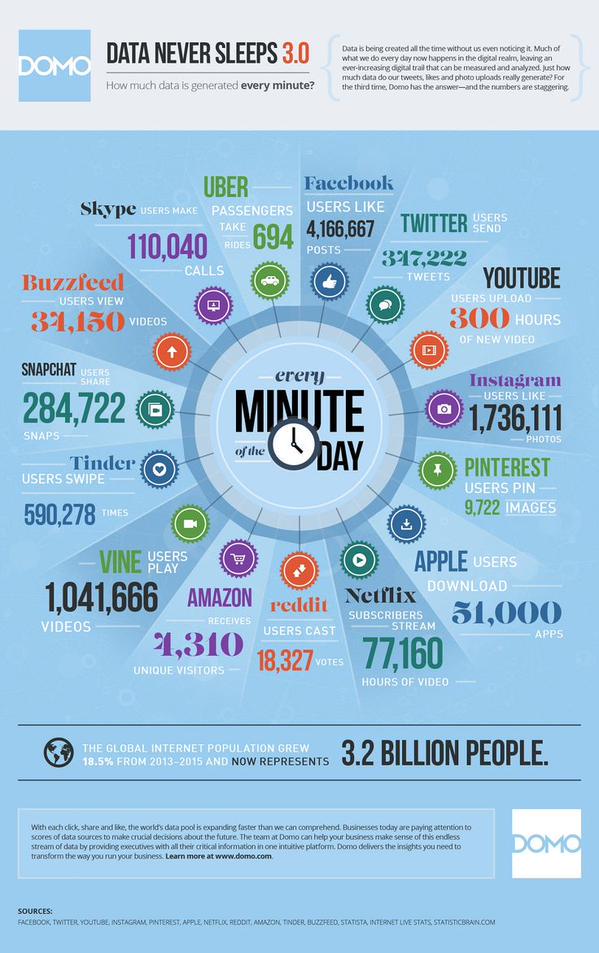
This colloquium was motivated by the exponentially growing amount of information collected about complex systems, colloquially referred to as “Big Data”. It was aimed at methods to draw causal inference from these large data sets, most of which are not derived from carefully controlled experiments. Although correlations among observations are vast in number and often easy to obtain, causality is much harder to assess and establish, partly because causality is a vague and poorly specified construct for complex systems. Speakers discussed both the conceptual framework required to establish causal inference and designs and computational methods that can allow causality to be inferred. The program illustrates state-of-the-art methods with approaches derived from such fields as statistics, graph theory, machine learning, philosophy, and computer science, and the talks will cover such domains as social networks, medicine, health, economics, business, internet data and usage, search engines, and genetics. The presentations also addressed the possibility of testing causality in large data settings, and will raise certain basic questions: Will access to massive data be a key to understanding the fundamental questions of basic and applied science? Or does the vast increase in data confound analysis, produce computational bottlenecks, and decrease the ability to draw valid causal inferences?

Videos of the talks are available on the Sackler YouTube Channel. More videos will be added as they are approved by the speakers.

Great material but I’m in the David Hume camp when it comes to causality. Or more properly the sceptical realist interpretation of David Hume. The contemporary claims that ISIS is a social media Svengali is a good case in point. The only two “facts” that not in dispute is that ISIS has used social media and some Westerners have in fact joined up with ISIS.

Both of those facts are true, but to assert a causal link between them borders on the bizarre. Joshua Berlinger reports in The names: Who has been recruited to ISIS from the West that some twenty thousand (20,000) foreign fighters have joined ISIS. That group of foreign fighters hails from ninety (90) countries and thirty-four hundred are from Western states.

Even without Hume’s skepticism on causation, there is no evidence for the proposition that current foreign fighters read about ISIS on social media and therefore decided to join up. None, nada, the empty set. The causal link between social media and ISIS is wholly fictional and made to further other policy goals, like censoring ISIS content.

Be careful how you throw “causality” about when talking about big data or data in general.

The listing of the current videos at YouTube has the author names only, does not include the titles or abstracts. To make these slightly more accessible, I have created the following listing with the author, title (link to YouTube if available), and Abstract/Slides as appropriate. In alphabetical order by last name. Author names are hyperlinks to identify the authors.

Edo Airoldi, Harvard University, Optimal Design of Causal Experiments in the Presence of Social Interference. Abstract

Susan Athey, Stanford University, Estimating Heterogeneous Treatment Effects Using Machine Learning in Observational Studies. Slides.

Leon Bottou, Facebook AI Research, Causal Reasoning and Learning Systems Abstract

Peter Buhlmann, ETH Zurich, Causal Inference Based on Invariance: Exploiting the Power of Heterogeneous Data Slides

Dean Eckles, Facebook, Identifying Peer Effects in Social Networks Abstract

James Fowler, University of California, San Diego, An 85 Million Person Follow-up to a 61 Million Person Experiment in Social Influence and Political Mobilization. Abstract

Michael Hawrylycz, Allen Institute, Project MindScope:  From Big Data to Behavior in the Functioning Cortex Abstract

David Heckerman, Microsoft Corporation, Causal Inference in the Presence of Hidden Confounders in Genomics Slides.

Michael Jordan, University of California, Berkeley, On Computational Thinking, Inferential Thinking and Big Data . Abstract.

Steven Levitt, The University of Chicago, Thinking Differently About Big Data Abstract

David Madigan, Columbia University, Honest Inference From Observational Database Studies Abstract

Judea Pearl, University of California, Los Angeles, Taming the Challenge of Extrapolation: From Multiple Experiments and Observations to Valid Causal Conclusions Slides

Thomas Richardson, University of Washington, Non-parametric Causal Inference Abstract

James Robins, Harvard University, Personalized Medicine, Optimal Treatment Strategies, and First Do No Harm: Time Varying Treatments and Big Data Abstract

Bernhard Schölkopf, Max Planck Institute, Toward Causal Machine Learning Abstract.

Jasjeet Sekhon, University of California, Berkeley, Combining Experiments with Big Data to Estimate Treatment Effects Abstract.

Richard Shiffrin, Indiana University, The Big Data Sea Change Abstract.

I call your attention to this part of Shiffrin’s abstract:

Second, having found a pattern, how can we explain its causes?

This is the focus of the present Sackler Colloquium. If in a terabyte data base we notice factor A is correlated with factor B, there might be a direct causal connection between the two, but there might be something like 2**300 other potential causal loops to be considered. Things could be even more daunting: To infer probabilities of causes could require consideration all distributions of probabilities assigned to the 2**300 possibilities. Such numbers are both fanciful and absurd, but are sufficient to show that inferring causality in Big Data requires new techniques. These are under development, and we will hear some of the promising approaches in the next two days.

John Stamatoyannopoulos, University of Washington, Decoding the Human Genome:  From Sequence to Knowledge.

Hal Varian, Google, Inc., Causal Inference, Econometrics, and Big Data Abstract.

Bin Yu, University of California, Berkeley, Lasso Adjustments of Treatment Effect Estimates in Randomized Experiments  Abstract.

If you are interested in starting an argument, watch the Steven Levitt video starting at timemark 46:20. 😉

Enjoy!

April 7, 2015

33% of Poor Business Decisions Track Back to Data Quality Issues

Filed under: BigData,Data,Data Quality — Patrick Durusau @ 3:46 pm

Stupid errors in spreadsheets could lead to Britain’s next corporate disaster by Rebecca Burn-Callander.

From the post:

Errors in company spreadsheets could be putting billions of pounds at risk, research has found. This is despite high-profile spreadsheet catastrophes, such as the collapse of US energy giant Enron, ringing alarm bells more than a decade ago.

Almost one in five large businesses have suffered financial losses as a result of errors in spreadsheets, according to F1F9, which provides financial modelling and business forecasting to blue chips firms. It warns of looming financial disasters as 71pc of large British business always use spreadsheets for key financial decisions.

The company’s new whitepaper entitiled Capitalism’s Dirty Secret showed that the abuse of humble spreadsheet could have far-reaching consequences. Spreadsheets are used in the preparation of British company accounts worth up to £1.9 trillion and the UK manufacturing sector uses spreadsheets to make pricing decisions for up to £170bn worth of business.

Felienne Hermans, of Delft University of Technology, analysed 15,770 spreadsheets obtained from over 600,000 emails from 158 former employees. He found 755 files with more than a hundred errors, with the maximum number of errors in one file being 83,273.

Dr Hermans said: “The Enron case has given us a unique opportunity to look inside the workings of a major corporate organisation and see first hand how widespread poor spreadsheet practice really is.

First, a gender correction, Dr. Hermans is not a he. The post should read: “She found 755 files with more than….

Second, how bad is poor spreadsheet quality? The download page has this summary:

  • 33% of large businesses report poor decision making due to spreadsheet problems.
  • Nearly 1 in 5 large businesses have suffered direct financial loss due to poor spreadsheets.
  • Spreadsheets are used in the preparation of British company accounts worth up to £1.9 trillion.

You read that correctly, not that 33% of spreadsheet have quality issues but that 33% of poor business decisions can be traced to spreadsheet problems.

A comment to the blog post supplied a link for the report: A Research Report into the Uses and Abuses of Spreadsheets.

Spreadsheets are small to medium sized data.

Care to comment on the odds of big data and its processes pushing the percentage of poor business decisions past 33%?

How would you discover you are being misled by big data and/or its processing?

How do you validate the results of big data? Run another big data process?

When you hear sales pitches about big data, be sure to ask about the impact of dirty data. If assured that your domain doesn’t have a dirty data issue, grab your wallet and run!

PS: A Research Report into the Uses and Abuses of Spreadsheets is a must have publication.

The report itself is useful, but Appendix A 20 Principles For Good Spreadsheet Practice is a keeper. With a little imagination all of those principles could be applied to big data and its processing.

Just picking one at random:

3. Ensure that everyone involved in the creation or use of spreadsheet has an appropriate level of knowledge and understanding.

For big data, reword that to:

Ensure that everyone involved in the creation or use of big data has an appropriate level of knowledge and understanding.

Your IT staff are trained, but do the managers who will use the results understand the limitations of the data and/or it processing? Or do they follow the results because “the data says so?”

March 29, 2015

Big Data Leaves Money On The Table

Filed under: BigData,Marketing — Patrick Durusau @ 1:52 pm

Big data hype reminds me of the “He’s Large” song from Popeye.

The recurrent theme is that whatever his other qualities, Bluto is large.

I mention that because Anthony Smith illustrates in When it Comes to Data, Small is the New Big, big data is great, but it never tells the whole story.

The whole story includes how and why customers buy and use your product. Trivial things like that.

Don’t use big data like the NSA uses phone data:

There is no other way we know of to connect the dots NSA & Connecting the Dots

Big data can show a return on your investment but it will only show you some of the facts that are available.

Don’t allow a fixation on “big data” blind you to the value of small data, which isn’t available to big data approaches and tools.

PS: The NSA uses phone data as churn for the sake their budget. Churn of big data doesn’t add to your bottom line.

March 27, 2015

Using Spark DataFrames for large scale data science

Filed under: BigData,Data Frames,Spark — Patrick Durusau @ 7:33 pm

Using Spark DataFrames for large scale data science by Reynold Xin.

From the post:

When we first open sourced Spark, we aimed to provide a simple API for distributed data processing in general-purpose programming languages (Java, Python, Scala). Spark enabled distributed data processing through functional transformations on distributed collections of data (RDDs). This was an incredibly powerful API—tasks that used to take thousands of lines of code to express could be reduced to dozens.

As Spark continues to grow, we want to enable wider audiences beyond big data engineers to leverage the power of distributed processing. The new DataFrame API was created with this goal in mind. This API is inspired by data frames in R and Python (Pandas), but designed from the ground up to support modern big data and data science applications. As an extension to the existing RDD API, DataFrames feature:

  • Ability to scale from kilobytes of data on a single laptop to petabytes on a large cluster
  • Support for a wide array of data formats and storage systems
  • State-of-the-art optimization and code generation through the Spark SQL Catalyst optimizer
  • Seamless integration with all big data tooling and infrastructure via Spark
  • APIs for Python, Java, Scala, and R (in development via SparkR)

For new users familiar with data frames in other programming languages, this API should make them feel at home. For existing Spark users, this extended API will make Spark easier to program, and at the same time improve performance through intelligent optimizations and code-generation.

If you don’t know Spark DataFrames, you are missing out on important Spark capabilities! This post will have to well on the way to recovery.

Even though the reading of data from other sources is “easy” in many cases and support for more is growing, I am troubled by statements like:


DataFrames’ support for data sources enables applications to easily combine data from disparate sources (known as federated query processing in database systems). For example, the following code snippet joins a site’s textual traffic log stored in S3 with a PostgreSQL database to count the number of times each user has visited the site.

That goes well beyond reading data and introduces the concept of combining data, which isn’t the same thing.

For any two data sets that are trivially transparent to you (caveat what is transparent to you may/may not be transparent to others), that example works.

That example fails where data scientists spend 50 to 80 percent of their time: “collecting and preparing unruly digital data.” For Big-Data Scientists, ‘Janitor Work’ Is Key Hurdle to Insights.

If your handlers are content to spend 50 to 80 percent of your time munging data, enjoy. Not that munging data will ever go away, but documenting the semantics of your data can enable you to spend less time munging and more time on enjoyable tasks.

March 21, 2015

Where’s the big data?

Filed under: BigData — Patrick Durusau @ 9:53 am

Alex Woodie in Can’t Ignore the Big Data Revolution draws our attention to: Big Data Revolution by Rob Thomas and Patrick McSharry.

Not the first nor likely the last book on “big data,” but it did draw these comments from Thomas Hale:

Despite all the figures, though, the revolution is not entirely quantified after all. The material costs to businesses implied by installing data infrastructure, outsourcing data management to other companies, or storing data, are rarely enumerated. Given the variety of industries the authors tackle, this is understandable. But it seems the cost of the revolution (something big data itself might be inclined to predict) remains unknown.

The book is perhaps most interesting as a case study of the philosophical assumptions that underpin the growing obsession with data. Leaders of the revolution will have “the ability to suspend disbelief of what is possible, and to create their own definition of possible,” the authors write.

Their prose draws heavily on similar invocations of technological idealism, with the use of words such as “enlightenment”, “democratise”, “knowledge-based society” and “inspire”.

Part of their idea of progress implies a need to shift from opinion to fact. “Modern medicine is being governed by human judgment (opinion and bias), instead of data-based science,” state the authors.

Hale comes close but strikes short of the mark when he excuses the lack of data to justify the revolution.

The principal irony of this book and others in the big data orthodoxy is the lack of big data to justify the claims made on behalf of big data. If the evidence is lacking because big data isn’t in wide use, then the claims for big data are not “data-based” are they?

The claims for big data take on a more religious tinge, particularly when readers are urged to “suspend disbelief,” create new definitions of possible, to seek “enlightenment,” etc.

You may remember the near religious hysteria around intelligent agents and the Semantic Web, the remnants of which are still entangling libraries and government projects who haven’t gotten the word that it failed. In part because information issues are indifferent to the religious beliefs of humans.

The same is the case with both the problems and benefits of big data, whatever you believe them to be, those problems and benefits are deeply indifferent to your beliefs. What is more, your beliefs can’t change the nature of those problems and benefits.

Shouldn’t a “big data” book be data-driven and not the product of “human judgment (opinion and bias)”?

Careful readers will ask, hopefully before purchasing a copy of Big Data Revolution and thereby encouraging more publications on “big data” is:

Where’s the big data?

You can judge whether to purchase the volume on the basis of the answer to that question.

PS: Make no mistake, data can have value. But, spontaneous generation of value by piling data into ever increasing piles is just as bogus as spontaneous generation of life.

PPS: Your first tip off that there is no “big data” is the appearance of the study in book form. If there were “big data” to support their conclusions, you would need cloud storage to host it and tools to manipulate it. In that case, why do you need the print book?

March 20, 2015

Tamr Catalog Tool (And Email Harvester)

Filed under: BigData,Data Integration — Patrick Durusau @ 4:10 pm

Tamr to Provide Free, Standalone Version of Tamr Catalog Tool

From the webpage:


Tamr Catalog was announced in February as part of the Tamr Platform for enterprise data unification. Using Tamr Catalog, enterprises can quickly inventory all the data that exists in the enterprise, regardless of type, platform or source. With today’s announcement of a free, standalone version of Tamr Catalog, enterprises can now speed and standardize data inventorying, making more data visible and readily usable for analytics.

Tamr Catalog is a free, standalone tool that allows businesses to logically map the attributes and records of a given data source with the entity it actually represents. This speeds time-to- analytics by reducing the amount of time spent searching for data.

That all sounds interesting but rather short on how the Tamr Catalog Tool will make that happen.

Download the whitepaper? Its all of two (2) pages long. Genuflects to 90% of data being dark, etc. but not a whisper on how the Tamr Catalog Tool will cure that darkness.

Oh, it will cost you your email address to get the two page flyer and you won’t be any better informed than before.

Let’s all hope they discover how to make the Tamr Catalog Tool perform these miracles before it is released this coming summer.

I do think the increasing interest in “dark data” bodes well for topic maps.

March 19, 2015

Jump-Start Big Data with Hortonworks Sandbox on Azure

Filed under: Azure Marketplace,BigData,Hadoop,Hortonworks — Patrick Durusau @ 6:55 pm

Jump-Start Big Data with Hortonworks Sandbox on Azure by Saptak Sen.

From the post:

We’re excited to announce the general availability of Hortonworks Sandbox for Hortonworks Data Platform 2.2 on Azure.

Hortonworks Sandbox is already a very popular environment in which developers, data scientists, and administrators can learn and experiment with the latest innovations in the Hortonworks Data Platform.

The hundreds of innovations span Hadoop, Kafka, Storm, Hive, Pig, YARN, Ambari, Falcon, Ranger, and other components of which HDP is composed. Now you can deploy this environment for your learning and experimentation in a few clicks on Microsoft Azure.

Follow the guide to Getting Started with Hortonworks Sandbox with HDP 2.2 on Azure to set up your own dev-ops environment on the cloud in a few clicks.

We also provide step by step tutorials to help you get a jump-start on how to use HDP to implement a Modern Data Architecture at your organization.

The Hadoop Sandbox is an excellent way to explore the Hadoop ecosystem. If you trash the setup, just open another sandbox.

Add Hortonworks tutorials to the sandbox and you are less likely to do something really dumb. Or at least you will understand what happened and how to avoid it before you go into production. Always nice to keep the dumb mistakes on your desktop.

Now the Hortonworks Sandbox is on Azure. Same safe learning environment but the power to scale when you are really to go live!

March 14, 2015

The Data Engineering Ecosystem: An Interactive Map

Filed under: BigData,Data Pipelines,Visualization — Patrick Durusau @ 6:58 pm

The Data Engineering Ecosystem: An Interactive Map by David Drummond and John Joo.

From the post:

Companies, non-profit organizations, and governments are all starting to realize the huge value that data can provide to customers, decision makers, and concerned citizens. What is often neglected is the amount of engineering required to make that data accessible. Simply using SQL is no longer an option for large, unstructured, or real-time data. Building a system that makes data usable becomes a monumental challenge for data engineers.

There is no plug and play solution that solves every use case. A data pipeline meant for serving ads will look very different from a data pipeline meant for retail analytics. Since there are unlimited permutations of open-source technologies that can be cobbled together, it can be overwhelming when you first encounter them. What do all these tools do and how do they fit into the ecosystem?

Insight Data Engineering Fellows face these same questions when they begin working on their data pipelines. Fortunately, after several iterations of the Insight Data Engineering Program, we have developed this framework for visualizing a typical pipeline and the various data engineering tools. Along with the framework, we have included a set of tools for each category in the interactive map.

This looks quite handy if you are studying for a certification test and need to know the components and a brief bit about each one.

For engineering purposes, it would be even better if you could connect your pieces together and then map the data flows through the pipelines. That is where did the data previously held in table X go during each step and what operations were performed on it? Not to mention being able to track an individual datum through the process.

Is there a tool that I haven’t seen or overlooked that allows that type of insight into a data pipeline? With subject identities of course for the various subjects along the way.

March 12, 2015

Speaking of Numbers and Big Data Disruption

Filed under: BigData,Statistics,Survey — Patrick Durusau @ 6:49 pm

Survey: Big Data is Disrupting Business as Usual by George Leopold.

From the post:

Sixty-four percent of the enterprises surveyed said big data is beginning to change the traditional boundaries of their businesses, allowing more agile providers to grab market share. More than half of those surveyed said they are facing greater competition from “data-enabled startups” while 27 percent reported competition from new players from other industries.

Hence, enterprises slow to embrace data analytics are now fretting over their very survival, EMC and the consulting firm argued.

Those fears are expected to drive investment in big data over the next three years, with 54 percent of respondents saying they plan to increase investment in big data tools. Among those who have already made big data investments, 61 percent said data analytics are already driving company revenues. The fruits of these big data efforts are proving as valuable as existing products and services, the survey found.

That sounds important, except they never say how business is being disrupted? Seems like that would be an important point to make. Yes?

And note the 61% who “…said data analytics are already driving company revenues…” are “…among those who have already made big data investments….” Was that ten people? Twenty? And who after making a major investment is going to say that it sucks?

The survey itself sounds suspect if you read the end of the post:

Capgemini said its big data report is based on an online survey conducted in August 2014 of more than 1,000 senior executives across nine industries in ten global markets. Survey author FreshMinds also conducted follow-up interviews with some respondents.

I think there is a reason that Gallup and those sort of folks don’t do online surveys. It has something to do with accuracy if I recall correctly. 😉

March 11, 2015

Selling Big Data to Big Oil

Filed under: BigData,Marketing — Patrick Durusau @ 7:42 pm

Oil firms are swimming in data they don’t use by Tom DiChristopher.

From the post:

McKinsey & Company wanted to know how much of the data gathered by sensors on offshore oil rigs is used in decision-making by the energy industry. The answer, it turns out, is not much at all.

After studying sensors on rigs around the world, the management consulting firm found that less than 1 percent of the information gathered from about 30,000 separate data points was being made available to the people in the industry who make decisions.
Technology that can deliver data on virtually every aspect of drilling, production and rig maintenance has spread throughout the industry. But the capability—or, in some cases, the desire—to process that data has spread nowhere near as quickly. As a result, drillers are almost certainly operating below peak performance—leaving money on the table, experts said.

Drilling more efficiently could also help companies achieve the holy grail—reducing the break-even cost of producing a barrel of oil, said Kirk Coburn, founder and managing director at Surge Ventures, a Houston-based energy technology investment firm.

Separately, a report by global business consulting firm Bain & Co. estimated that better data analysis could help oil and gas companies boost production by 6 to 8 percent. The use of so-called analytics has become commonplace in other industries from banking and airlines to telecommunications and manufacturing, but energy firms continue to lag.

Great article although Tom does seem to assume that better data analysis will automatically lead to better results. It can but I would rather under promise and over deliver, particularly in a industry without a lot of confidence in the services being offered.

March 10, 2015

Apache Tajo brings data warehousing to Hadoop

Filed under: Apache Tajo,BigData,Hadoop — Patrick Durusau @ 6:47 pm

Apache Tajo brings data warehousing to Hadoop by Joab Jackson.

From the post:

Organizations that want to extract more intelligence from their Hadoop deployments might find help from the relatively little known Tajo open source data warehouse software, which the Apache Software Foundation has pronounced as ready for commercial use.

The new version of Tajo, Apache software for running a data warehouse over Hadoop data sets, has been updated to provide greater connectivity to Java programs and third party databases such as Oracle and PostGreSQL.

While less well-known than other Apache big data projects such as Spark or Hive, Tajo could be a good fit for organizations outgrowing their commercial data warehouses. It could also be a good fit for companies wishing to analyze large sets of data stored on Hadoop data processing platforms using familiar commercial business intelligence tools instead of Hadoop’s MapReduce framework.

Tajo performs the necessary ETL (extract-transform-load process) operations to summarize large data sets stored on an HDFS (Hadoop Distributed File System). Users and external programs can then query the data through SQL.

The latest version of the software, issued Monday, comes with a newly improved JDBC (Java Database Connectivity) driver that its project managers say makes Tajo as easy to use as a standard relational database management system. The driver has been tested against a variety of commercial business intelligence software packages and other SQL-based tools. (Just so you know, I took out the click following stuff and inserted the link to the Tajo project page only.)

Being surprised by Apache Tajo I looked at the list of the top level projects at Apache and while I recognized a fair number of them by name, I could tell you the status only of those I actively follow. Hard to say what other jewels are hidden there.

Joab cites several large data consumers who have found Apache Tajo faster than Hive for their purposes. Certainly an option to keep in mind.

NIH-led effort launches Big Data portal for Alzheimer’s drug discovery

Filed under: BigData,Bioinformatics,Medical Informatics,Open Science — Patrick Durusau @ 6:23 pm

NIH-led effort launches Big Data portal for Alzheimer’s drug discovery

From the post:

A National Institutes of Health-led public-private partnership to transform and accelerate drug development achieved a significant milestone today with the launch of a new Alzheimer’s Big Data portal — including delivery of the first wave of data — for use by the research community. The new data sharing and analysis resource is part of the Accelerating Medicines Partnership (AMP), an unprecedented venture bringing together NIH, the U.S. Food and Drug Administration, industry and academic scientists from a variety of disciplines to translate knowledge faster and more successfully into new therapies.

The opening of the AMP-AD Knowledge Portal and release of the first wave of data will enable sharing and analyses of large and complex biomedical datasets. Researchers believe this approach will ramp up the development of predictive models of Alzheimer’s disease and enable the selection of novel targets that drive the changes in molecular networks leading to the clinical signs and symptoms of the disease.

“We are determined to reduce the cost and time it takes to discover viable therapeutic targets and bring new diagnostics and effective therapies to people with Alzheimer’s. That demands a new way of doing business,” said NIH Director Francis S. Collins, M.D., Ph.D. “The AD initiative of AMP is one way we can revolutionize Alzheimer’s research and drug development by applying the principles of open science to the use and analysis of large and complex human data sets.”

Developed by Sage Bionetworks , a Seattle-based non-profit organization promoting open science, the portal will house several waves of Big Data to be generated over the five years of the AMP-AD Target Discovery and Preclinical Validation Project by multidisciplinary academic groups. The academic teams, in collaboration with Sage Bionetworks data scientists and industry bioinformatics and drug discovery experts, will work collectively to apply cutting-edge analytical approaches to integrate molecular and clinical data from over 2,000 postmortem brain samples.

Big data and open science, now that sounds like a winning combination:

Because no publication embargo is imposed on the use of the data once they are posted to the AMP-AD Knowledge Portal, it increases the transparency, reproducibility and translatability of basic research discoveries, according to Suzana Petanceska, Ph.D., NIA’s program director leading the AMP-AD Target Discovery Project.

“The era of Big Data and open science can be a game-changer in our ability to choose therapeutic targets for Alzheimer’s that may lead to effective therapies tailored to diverse patients,” Petanceska said. “Simply stated, we can work more effectively together than separately.”

Imagine that, academics who aren’t hoarding data for recruitment purposes.

Works for me!

Does it work for you?

NIH RFI on National Library of Medicine

Filed under: BigData,Machine Learning,Medical Informatics,NIH — Patrick Durusau @ 2:16 pm

NIH Announces Request for Information Regarding Deliberations of the Advisory Committee to the NIH Director (ACD) Working Group on the National Library of Medicine

Deadline: Friday, March 13, 2015.

Responses to this RFI must be submitted electronically to: http://grants.nih.gov/grants/rfi/rfi.cfm?ID=41.

Apologies for having missed this announcement. Perhaps the title lacked urgency? 😉

From the post:

The National Institutes of Health (NIH) has issued a call for participation in a Request for Information (RFI), allowing the public to share its thoughts with the NIH Advisory Committee to the NIH Director Working Group charged with helping to chart the course of the National Library of Medicine, the world’s largest biomedical library and a component of the NIH, in preparation for recruitment of a successor to Dr. Donald A.B. Lindberg, who will retire as NLM Director at the end of March 2015.

As part of the working group’s deliberations, NIH is seeking input from stakeholders and the general public through an RFI.

Information Requested

The RFI seeks input regarding the strategic vision for the NLM to ensure that it remains an international leader in biomedical data and health information. In particular, comments are being sought regarding the current value of and future need for NLM programs, resources, research and training efforts and services (e.g., databases, software, collections). Your comments can include but are not limited to the following topics:

  • Current NLM elements that are of the most, or least, value to the research community (including biomedical, clinical, behavioral, health services, public health and historical researchers) and future capabilities that will be needed to support evolving scientific and technological activities and needs.
  • Current NLM elements that are of the most, or least, value to health professionals (e.g., those working in health care, emergency response, toxicology, environmental health and public health) and future capabilities that will be needed to enable health professionals to integrate data and knowledge from biomedical research into effective practice.
  • Current NLM elements that are of most, or least, value to patients and the public (including students, teachers and the media) and future capabilities that will be needed to ensure a trusted source for rapid dissemination of health knowledge into the public domain.
  • Current NLM elements that are of most, or least, value to other libraries, publishers, organizations, companies and individuals who use NLM data, software tools and systems in developing and providing value-added or complementary services and products and future capabilities that would facilitate the development of products and services that make use of NLM resources.
  • How NLM could be better positioned to help address the broader and growing challenges associated with:
    • Biomedical informatics, “big data” and data science;
    • Electronic health records;
    • Digital publications; or
    • Other emerging challenges/elements warranting special consideration.

If I manage to put something together, I will post it here as well as to the NIH.

Experiences with big data and machine learning, for all of the hype, have been falling short of the promised land. Not that I think topic maps/subject identity can get you there but certainly closer than wandering in the woods of dark data.

« Newer PostsOlder Posts »

Powered by WordPress