Another Word For It Patrick Durusau on Topic Maps and Semantic Diversity

February 1, 2015

Mapping the Blind Spots:…

Filed under: Data Science,Mapping,Maps,Privacy — Patrick Durusau @ 4:48 pm

Mapping the Blind Spots: Developer Unearths Secret U.S. Military Bases by Lorenzo Franceschi-Bicchierai.

From the post:

If you look closely enough on Google or Bing Maps, some places are blanked out, hidden from public view. Many of those places disguise secret or sensitive American military facilities.

The United States military has a foothold in every corner of the world, with military bases on every continent. It’s not even clear how many there are out there. The Pentagon says there are around 5,000 in total, and 598 in foreign countries, but those numbers are disputed by the media.

But how do these facilities look from above? To answer that question, you first need to locate the bases. Which, as it turns out, is relatively easy.

That’s what Josh Begley, a data artist, found out when he embarked on a project to map all known U.S. military bases around the world, collect satellite pictures of them using Google Maps and Bing Maps, and display them all online.

The project, which he warns is ongoing, was inspired by Trevor Paglen’s book “Blank Spots on the Map” which goes inside the world of secret military bases that are sometimes censored on maps.

A great description of how to combine public data to find information others prefer to not be found.

I suspect the area is well enough understood to make a great high school science fair project, particularly if countries that aren’t as open as the United States were used as targets for filling in the blank spaces. Would involve obtaining public maps for that country, determining what areas are “blank,” photo analysis of imagery, correlation with press and other reports.

Or detection of illegal cutting of forests, mining, or other ecological crimes. All of those are too large scale to be secret.

Better imagery is only a year or two away, perhaps sufficient to start tracking polluters who truck industrial wastes to particular states for dumping.

With satellite/drone imagery and enough eyes, no crime is secret.

The practices of illegal forestry, mining, pollution, virtually any large scale outdoor crime will wither under public surveillance.

That might not be a bad trade-off in terms of privacy.

Parallel Programming with GPUs and R

Filed under: Data Science,GPU,Parallel Programming — Patrick Durusau @ 1:49 pm

Parallel Programming with GPUs and R by Norman Matloff.

From the post:

You’ve heard that graphics processing units — GPUs — can bring big increases in computational speed. While GPUs cannot speed up work in every application, the fact is that in many cases it can indeed provide very rapid computation. In this tutorial, we’ll see how this is done, both in passive ways (you write only R), and in more direct ways, where you write C/C++ code and interface it to R.

Norman provides as readable an introduction to GPUs as I have seen in a while, a quick overview of R packages for accessing GPUs and then a quick look at writing CUDA code and problems you may have compiling it.

Of particular note is Norman’s reference to a draft of his new book, Parallel Computation for Data Science, which introduces parallel computing with R.

It won’t be long before parallel or not processing will be a detail hidden from the average programmer. Until then, see this post and Norman’s book for parallel processing and R.

January 30, 2015

Data Science in Python

Filed under: Data Science,Python — Patrick Durusau @ 8:04 pm

Data Science in Python by Greg.

From the webpage:

Last September we gave a tutorial on Data Science with Python at DataGotham right here in NYC. The conference was great and I highly suggest it! The “data prom” event the night before the main conference was particularly fun!

… (image omitted)

We’ve published the entire tutorial as a collection of IPython Notebooks. You can find the entire presentation on github or checkout the links to nbviewer below.

…(image omitted)

Table of Contents

A nice surprise for the weekend!

Curious, out of the government data that is online, local, state, federal, what data would you like most to see for holding government accountable?

Data science is a lot of fun in and of itself but results that afflict the comfortable are amusing as well.

I first saw this in a tweet by YHat, Inc.

January 27, 2015

Data Science and Hadoop: Predicting Airline Delays – Part 3

Filed under: Data Science,Hadoop,R — Patrick Durusau @ 3:55 pm

Data Science and Hadoop: Predicting Airline Delays – Part 3 by Ofer Mendelevitch and Beau Plath.

From the post:

In our series on Data Science and Hadoop, predicting airline delays, we demonstrated how to build predictive models with Apache Hadoop, using existing tools. In part 1, we employed Pig and Python; part 2 explored Spark, ML-Lib and Scala.

Throughout the series, the thesis, theme, topic, and algorithms were similar. That is, we wanted to dismiss the misconception that data scientists – when applying predictive learning algorithms, like Linear Regression, Random Forest or Neural Networks to large datasets – require dramatic changes to the tooling; that they need dedicated clusters; and that existing tools will not suffice.

Instead, we used the same HDP cluster configuration, the same machine learning techniques, the same data sets, and the same familiar tools like PIG, Python and Scikit-learn and Spark.

For the final part, we resort to Scalding and R. R is a very popular, robust and mature environment for data exploration, statistical analysis, plotting and machine learning. We will use R for data exploration, graphics as well as for building our predictive models with Random Forest and Gradient Boosted Trees. Scalding, on the other hand, provides Scala libraries that abstract Hadoop MapReduce and implement data pipelines. We demonstrate how to pre-process the data into a feature matrix using the Scalding framework.

For brevity I shall spare summarizing the methodology here, since both previous posts (and their accompanying IPython Notebooks) expound the steps, iteration and implementation code. Instead, I would urge that you read all parts as well as try the accompanying IPython Notebooks.

Finally, for this last installment in the series in Scaling and R, read its IPython Notebook for implementation details.

Given the brevity of this post, you are definitely going to need Part 1 and Part 2.

The data science world could use more demonstrations like this series.

January 19, 2015

D-Lib Magazine January/February 2015

Filed under: Data Science,Librarian/Expert Searchers,Library — Patrick Durusau @ 8:37 pm

D-Lib Magazine January/February 2015

From the table of contents (see the original toc for abstracts):

Editorials

2nd International Workshop on Linking and Contextualizing Publications and Datasets by Laurence Lannom, Corporation for National Research Initiatives

Data as “First-class Citizens” by Łukasz Bolikowski, ICM, University of Warsaw, Poland; Nikos Houssos, National Documentation Centre / National Hellenic Research Foundation, Greece; Paolo Manghi, Istituto di Scienza e Tecnologie dell’Informazione, Consiglio Nazionale delle Ricerche, Italy and Jochen Schirrwagen, Bielefeld University Library, Germany

Articles

Semantic Enrichment and Search: A Case Study on Environmental Science Literature by Kalina Bontcheva, University of Sheffield, UK; Johanna Kieniewicz and Stephen Andrews, British Library, UK; Michael Wallis, HR Wallingford, UK

A-posteriori Provenance-enabled Linking of Publications and Datasets via Crowdsourcing by Laura Drăgan, Markus Luczak-Rösch, Elena Simperl, Heather Packer and Luc Moreau, University of Southampton, UK; Bettina Berendt, KU Leuven, Belgium

A Framework Supporting the Shift from Traditional Digital Publications to Enhanced Publications by Alessia Bardi and Paolo Manghi, Istituto di Scienza e Tecnologie dell’Informazione, Consiglio Nazionale delle Ricerche, Italy

Science 2.0 Repositories: Time for a Change in Scholarly Communication by Massimiliano Assante, Leonardo Candela, Donatella Castelli, Paolo Manghi and Pasquale Pagano, Istituto di Scienza e Tecnologie dell’Informazione, Consiglio Nazionale delle Ricerche, Italy

Data Citation Practices in the CRAWDAD Wireless Network Data Archive by Tristan Henderson, University of St Andrews, UK and David Kotz, Dartmouth College, USA

A Methodology for Citing Linked Open Data Subsets by Gianmaria Silvello, University of Padua, Italy

Challenges in Matching Dataset Citation Strings to Datasets in Social Science by Brigitte Mathiak and Katarina Boland, GESIS — Leibniz Institute for the Social Sciences, Germany

Enabling Living Systematic Reviews and Clinical Guidelines through Semantic Technologies by Laura Slaughter; The Interventional Centre, Oslo University Hospital (OUS), Norway; Christopher Friis Berntsen and Linn Brandt, Internal Medicine Department, Innlandet Hosptial Trust and MAGICorg, Norway and Chris Mavergames, Informatics and Knowledge Management Department, The Cochrane Collaboration, Germany

Data without Peer: Examples of Data Peer Review in the Earth Sciences by Sarah Callaghan, British Atmospheric Data Centre, UK

The Tenth Anniversary of Assigning DOI Names to Scientific Data and a Five Year History of DataCite by Jan Brase and Irina Sens, German National Library of Science and Technology, Germany and Michael Lautenschlager, German Climate Computing Centre, Germany

New Events

N E W S   &   E V E N T S

In Brief: Short Items of Current Awareness

In the News: Recent Press Releases and Announcements

Clips & Pointers: Documents, Deadlines, Calls for Participation

Meetings, Conferences, Workshops: Calendar of Activities Associated with Digital Libraries Research and Technologies

The quality of D-Lib Magazine meets or exceeds the quality claimed by pay-per-view publishers.

Enjoy!

January 2, 2015

Conference on Innovative Data Systems Research (CIDR) 2015 Program + Papers!

Filed under: Computer Science,Conferences,Data Analysis,Data Management,Data Science — Patrick Durusau @ 3:23 pm

Conference on Innovative Data Systems Research (CIDR) 2015

From the homepage:

The biennial Conference on Innovative Data Systems Research (CIDR) is a systems-oriented conference, complementary in its mission to the mainstream database conferences like SIGMOD and VLDB, emphasizing the systems architecture perspective. CIDR gathers researchers and practitioners from both academia and industry to discuss the latest innovative and visionary ideas in the field.

Papers are invited on novel approaches to data systems architecture and usage. Conference Venue CIDR mainly encourages papers about innovative and risky data management system architecture ideas, systems-building experience and insight, resourceful experimental studies, provocative position statements. CIDR especially values innovation, experience-based insight, and vision.

As usual, the conference will be held at the Asilomar Conference Grounds on the Pacific Ocean just south of Monterey, CA. The program will include: keynotes, paper presentations, panels, a gong-show and plenty of time for interaction.

The conference runs January 4 – 7, 2015 (starts next Monday). If you aren’t lucky enough to attend, the program has links to fifty-four (54) papers for your reading pleasure.

The program was exported from a “no-sense-of-abstraction” OOXML application. Conversion to re-usable form will take a few minutes. I will produce an author-sorted version this weekend.

In the meantime, enjoy the papers!

January 1, 2015

The Data Scientist

Filed under: Data Science,Publishing — Patrick Durusau @ 8:17 pm

The Data Scientist

Kurt Kagel has setup a newspaper on Data Science and Computational Linguistics with the following editor’s note:

I have been covering the electronic information space for more than thirty years, as writer, editor, programmer and information architect. This paper represents an experiment, a venue to explore Data Science and Computational Linguistics, as well as the world of IT in general.

I’m still working out bugs and getting a feel for the platform, so look and feel (and content) will almost certainly change. If you are interested in featuring articles here, please contact me.

It is based on paper.li, which automatically loads content into your newspaper. Not to mention you being able to load content as well.

I have known Kurt for a number of years in the markup world and look forward to seeing how this newspaper develops.

December 30, 2014

Ten Trends in Data Science 2015

Filed under: Data Science — Patrick Durusau @ 7:50 pm

Ten Trends in Data Science 2015 by Kurt Cagle.

From the post:

There is a certain irony talking about trends in data science, as much of data science is geared primarily to detecting and extrapolating trends from disparate data patterns. In this case, this is part of a series of analyses I’ve written for over a decade, looking at what I see as the key areas that most heavily impact the area of technology I’m focusing on at the top. For the last few years, this has been a set of technologies which have increasingly been subsumed under the rubrick of Data Science.

I tend to use the term to embrace an understanding of four key areas – Data Acquisition (how you get data into a usable form and set of stores or services), Data Awareness (how you provide context to this data so that it can work more effectively across or between enterprises), Data Analysis (turning this aware data into usable information for decision makers and data consumers) and Data Governance (establishing the business structures, provenance maintenance and continuity for that data). These I collectively call the Data Cycle, and it seems to be the broad arc that most data (whether Big Data or Small Data) follows in its life cycle. I’ll cover this cycle in more detail later, but for now, it provides a reasonably good scope for what I see as the trends that are emerging in this field.

This has been a remarkably good year in the field of data science – the Big Data field both matured and spawned a few additional areas of study, semantics went from being an obscure term to getting attention in the C-Suite and the demand for good data visualizers went from tepid to white hot.

A great overview of what is likely to be “hot” in 2015.

I disagree with Kurt when he says:


Over the course of the next year, this major upgrade to the SPARQL standard will become the de facto mechanism for communicating with triple stores, which will in turn driive the utilization of new semantics-based applications.

Semantics already figure pretty heavily in recommendation engines and similar applications, since these kinds of applications deal more heavily with searching and making connections between types of resources, and it plays fairly heavily in areas such as machine learning and NLP.

Not that I disagree with semantics being the area where large strides could be made and large profits as well. I disagree that SPARQL and triple-stores are going to play a meaningful role with regard to semantics, especially with recommendation engines, machine learning and NLP.

The “semantics” that recommendation engines mine are entirely unknown to the recommendation engine. Such a engine is ingesting a large amount of data and without making an explicit semantic choice, recommends a product to a user based on previous choices by that user and others. It is an entirely mechanical operation that has no sense of “semantics” at all. Semantic “understanding” isn’t required for Netflix or Amazon to do a pretty good job of recommending items to customers.

In terms of a recommendation, I seriously doubt a recommendation engine relies upon two items having a part-whole or class-subclass relationship. It is relying upon observed shopping/consumption behavior which may or may not have any internal coherence at all. What matters to a vendor, is that a sale is made, semantics be damned.

Other than that quibble, Kurt is predicting what most people anticipate seeing next year. Now for the fun part, seeing how the future develops in interesting and unpredictable ways.

December 26, 2014

24 Data Science Resources to Keep Your Finger on the Pulse

Filed under: Data Science — Patrick Durusau @ 8:33 pm

24 Data Science Resources to Keep Your Finger on the Pulse by Cheng Han Lee.

From the post:

There are lots of resources out there to learn about, or to build upon what you already know about, data science. But where do you start? What are some of the best or most authoritative sources? Here are some websites, books, and other resources that we think are outstanding.

All of these resources are worth following.

If you aspire to be a data scientist, do more than nod along with each posting. Download/install the tools, work through the presented problem and then explore beyond it. In three months, your data science skills will have improved more than you can imagine. Think of where you will be next year!

December 21, 2014

$175K to Identify Plankton

Filed under: Classification,Data Science,Machine Learning — Patrick Durusau @ 10:20 am

Oregon marine researchers offer $175,000 reward for ‘big data’ solution to identifying plankton by Kelly House.

From the post:

The marine scientists at Oregon State University need to catalog tens of millions of plankton photos, and they’re willing to pay good money to anyone willing to do the job.

The university’s Hatfield Marine Science Center on Monday announced the launch of the National Data Science Bowl, a competition that comes with a $175,000 reward for the best “big data” approach to sorting through the photos.

It’s a job that, done by human hands, would take two lifetimes to finish.

Data crunchers have 90 days to complete their task. Authors of the top three algorithms will share the $175,000 purse and Hatfield will gain ownership of their algorithms.

From the competition description:

The 2014/2015 National Data Science Bowl challenges you to create an image classification algorithm to automatically classify plankton species. This challenge is not easy— there are 100 classes of plankton, the images may contain non-plankton organisms and particles, and the plankton can appear in any orientation within three-dimensional space. The winning algorithms will be used by Hatfield Marine Science Center for simpler, faster population assessment. They represent a $1 million in-kind donation by the data science community!

There is a comprehensive tutorial to get you started and weekly blog posts on the contest.

You may also see this billed as the first National Data Science Bowl.

The contest runs from December 15, 2014 until March 16, 2015.

Competing is free and even if you don’t win the big prize, you will have gained valuable experience from the tutorials and discussions during the contest.

I first saw this in a tweet by Gregory Piatetsky

December 20, 2014

Leading from the Back: Making Data Science Work at a UX-driven Business

Filed under: Data Science,UX — Patrick Durusau @ 7:17 pm

Leading from the Back: Making Data Science Work at a UX-driven Business by John Foreman. (Microsoft Visiting Speaker Series)

The first thirty (30) minutes are easily the best ones I have spent on a video this year. (I haven’t finished the Q&A part yet.)

John is a very good speaker but in part his presentation is fascinating because it illustrates how to “sell” data analysis to customers (internal and external).

You will find that while John can do the math, he is also very adept at delivering value to his customer.

Not surprisingly, customers are less interested in bells and whistles or your semantic religion and more interested in value as they perceive it.

Catch the switch in point of view, it isn’t value from your point of view but the customer’s point of view.

You need to set aside some time to watch at least the first thirty minutes of this presentation.

BTW, John Foreman is the author of Data Smart, which he confesses is “not sexy.”

I first saw this in a tweet by Microsoft Research.

December 11, 2014

2014 Data Science Salary Survey [R + Python?]

Filed under: Data Science,Python,R — Patrick Durusau @ 7:27 am

2014 Data Science Salary Survey: Tools, Trends, What Pays (and What Doesn’t) for Data Professionals by John King and Roger Magoulas.

From the webpage:

For the second year, O’Reilly Media conducted an anonymous survey to expose the tools successful data analysts and engineers use, and how those tool choices might relate to their salary. We heard from over 800 respondents who work in and around the data space, and from a variety of industries across 53 countries and 41 U.S. states.

Findings from the survey include:

  • Average number of tools and median income for all respondents
  • Distribution of responses by a variety of factors, including age, location, industry, position, and cloud computing
  • Detailed analysis of tool use, including tool clusters
  • Correlation of tool usage and salary

Gain insight from these potentially career-changing findings—download this free report to learn the details, and plug your own variables into the regression model to find out where you fit into the data space.

The best take on this publication can be found in O’Reilly Data Scientist Salary and Tools Survey, November 2014 by David Smith where he notes:

The big surprise for me was the low ranking of NumPy and SciPy, two toolkits that are essential for doing statistical analysis with Python. In this survey and others, Python and R are often similarly ranked for data science applications, but this result suggests that Python is used about 90% for data science tasks other than statistical analysis and predictive analytics (my guess: mainly data munging). From these survey results, it seems that much of the “deep data science” is done by R.

My initial observation is that “more than 800 respondents” is too small of a data sample to draw any useful conclusions about tools used by data scientists. Especially when the #1 tool listed in that survey was Windows.

Why a majority of “data scientists” confuse an OS with data processing tools like SQL or Excel, both of which ranked higher than Python or R, is unknown but casts further doubt on the data sample.

My suggestion would be to have a primary tool or language (other than an OS) whether it is R or Python but to be familiar with the strengths of other approaches. Religious bigotry about approaches is a poor substitute for useful results.

November 22, 2014

A modern guide to getting started with Data Science and Python

Filed under: Data Science,Python — Patrick Durusau @ 12:02 pm

A modern guide to getting started with Data Science and Python by Thomas Wiecki.

From the post:

Python has an extremely rich and healthy ecosystem of data science tools. Unfortunately, to outsiders this ecosystem can look like a jungle (cue snake joke). In this blog post I will provide a step-by-step guide to venturing into this PyData jungle.

What’s wrong with the many lists of PyData packages out there already you might ask? I think that providing too many options can easily overwhelm someone who is just getting started. So instead, I will keep a very narrow scope and focus on the 10% of tools that allow you to do 90% of the work. After you mastered these essentials you can browse the long lists of PyData packages to decide which to try next.

The upside is that the few tools I will introduce already allow you to do most things a data scientist does in his day-to-day (i.e. data i/o, data munging, and data analysis).

A great “start small” post on Python.

Very appropriate considering that over sixty percent (60%) of software skill job postings mention Python. Popular Software Skills in Data Science Job postings. If you have a good set of basic tools, you can add specialized ones later.

November 16, 2014

8 Easy Steps to Becoming a Data Scientist

Filed under: Data Science — Patrick Durusau @ 2:57 pm

How to become a data scientist.

Not a bad graphic to have printed poster size for your wall. Write in what you have done on each step.

I first saw this at Ryan Swanstrom’s 8 Easy Steps to Becoming a Data Scientist and Ryan obtained the graphic from DataCamp, an instructional vendor that can assist you in becoming a data scientist.

November 5, 2014

Data Sources for Cool Data Science Projects: Part 2

Filed under: Data,Data Science — Patrick Durusau @ 5:33 pm

Data Sources for Cool Data Science Projects: Part 2 by Ryan Swanstrom.

From the post:

I am excited for the first ever guest posts on the Data Science 101 blog. Dr. Michael Li, Executive Director of The Data Incubator in New York City, is providing 2 great posts (see Part 1) about finding data for your next data science project.

Nice collection of data sources, some familiar and some unexpected.

Enjoy!

October 24, 2014

Data Science Challenge 3

Filed under: Challenges,Contest,Data Science — Patrick Durusau @ 6:39 pm

Data Science Challenge 3

From the post:

Challenge Period

The Fall 2014 Data Science Challenge runs October 11, 2014 through January 21, 2015.

Challenge Prerequisite

You must pass Data Science Essentials (DS-200) prior to registering for the Challenge.

Challenge Description

The Fall 2014 Data Science Challenge incorporates three independent problems derived from real-world scenarios and data sets. Each problem has its own data, can be solved independently, and should take you no longer than eight hours to complete. The Fall 2014 Challenge includes problems dealing with online travel services, digital advertising, and social networks.

Problem 1: SmartFly
You have been contacted by a new online travel service called SmartFly. SmartFly provides its customers with timely travel information and notifications about flights, hotels, destination weather, and airport traffic, with the goal of making your travel experience smoother. SmartFly’s product team has come up with the idea of using the flight data that it has been collecting to predict whether customers’ flights will be delayed in order to respond proactively. The team has now contacted you to help test out the viability of the idea. You will be given SmartFly’s data set from January 1 to September 30, 2014 and be asked to return a list of of upcoming flights sorted from the most likely to the least likely to be delayed.

Problem 2: Almost Famous
Congratulations! You have just published your first book on data science, advanced analytics, and predictive modeling. You’ve also decided to use your skills as a data scientist to build and optimize a website that promotes your book, and you have started several ad campaigns on a popular search engine in order to drive traffic to your site. Using your skills in data munging and statistical analysis, you will be asked to evaluate the performance of a series of campaigns directed towards site visitors using the log data in Hadoop as your source of truth.

Problem 3: WINKLR
WINKLR is a curiously popular social network for fans of the 1970s sitcom Happy Days. Users can post photos, write messages, and, most importantly, follow each other’s posts. This helps members keep up with new content from their favorite users. To help its users discover new people to follow on the site, WINKLR is building a new machine learning system called The Fonz to predict who a given user might like to follow. Phase One of The Fonz project is underway. The engineers can export the entire user graph as tuples. You have joined the Fonz project to implement Phase Two, which improves on this result. Given the user graph and the list of frequent-click tuples, you are being asked to select a 70,000 tuple subset in “user1,user2” format, where you believe user1 is mostly likely to want to follow user2. These will result in emails to the users, inviting them to follow the recommended user.

Prize for success: CCP: Data Scientist status

Great way to start 2015!

I first saw this in a tweet by Sarah.

September 10, 2014

ETL: The Dirty Little Secret of Data Science

Filed under: Data Science,ETL — Patrick Durusau @ 3:01 pm

ETL: The Dirty Little Secret of Data Science by Byron Ruth.

From the description:

“There is an adage that given enough data, a data scientist can answer the world’s questions. The untold truth is that the majority of work happens during the ETL and data preprocessing phase. In this talk I discuss Origins, an open source Python library for extracting and mapping structural metadata across heterogenous data stores.”

More than your usual ETL presentation, Byron makes several points of interest to the topic map community:

  • “domain knowledge” is necessary for effective ETL
  • “domain knowledge” changes and fades from dis-use
  • ETL isn’t transparent to consumers of data resulting from ETL, a “black box”
  • Data provenance is the answer to transparency, changing domain knowledge and persisting domain knowledge
  • “Provenance is a record that describes the people, institutions, entities, and activities, involved in producing, influencing, or delivering a piece of data or a thing.”
  • Project Origins, captures metadata and structures from backends and persists it to Neo4j

Great focus on provenance but given the lack of merging in Neo4j, the collation of information about a common subject, with different names, is going to be a manual process.

Follow @thedevel.

August 21, 2014

Data Carpentry (+ Sorted Nordic Scores)

Filed under: Data Mining,Data Science — Patrick Durusau @ 7:03 pm

Data Carpentry by David Mimno.

From the post:

The New York Times has an article titled For Big-Data Scientists, ‘Janitor Work’ Is Key Hurdle to Insights. Mostly I really like it. The fact that raw data is rarely usable for analysis without significant work is a point I try hard to make with my students. I told them “do not underestimate the difficulty of data preparation”. When they turned in their projects, many of them reported that they had underestimated the difficulty of data preparation. Recognizing this as a hard problem is great.

What I’m less thrilled about is calling this “janitor work”. For one thing, it’s not particularly respectful of custodians, whose work I really appreciate. But it also mischaracterizes what this type of work is about. I’d like to propose a different analogy that I think fits a lot better: data carpentry.

Note: data carpentry seems to already be a thing

I’m not convinced that “carpentry” is the best prestige target.

The first mention of carpenters on a sorted version of the Nordic Scores (Colorado Adoption Project: Resources for Researchers. Institute for Behavioral Genetics, University of Colorado Boulder) is at 147.*

I would go for data scientist since mercenary isn’t listed as an occupation. 😉

The usual cautions apply. Prestige is as difficult or perhaps more so to measure than any other social construct. The data is from 1989 and so may not reflect “current” prestige rankings.

*(I have removed the classes and sorted by prestige score, to create Sorted Nordic Scores.)

August 18, 2014

Data Science at the Command Line [Webcast Weds. 20 Aug. 2014]

Filed under: Data Science — Patrick Durusau @ 6:18 pm

Data Science at the Command Line by Jeroen Janssens.

From the post:

Data Science at the Command Line is a new book written by Jeroen Janssens. This website currently contains information about this Wednesday’s webcast, instructions on how to install the Data Science Toolbox, and an overview of all the command-line tools discussed in the book.

I count eighty-one (81) command line tools listed with short explanations. That alone makes it worth visiting the page.

BTW, there is a webcast Wednesday:

On August 20, 2014 at 17:00 UTC, I’ll be doing a two-hour webcast hosted by O’Reilly Media. Attendance is free, but you do need to sign up. This event will be recorded and shared afterwards.

During this hands-on webcast, you’ll be able to interact not only with me, but also with other attendants. (So far, about 1200 people have signed up!) This means that in two hours, you can learn a lot about how to use the command line for doing data science.

Enjoy!

I first saw this in a tweet by Stat Fact.

August 15, 2014

Data Science (StackExchange Beta)

Filed under: Data Science — Patrick Durusau @ 4:31 pm

Data Science

Data science has a StackExchange in beta!

A great place to demonstrate your data science chops!

I first saw this in a tweet by Christophe Lalanne.

August 6, 2014

Data Science Cheat Sheet

Filed under: Data Science — Patrick Durusau @ 2:14 pm

Data Science Cheat Sheet by Vincent Granville.

Vincent has resources and suggestions in eleven (11) different categories:

  1. Hardware
  2. Linux environment on Windows laptop
  3. Basic UNIX commands
  4. Scripting language
  5. R language
  6. Advanced Excel
  7. Visualization
  8. Machine Learning
  9. Projects
  10. Data Sets
  11. Miscellaneous

The only suggestion where I depart company from Vincent is on hardware and OS. I prefer *nix as an OS and run Windows on a VM.

A good starting set of suggestions until you develop your own preferences.

August 5, 2014

Dangerous Data Democracy

Filed under: Data,Data Science — Patrick Durusau @ 7:03 pm

K-Nearest Neighbors: dangerously simple by Cathy O’Neil (aka mathbabe).

From the post:

I spend my time at work nowadays thinking about how to start a company in data science. Since there are tons of companies now collecting tons of data, and they don’t know what do to do with it, nor who to ask, part of me wants to design (yet another) dumbed-down “analytics platform” so that business people can import their data onto the platform, and then perform simple algorithms themselves, without even having a data scientist to supervise.

After all, a good data scientist is hard to find. Sometimes you don’t even know if you want to invest in this whole big data thing, you’re not sure the data you’re collecting is all that great or whether the whole thing is just a bunch of hype. It’s tempting to bypass professional data scientists altogether and try to replace them with software.

I’m here to say, it’s not clear that’s possible. Even the simplest algorithm, like k-Nearest Neighbor (k-NN), can be naively misused by someone who doesn’t understand it well. Let me explain.

Cathy’s post is a real hoot! You may not roll out of your chair but memories of prior similar episodes will flash by.

She makes a compelling case that the “democratization of data science” effort is not only mis-guided, it is dangerous to boot. Dangerous at least to users who take advantage of data democracy services.

Or should I say that data democracy services are taking advantage of users? 😉

The only reason to be concerned is that users may blame data science rather than their own incompetence with data tools for their disasters. (That seems like the most likely outcome.)

Suggested counters to the “data democracy for everyone” rhetoric?

PS: Sam Hunting reminded me of this post from Cathy O’Neil.

August 2, 2014

Data Science Master

Open Source Data Science Master – The Plan by Fras and Sabine.

From the post:

Free!! education platforms have put some of the world’s most prestigious courses online in the last few years. This is our plan to use these and create our own custom open source data science Master.

Free online courses are selected to cover: Data Manipulation, Machine Learning & Algorithms, Programming, Statistics, and Visualization.

Be sure to take know of the pre-requisites the authors completed before embarking on their course work.

No particular project component is suggested because the course work will suggest ideas.

What other choices would you suggest? Either for broader basics or specialization?

July 28, 2014

Processing 3.0a1

Filed under: Data Science,Scalding — Patrick Durusau @ 10:51 am

Processing 3.0a1

From the description:

3.0a1 (26 July 2014) Win 32 / Win 64 / Linux 32 / Linux 64 / Mac OS X.

The revisions cover incremental changes between releases, and are especially important to read for pre-releases.

From the revisions:

Kicking off the 3.0 release process. The focus for Processing 3 is improving the editor and the coding process, so we’ll be integrating what was formerly PDE X as the main editor.

This release also includes a number of bug fixes and changes, based on in-progress Google Summer of Code projects and a few helpful souls on Github.

Please contribute to the Processing 3 release by testing and reporting bugs. Or better yet, helping us fix them and submitting pull requests.

In case you are unfamiliar with Processing:

Processing is a programming language, development environment, and online community. Since 2001, Processing has promoted software literacy within the visual arts and visual literacy within technology. Initially created to serve as a software sketchbook and to teach computer programming fundamentals within a visual context, Processing evolved into a development tool for professionals. Today, there are tens of thousands of students, artists, designers, researchers, and hobbyists who use Processing for learning, prototyping, and production.

Enjoy!

June 4, 2014

Python for Data Science

Filed under: Data Science,Python — Patrick Durusau @ 6:37 pm

Python for Data Science by Joe McCarthy.

From the post:

This short primer on Python is designed to provide a rapid “on-ramp” to enable computer programmers who are already familiar with concepts and constructs in other programming languages learn enough about Python to facilitate the effective use of open-source and proprietary Python-based machine learning and data science tools.

Uses an IPython Notebook for delivery.

This is a tutorial you will want to pass on to others! Or emulate if you want to cover another language or subject.

I first saw this in a tweet by Tom Brander.

May 8, 2014

Fifteen ideas about data validation (and peer review)

Filed under: Data Quality,Data Science — Patrick Durusau @ 7:11 pm

Fifteen ideas about data validation (and peer review)

From the post:

Many open issues drift around data publication, but validation is both the biggest and the haziest. Some form of validation at some stage in a data publication process is essential; data users need to know that they can trust the data they want to use, data creators need a stamp of approval to get credit for their work, and the publication process must avoid getting clogged with unusable junk. However, the scientific literature’s validation mechanisms don’t translate as directly to data as its mechanism for, say, citation.

This post is in part a very late response to a data publication workshop I attended last February at the International Digital Curation Conference (IDCC). In a breakout discussion of models for data peer review, there were far more ideas about data review than time to discuss them. Here, for reference purposes, is a longish list of non-parallel, sometimes-overlapping ideas about how data review, validation, or quality assessment could or should work. I’ve tried to stay away from deeper consideration of what data quality means (which I’ll discuss in a future post) and from the broader issues of peer review associated with the literature, but they inevitably pop up anyway.

A good starting point for discussion of data validation concerns.

Perfect data would be preferred but let’s accept that perfect data is possible only for trivial or edge cases.

If you start off by talking about non-perfect data, it may be easier to see some of the consequences for when having non-perfect data makes a system fail. What are the consequences of that failure? For the data owner as well as others? Are those consequences acceptable?

Make those decisions up front and documented as part of planning data validation.

April 27, 2014

The Deadly Data Science Sin of Confirmation Bias

Filed under: Confidence Bias,Data Science,Statistics — Patrick Durusau @ 4:06 pm

The Deadly Data Science Sin of Confirmation Bias by Michael Walker.

From the post:

confirmation

Confirmation bias occurs when people actively search for and favor information or evidence that confirms their preconceptions or hypotheses while ignoring or slighting adverse or mitigating evidence. It is a type of cognitive bias (pattern of deviation in judgment that occurs in particular situations – leading to perceptual distortion, inaccurate judgment, or illogical interpretation) and represents an error of inductive inference toward confirmation of the hypothesis under study.

Data scientists exhibit confirmation bias when they actively seek out and assign more weight to evidence that confirms their hypothesis, and ignore or underweigh evidence that could disconfirm their hypothesis. This is a type of selection bias in collecting evidence.

Note that confirmation biases are not limited to the collection of evidence: even if two (2) data scientists have the same evidence, their respective interpretations may be biased. In my experience, many data scientists exhibit a hidden yet deadly form of confirmation bias when they interpret ambiguous evidence as supporting their existing position. This is difficult and sometimes impossible to detect yet occurs frequently.

Isn’t that a great graphic? Michael goes on to list several resources that will help in spotting confirmation bias, yours and that of others. Not 1005 but you will do better heeding his advice.

Be aware that the confirmation bias isn’t confined to statistical and/or data science methods. Decision makers, topic map authors, fact gatherers, etc. are all subject to confirmation bias.

Michael sees confirmation bias as dangerous to the credibility of data science, writing:

The evidence suggests confirmation bias is rampant and out of control in both the hard and soft sciences. Many academic or research scientists run thousands of computer simulations where all fail to confirm or verify the hypothesis. Then they tweak the data, assumptions or models until confirmatory evidence appears to confirm the hypothesis. They proceed to publish the one successful result without mentioning the failures! This is unethical, may be fraudulent and certainly produces flawed science where a significant majority of results can not be replicated. This has created a loss or confidence and credibility for science by the public and policy makers that has serious consequences for our future.
.
The danger for professional data science practitioners is providing clients and employers with flawed data science results leading to bad business and policy decisions. We must learn from the academic and research scientists and proactively avoid confirmation bias or data science risks loss of credibility.

I don’t think bad business and policy decisions need any help from “flawed data science.” You may recall that “policy makers” not all that many years ago dismissed a failure to find weapons of mass destruction, a key motivation for war, as irrelevant in hindsight.

My suggestion would be to make your data analysis as complete and accurate as possible and always keep digitally signed and encrypted copies of data and communications with your clients.

April 12, 2014

Prescription vs. Description

Filed under: Data Science,Ontology,Topic Maps — Patrick Durusau @ 10:59 am

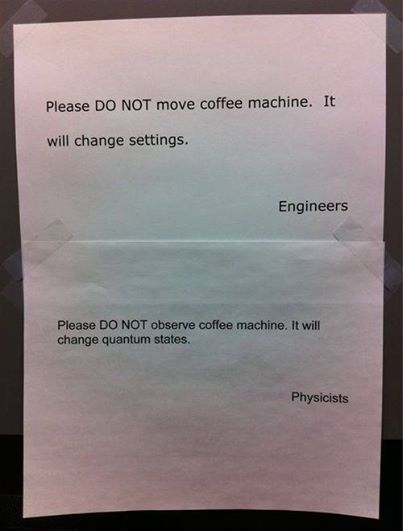
Kurt Cagle posted this image on Facebook:

engineers-vs-physicists

with this comment:

The difference between INTJs and INTPs in a nutshell. Most engineers, and many programmers, are INTJs. Theoretical scientists (and I’m increasingly putting data scientists in that category) are far more INTPs – they are observers trying to understand why systems of things work, rather than people who use that knowledge to build, control or constrain those systems.

I would rephrase the distinction to be one of prescription (engineers) versus description (scientists) but that too is a false dichotomy.

You have to have some real or imagined description of a system to start prescribing for it and any method for exploring a system has some prescriptive aspects.

The better course is to recognize exploring or building systems has some aspects of both. Making that recognition, may (or may not) make it easier to discuss assumptions of either perspective that aren’t often voiced.

Being more from the descriptive side of the house, I enjoy pointing out that behind most prescriptive approaches are software and services to help you implement those prescriptions. Hardly seems like an unbiased starting point to me. 😉

To be fair, however, the descriptive side of the house often has trouble distinguishing between important things to describe and describing everything it can to system capacity, for fear of missing some edge case. The “edge” cases may be larger than the system but if they lack business justification, pragmatics should reign over purity.

Or to put it another way: Prescription alone is too brittle and description alone is too endless.

Effective semantic modeling/integration needs to consist of varying portions of prescription and description depending upon the requirements of the project and projected ROI.

PS: The “ROI” of a project not in your domain, that doesn’t use your data, your staff, etc. is not a measure of the potential “ROI” for your project. Crediting such reports is “ROI” for the marketing department that created the news. Very important to distinguish “your ROI” from “vendor’s ROI.” Not the same thing. If you need help with that distinction, you know where to find me.

March 19, 2014

Podcast: Thinking with Data

Filed under: Data,Data Analysis,Data Science — Patrick Durusau @ 1:39 pm

Podcast: Thinking with Data: Data tools are less important than the way you frame your questions by Jon Bruner.

From the description:

Max Shron and Jake Porway spoke with me at Strata a few weeks ago about frameworks for making reasoned arguments with data. Max’s recent O’Reilly book, Thinking with Data, outlines the crucial process of developing good questions and creating a plan to answer them. Jake’s nonprofit, DataKind, connects data scientists with worthy causes where they can apply their skills.

Curious if you agree with Max that data tools are “mature?”

Certainly better than they were when I was an undergraduate in political science but measuring sentiment was a current topic even then. 😉

And the controversy of tools versus good questions isn’t a new one either.

To his credit, Max does credit decades of discussion of rhetoric and thinking as helpful in this area.

For you research buffs, any pointers to prior tools versus good questions debates? (Think sociology/political science in the 1970s to date. It’s a recurring theme.)

I first saw this in a tweet by Mike Loukides.

March 10, 2014

Data Science 101: Deep Learning Methods and Applications

Filed under: Data Science,Deep Learning,Machine Learning,Microsoft — Patrick Durusau @ 7:56 pm

Data Science 101: Deep Learning Methods and Applications by Daniel Gutierrez.

From the post:

Microsoft Research, the research arm of the software giant, is a hotbed of data science and machine learning research. Microsoft has the resources to hire the best and brightest researchers from around the globe. A recent publication is available for download (PDF): “Deep Learning: Methods and Applications” by Li Deng and Dong Yu, two prominent researchers in the field.

Deep sledding with twenty (20) pages of bibliography and pointers to frequently updated lists of resources (at page 8).

You did say you were interested in deep learning. Yes? 😉

Enjoy!

« Newer PostsOlder Posts »

Powered by WordPress