I am seriously considering writing up something similar for technical standards.
Suggestions?
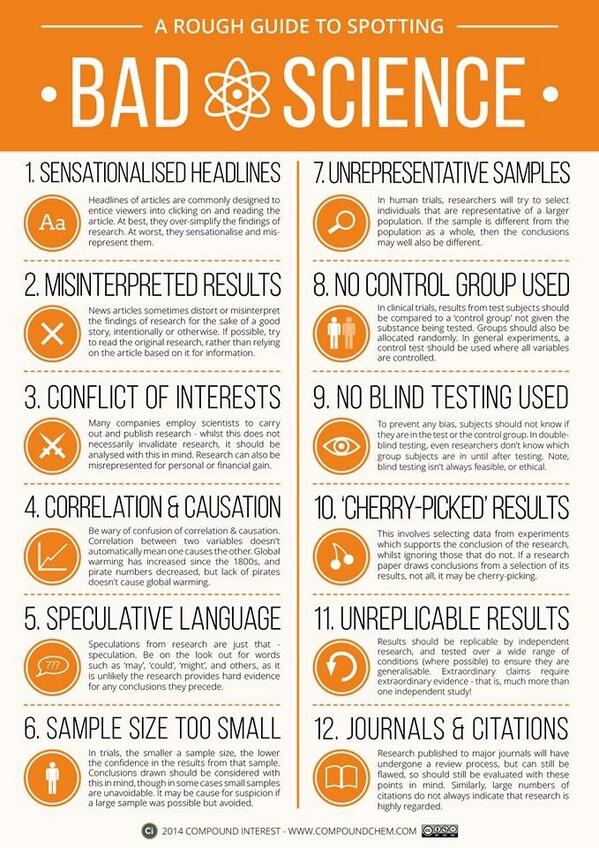
I saw this in a tweet by Kyle Dennis.
I am seriously considering writing up something similar for technical standards.
Suggestions?
I saw this in a tweet by Kyle Dennis.
Molpher: a software framework for systematic chemical space exploration by David Hoksza, Petr Škoda, Milan Voršilák and Daniel Svozil.
Abstract:
Background
Chemical space is virtual space occupied by all chemically meaningful organic compounds. It is an important concept in contemporary chemoinformatics research, and its systematic exploration is vital to the discovery of either novel drugs or new tools for chemical biology.
Results
In this paper, we describe Molpher, an open-source framework for the systematic exploration of chemical space. Through a process we term ‘molecular morphing’, Molpher produces a path of structurally-related compounds. This path is generated by the iterative application of so-called ‘morphing operators’ that represent simple structural changes, such as the addition or removal of an atom or a bond. Molpher incorporates an optimized parallel exploration algorithm, compound logging and a two-dimensional visualization of the exploration process. Its feature set can be easily extended by implementing additional morphing operators, chemical fingerprints, similarity measures and visualization methods. Molpher not only offers an intuitive graphical user interface, but also can be run in batch mode. This enables users to easily incorporate molecular morphing into their existing drug discovery pipelines.
Conclusions
Molpher is an open-source software framework for the design of virtual chemical libraries focused on a particular mechanistic class of compounds. These libraries, represented by a morphing path and its surroundings, provide valuable starting data for future in silico and in vitro experiments. Molpher is highly extensible and can be easily incorporated into any existing computational drug design pipeline.
Beyond its obvious importance for cheminformatics, this paper offers another example of “semantic impedance:”
While virtual chemical space is very large, only a small fraction of it has been reported in actual chemical databases so far. For example, PubChem contains data for 49.1 million chemical compounds [17] and Chemical Abstracts consists of over 84.3 million organic and inorganic substances [18] (numbers as of 12. 3. 2014). Thus, the navigation of chemical space is a very important area of chemoinformatics research [19,20]. Because chemical space is usually defined using various sets of descriptors [21], a major problem is the lack of invariance of chemical space [22,23]. Depending on the descriptors and distance measures used [24], different chemical spaces show different compound distributions. Unfortunately, no generally applicable representation of invariant chemical space has yet been reported [25].
OK, so how much further is there to go with these various descriptors?
The article describes estimates of the size of chemical space this way:
Chemical space is populated by all chemically meaningful and stable organic compounds [1-3]. It is an important concept in contemporary chemoinformatics research [4,5], and its exploration leads to the discovery of either novel drugs [2] or new tools for chemical biology [6,7]. It is agreed that chemical space is huge, but no accurate approximation of its size exists. Even if only drug-like molecules are taken into account, size estimates vary [8] between 1023[9] and 10100[10] compounds. However, smaller numbers have also been reported. For example, based on the growth of a number of organic compounds in chemical databases, Drew et al.[11] deduced the size of chemical space to be 3.4 × 10⁹. By assigning all possible combinations of atomic species to the same three-dimensional geometry, Ogata et al. [12] estimated the size of chemical space to be between 108 and 1019. Also, by analyzing known organic substituents, the size of accessible chemical space was assessed as between 1020 and 1024[9].
Such estimates have been put into context by Reymond et al., who produced all molecules that can exist up to a certain number of heavy atoms in their Chemical Universe Databases: GDB-11 [13,14] (2.64 × 10⁷ molecules with up to 11 heavy atoms); GDB-13 [15] (9.7 × 10⁸ molecules with up to 13 heavy atoms); and GDB-17 [16] (1.7 × 10¹¹ compounds with up to 17 heavy atoms). The GDB-17 database was then used to approximate the number of possible drug-like molecules as 1033[8].
To give you an easy basis for comparison: possible drug-like molecules at 1033, versus number of stars in galaxies in the observable universe at 1024.
That’s an impressive number of possible drug like molecules. 109 more than stars in the observable universe (est.).
I can’t imagine that having diverse descriptors is assisting in the search to complete the chemical space. And from the description, it doesn’t sound like semantic convergence in one the horizon.
Mapping between the existing systems would be a major undertaking but the longer exploration goes on without such a mapping, the problem is only going to get worse.
Citizen Science and the Modern Web – Talk by Amit Kapadia by Bruce Berriman.
From the post:
Amit Kapadia gave this excellent talk at CERN on Citizen Science and The Modern Web. From Amit’s abstract: “Beginning as a research project to help scientists communicate, the Web has transformed into a ubiquitous medium. As the sciences continue to transform, new techniques are needed to analyze the vast amounts of data being produced by large experiments. The advent of the Sloan Digital Sky Survey increased throughput of astronomical data, giving rise to Citizen Science projects such as Galaxy Zoo. The Web is no longer exclusively used by researchers, but rather, a place where anyone can share information, or even, partake in citizen science projects.
As the Web continues to evolve, new and open technologies enable web applications to become more sophisticated. Scientific toolsets may now target the Web as a platform, opening an application to a wider audience, and potentially citizen scientists. With the latest browser technologies, scientific data may be consumed and visualized, opening the browser as a new platform for scientific analysis.”
Bruce points to the original presentation here.
The emphasis is on astronomy but many good points on citizen science.
Curious if citizen involvement in the sciences and humanities could lead to greater awareness and support for them?
Ontology work at the Royal Society of Chemistry by Antony Williams.
From the description:
We provide an overview of the use we make of ontologies at the Royal Society of Chemistry. Our engagement with the ontology community began in 2006 with preparations for Project Prospect, which used ChEBI and other Open Biomedical Ontologies to mark up journal articles. Subsequently Project Prospect has evolved into DERA (Digitally Enhancing the RSC Archive) and we have developed further ontologies for text markup, covering analytical methods and name reactions. Most recently we have been contributing to CHEMINF, an open-source cheminformatics ontology, as part of our work on disseminating calculated physicochemical properties of molecules via the Open PHACTS. We show how we represent these properties and how it can serve as a template for disseminating different sorts of chemical information.
A bit wordy for my taste but it has numerous references and links to resources. Top stuff!
I had to laugh when I read slide #20:
Why a named reaction ontology?
Despite attempts to introduce systematic nomenclature for organic reactions, lots of chemists still prefer to attach human names.
Those nasty humans! Always wanting “human” names. Grrr! 😉
Afraid so. That is going to continue in a number of disciplines.
When I got to slides #29:
Ontologies as synonym sets for text-mining
it occurred to me that terms in an ontology are like base names in a topic map, in topics with associations with other topics, which also have base name.
The big difference being that ontologies are mono-views that don’t include mapping instructions based on properties in starting ontology or any other ontology to which you could map.
That is the ontologies I have seen can only report properties of their terms and not which properties must be matched to be the same subject.
Nor do such ontologies report properties of the subjects that are their properties. Much less any mappings from bundles of properties to bundles of properties in other ontologies.
I know the usual argument about combinatorial explosion of mappngs, etc., which leaves ontologists with too few arms and legs to point in the various directions.
That argument fails to point out that to have an “uber” ontology, someone has to do the mapping (undisclosed) from variants to the new master ontology. And, they don’t write that mapping down.
So the combinatorial explosion was present, it just didn’t get written down. Can you guess who is empowered as an expert in the new master ontology with undocumented mappings?
The other fallacy in that argument is that topic maps, for example, are always partial world views. I can map as much or as little between ontologies, taxonomies, vocabularies, folksonomies, etc. as I care to do.
If I don’t want to bother mapping “thing” as the root of my topic map, I am free to omit it. All the superstructure clutter goes away and I can focus on immediate ROI concerns.
Unless you want to pay for the superstructure clutter then by all means, I’m interested! 😉
If you have an ontology, by all means use it as a starting point for your topic map. Or if someone is willing to pay to create yet another ontology, do it. But if they need results before years of travel, debate and bad coffee, give topic maps a try!
PS: The travel, debate and bad coffee never go away for ontologies, even successful ones. Despite the desires of many, the world keeps changing and our views of it along with it. A static ontology is a dead ontology. Same is true for a topic map, save that agreement on its content is required only as far as it is used and no further.
International Plant Names Index
What a great resource to find as we near Spring!
From the webpage:
The International Plant Names Index (IPNI) is a database of the names and associated basic bibliographical details of seed plants, ferns and lycophytes. Its goal is to eliminate the need for repeated reference to primary sources for basic bibliographic information about plant names. The data are freely available and are gradually being standardized and checked. IPNI will be a dynamic resource, depending on direct contributions by all members of the botanical community.
I entered the first plant name that came to mind: Peyote.
No “hits.” ?
Wikipedia gives Peyote’s binomial name as: Lophophora williamsii (think synonym).*
Searching on Lophophora williamsii, I got three (3) “hits.”
Had I bothered to read the FAQ before searching:
10. Can I use IPNI to search by common (vernacular) name?
No. IPNI does not include vernacular names of plants as these are rarely formally published. If you are looking for information about a plant for which you only have a common name you may find the following resources useful. (Please note that these links are to external sites which are not maintained by IPNI)
- The Royal Horticultural Society Plant Finder is a useful site for cultivar names
- Horticopia is a source of horticulutural plant information. You can browse plant lists but full information is available by subscription.
- SEPASAL contains information on useful plants from arid and semi-arid lands, and allows searches by vernacular names from many countries
- Raintree has alphabetical lists of common and scientific names of rainforest plants
- The USDA’s Plants database has common names for plants from the US
- Multilingual Multiscript Plant Name Database is searchable in any language and script and holds a lot of information including an index of medicinal plants
- For a reference book including many English vernacular names try Mabberley’s Plant-Book, A Portable Dictionary of Plants, their Classifications, and Uses, 3rd Edition by D.J.Mabberley (Cambridge University Press, 2008)
I understand the need to specialize in one form of names but “formally published” means that without a useful synonyms list, the general public has an additional burden to access publicly funded research results.
Even with a synonym list there is an additional burden because you have to look up terms in the list, then read the text with that understanding and then back to the synonym list again.
What would dramatically increase public access to publicly funded research would be to have a specialized synonym list for publications that transposes the jargon in articles to selected sets of synonyms. Would not be as precise or grammatical as the original, but it would allow the reading pubic to get a sense of even very technical research.
That could be a way to hitch topic maps to the access to publicly funded data band wagon.
Thoughts?
I first saw this in a tweet by Bill Baker.
* A couple of other fun facts from Wikipedia on Peyote: 1. It’s conservation status is listed as “apparently secure,” and 2. Wikipedia has photos of Peyote “in the wild.” I suppose saying “Peyote growing in a pot” would raise too many questions.
Metaphysicians: Sloppy researchers beware. A new institute has you in its sights
From the post:
“WHY most published research findings are false” is not, as the title of an academic paper, likely to win friends in the ivory tower. But it has certainly influenced people (including journalists at The Economist). The paper it introduced was published in 2005 by John Ioannidis, an epidemiologist who was then at the University of Ioannina, in Greece, and is now at Stanford. It exposed the ways, most notably the overinterpreting of statistical significance in studies with small sample sizes, that scientific findings can end up being irreproducible—or, as a layman might put it, wrong.
Dr Ioannidis has been waging war on sloppy science ever since, helping to develop a discipline called meta-research (ie, research about research). Later this month that battle will be institutionalised, with the launch of the Meta-Research Innovation Centre at Stanford.
METRICS, as the new laboratory is to be known for short, will connect enthusiasts of the nascent field in such corners of academia as medicine, statistics and epidemiology, with the aim of solidifying the young discipline. Dr Ioannidis and the lab’s co-founder, Steven Goodman, will (for this is, after all, science) organise conferences at which acolytes can meet in the world of atoms, rather than just online. They will create a “journal watch” to monitor scientific publishers’ work and to shame laggards into better behaviour. And they will spread the message to policymakers, governments and other interested parties, in an effort to stop them making decisions on the basis of flaky studies. All this in the name of the centre’s nerdishly valiant mission statement: “Identifying and minimising persistent threats to medical-research quality.”
Someone after my own heart! 😉
I spent a large portion of today proofing standards drafts and the only RFC that was cited correctly was one that I wrote for the template they were using. (Hence the low blogging output for today.)
It really isn’t that difficult to check references, to not cite obsoleted materials, to cite relevant materials, etc.
Or, at least I don’t think that it is.
You?
AntWeb by rOpenScience.
From the webpage:
AntWeb s a repository of ant specimen records maintained by the California Academy of Sciences. From the website’s description:
AntWeb is the world’s largest online database of images, specimen records, and natural history information on ants. It is community driven and open to contribution from anyone with specimen records, natural history comments, or images.
Resources
An R wrapper for the AntWeb API.
Listing functions + descriptions:
Doesn’t hurt to have a few off-beat data sets at your command. Can’t tell when someone’s child will need help with a science fair project, etc.
PS: I did resist the temptation to list this post under “bugs.”
The 365 Days Of Astronomy Will Continue Its Quest In 2014.
From the post:
365 Days of Astronomy will continue its service in 2014! This time we will have more days available for new audio. Have something to share? We’re looking for content from 10 minutes long up to an hour!
Since 2009, 365 Days of Astronomy has brought a new podcast every day to astronomy lovers around the world to celebrate the International Year of Astronomy. Fortunately, the project has continued until now and we will keep going for another year in 2014. This means we will continue to serve you for a 6th year.
Through these years, 365 Days Of Astronomy has been delivering daily podcasts discussing various topics in the constantly changing realm of astronomy. These include history of astronomy, the latest news, observing tips and topics on how the fundamental knowledge in astronomy has changed our paradigms of the world. We’ve also asked people to talk about the things that inspired them, and to even share their own stories, both of life doing astronomy and science fiction that got them imagining a more scientific future.
365 Days of Astronomy is a community podcast that relies on a network of dedicated podcasters across the globe who are willing to share their knowledge and experiences in astronomy with the world and it will continue that way. In 2013, 365 Days of Astronomy started a new initiative with CosmoQuest. We now offer great new audio every weekend, while on weekdays we serve up interesting podcasts from CosmoQuest and other dedicated partners. We also have several monthly podcasts from dedicated podcasters and have started two new series: Space Stories and Space Scoop. The former is a series of science fiction tales, and the latter is an astronomy news segment for children.
…
For more information please visit:
email: info@365daysofastronomy.org
365 Days of Astronomy: http://cosmoquest.org/blog/365daysofastronomy/
Astrosphere New Media: http://www.astrosphere.org/
Join in as podcaster: http://cosmoquest.org/blog/365daysofastronomy/join-in/
Donate to our media program : http://cosmoquest.org/blog/365daysofastronomy/donate/
If you or someone you know finds a telecope tomorrow or is already an active amateur astronomer, they may be interested in these podcasts.
Astronomy had “big data” before “big data” was a buzz word. It has a common coordinate system but how people talk about particular coordinates varies greatly. (Can you say: Needs semantic integration?)
It’s a great hobby with opportunities to explore professional data if you are interested.
I mention it because a topic map without interesting data isn’t very interesting.
First steps towards semantic descriptions of electronic laboratory notebook records by Simon J Coles, Jeremy G Frey, Colin L Bird, Richard J Whitby and Aileen E Day.
Abstract:
In order to exploit the vast body of currently inaccessible chemical information held in Electronic Laboratory Notebooks (ELNs) it is necessary not only to make it available but also to develop protocols for discovery, access and ultimately automatic processing. An aim of the Dial-a-Molecule Grand Challenge Network is to be able to draw on the body of accumulated chemical knowledge in order to predict or optimize the outcome of reactions. Accordingly the Network drew up a working group comprising informaticians, software developers and stakeholders from industry and academia to develop protocols and mechanisms to access and process ELN records. The work presented here constitutes the first stage of this process by proposing a tiered metadata system of knowledge, information and processing where each in turn addresses a) discovery, indexing and citation b) context and access to additional information and c) content access and manipulation. A compact set of metadata terms, called the elnItemManifest, has been derived and caters for the knowledge layer of this model. The elnItemManifest has been encoded as an XML schema and some use cases are presented to demonstrate the potential of this approach.
And the current state of electronic laboratory notebooks:
It has been acknowledged at the highest level [15] that “research data are heterogeneous, often classified and cited with disparate schema, and housed in distributed and autonomous databases and repositories. Standards for descriptive and structural metadata will help establish a common framework for understanding data and data structures to address the heterogeneity of datasets.” This is equally the case with the data held in ELNs. (citing: 15. US National Science Board report, Digital Research Data Sharing and Management, Dec 2011 Appendix F Standards and interoperability enable data-intensive science. http://www.nsf.gov/nsb/publications/2011/nsb1124.pdf, accessed 10/07/2013.)
It is trivially true that: “…a common framework for understanding data and data structures …[would] address the heterogeneity of datasets.”
Yes, yes a common framework for data and data structures would solve the heterogeneity issues with datasets.
What is surprising is that no one had that idea up until now. 😉
I won’t recite the history of failed attempts at common frameworks for data and data structures here. To the extent that communities do adopt common practices or standards, those do help. Unfortunately there have never been any universal ones.
Or should I say there have never been any proposals for universal frameworks that succeeded in becoming universal? That’s more accurate. We have not lacked for proposals for universal frameworks.
That isn’t to say this is a bad proposal. But it will be only one of many proposals for the integration of electronic laboratory notebook records, leaving the task of integration between systems for integration left to be done.
BTW, if you are interested in further details, see the article and the XML schema at: http://www.dial-a-molecule.org/wp/blog/2013/08/elnitemmanifest-a-metadata-schema-for-accessing-and-processing-eln-records/.
From the post:
NOAA has released the 2013 World Ocean Database, the largest, most comprehensive collection of scientific information about the oceans, with records dating as far back as 1772. The 2013 database updates the 2009 version and contains nearly 13 million temperature profiles, compared with 9.1 in the 2009 database, and just fewer than six million salinity measurements, compared with 3.5 in the previous database. It integrates ocean profile data from approximately 90 countries around the world, collected from buoys, ships, gliders, and other instruments used to measure the “pulse” of the ocean.
Profile data of the ocean are measurements taken at many depths, from the surface to the floor, at a single location, during the time it takes to lower and raise the measuring instruments through the water. “This product is a powerful tool being used by scientists around the globe to study how changes in the ocean can impact weather and climate,” said Tim Boyer, an oceanographer with NOAA’s National Oceanographic Data Center.
In addition to using the vast amount of temperature and salinity measurements to monitor changes in heat and salt content, the database captures other measurements, including: oxygen, nutrients, chlorofluorocarbons and chlorophyll, which all reveal the oceans’ biological structure.
For the details on this dataset see: WOD Introduction.
The introduction notes under 1.1.5 Data Fusion:
It is not uncommon in oceanography that measurements of different variables made from the same sea water samples are often maintained as separate databases by different principal investigators. In fact, data from the same oceanographic cast may be located at different institutions in different countries. From its inception, NODC recognized the importance of building oceanographic databases in which as much data from each station and each cruise as possible are placed into standard formats, accompanied by appropriate metadata that make the data useful to future generations of scientists. It was the existence of such databases that allowed the International Indian Ocean Expedition Atlas (Wyrtki, 1971) and Climatological Atlas of the World Ocean (Levitus, 1982) to be produced without the time-consuming, laborious task of gathering data from many different sources. Part of the development of WOD13 has been to expand this data fusion activity by increasing the number of variables that NODC/WDC makes available as part of standardized databases.
As the NODC (National Oceanographic Data Center) demonstrates, it is possible to curate data sources in order to present a uniform data collection.
But curated data set remains inconsistent with data sets not curated by the same authority.
And combining curated data with non-curated data requires effort with the curated data, again.
Hard to map towards a destination without knowing its location.
Topic maps can capture the basis for curation, which will enable faster and more accurate integration of foreign data sets in the future.
From the webpage:
At rOpenSci we are creating packages that allow access to data repositories through the R statistical programming environment that is already a familiar part of the workflow of many scientists. We hope that our tools will not only facilitate drawing data into an environment where it can readily be manipulated, but also one in which those analyses and methods can be easily shared, replicated, and extended by other researchers. While all the pieces for connecting researchers with these data sources exist as disparate entities, our efforts will provide a unified framework that will be quickly connect researchers to open data.
More than twenty (20) R packages are available today!
Great for data mining your favorite science data repository, but that isn’t the only reason I mention them.
One of the issues for topic maps has always been how to produce the grist for a topic map mill. There is a lot of data and production isn’t a thrilling task. 😉
But what if we could automate that production, at least to a degree?
The search functions in Treebase offer several examples of auto-generation of semantics would benefit both the data set and potential users.
In Treebase: An R package for discovery, access and manipulation of online phylogenies Carl Boettiger and Duncan Temple Lang point out that Treebase has search functions for “author,” and “subject.”
Err, but Dublin Core 1.1 refers to authors as “creators.” And “subject,” for Treebase means: “Matches in the subject terms.”
The ACM would say “keywords,” as would many others, instead of “subject.”
Not a great semantic speed bump* but one that if left unnoticed, will result in poorer, not richer search results.
What if for an R package like Treebase, a user could request what is identified by a field?
That is in addition to the fields being returned, one or more key/value pairs are returned for each field, which define what is identified by that field.
For example, for “author” an --iden switch could return:
Author Semantics
Creator http://purl.org/dc/elements/1.1/creator
Author/Creator http://catalog.loc.gov/help/author-keyword.htm
and so on, perhaps even including identifiers in other languages.
While this step only addresses identifying what a field identifies, it would be a first step towards documenting identifiers that could be used over and over again to improve access to scientific data.
Future changes and we know there will be future changes, are accommodated by simply appending to the currently documented identifiers.
Document identifier mappings once, Reuse identifier mappings many times.
PS: The mapping I suggest above is a blind mapping, there is no information is given about “why” I thought the alternatives given were alternatives to the main entry “author.”
Blind mappings are sufficient for many cases but are terribly insufficient for others. Biological taxonomies, for example, do change and capturing what characteristics underlie a particular mapping may be important in terms of looking forwards or backwards from some point in time in the development of a taxonomy.
* I note for your amusement that Wikipedia offers “vertical deflection traffic calming devices,” as a class that includes “speed bump, speed hump, speed cushion, and speed table.”
Like many Library of Congress subject headings, “vertical deflection traffic calming devices” doesn’t really jump to mind when doing a search for “speed bump.” 😉
Ten Simple Rules for Reproducible Computational Research by Geir Kjetil Sandve, Anton Nekrutenko, James Taylor, Eivind Hovig. (Sandve GK, Nekrutenko A, Taylor J, Hovig E (2013) Ten Simple Rules for Reproducible Computational Research. PLoS Comput Biol 9(10): e1003285. doi:10.1371/journal.pcbi.1003285)
From the article:
Replication is the cornerstone of a cumulative science [1]. However, new tools and technologies, massive amounts of data, interdisciplinary approaches, and the complexity of the questions being asked are complicating replication efforts, as are increased pressures on scientists to advance their research [2]. As full replication of studies on independently collected data is often not feasible, there has recently been a call for reproducible research as an attainable minimum standard for assessing the value of scientific claims [3]. This requires that papers in experimental science describe the results and provide a sufficiently clear protocol to allow successful repetition and extension of analyses based on original data [4].
The importance of replication and reproducibility has recently been exemplified through studies showing that scientific papers commonly leave out experimental details essential for reproduction [5], studies showing difficulties with replicating published experimental results [6], an increase in retracted papers [7], and through a high number of failing clinical trials [8], [9]. This has led to discussions on how individual researchers, institutions, funding bodies, and journals can establish routines that increase transparency and reproducibility. In order to foster such aspects, it has been suggested that the scientific community needs to develop a “culture of reproducibility” for computational science, and to require it for published claims [3].
We want to emphasize that reproducibility is not only a moral responsibility with respect to the scientific field, but that a lack of reproducibility can also be a burden for you as an individual researcher. As an example, a good practice of reproducibility is necessary in order to allow previously developed methodology to be effectively applied on new data, or to allow reuse of code and results for new projects. In other words, good habits of reproducibility may actually turn out to be a time-saver in the longer run.
…
The rules:
Rule 1: For Every Result, Keep Track of How It Was Produced
Rule 2: Avoid Manual Data Manipulation Steps
Rule 3: Archive the Exact Versions of All External Programs Used
Rule 4: Version Control All Custom Scripts
Rule 5: Record All Intermediate Results, When Possible in Standardized Formats
Rule 6: For Analyses That Include Randomness, Note Underlying Random Seeds
Rule 7: Always Store Raw Data behind Plots
Rule 8: Generate Hierarchical Analysis Output, Allowing Layers of Increasing Detail to Be Inspected
Rule 9: Connect Textual Statements to Underlying Results
Rule 10: Provide Public Access to Scripts, Runs, and Results
To bring this a little closer to home, would another researcher be able to modify your topic map or RDF store with some certainty as to the result?
Or take over the maintenance/modification of a Hadoop ecosystem without hand holding by the current operator?
Being unable to answer either of those questions with “yes,” doesn’t show up as a line item in your current budget.
However, when the need to “reproduce” or modify your system becomes mission critical, it may be a budget (and job) busting event.
What’s your tolerance for job ending risk?
I forgot to mention I first saw this in “Ten Simple Rules for Reproducible Computational Research” – An Excellent Read for Data Scientists by Sean Murphy.
Publishing one’s research data : A new open Scientific Data journal
From the post:
A new Journal called ‘Scientific Data‘ to be launched by Nature in May 2014 has made a call for submissions. What makes this publication unique is that it is open-access, online-only publication for descriptions of scientifically valuable datasets, which aims to foster data sharing and reuse, and ultimately to accelerate the pace of scientific discovery.
…
From the journal homepage:
Launching in May 2014 and open now for submissions, Scientific Data is a new open-access, online-only publication for descriptions of scientifically valuable datasets, initially focusing on the life, biomedical and environmental science communities
Scientific Data exists to help you publish, discover and reuse research data and is built around six key principles:
- Credit: Credit, through a citable publication, for depositing and sharing your data
- Reuse: Complete, curated and standardized descriptions enable the reuse of your data
- Quality: Rigorous community-based peer review
- Discovery: Find datasets relevant to your research
- Open: Promotes and endorses open science principles for the use, reuse and distribution of your data, and is available to all through a Creative Commons license
- Service: In-house curation, rapid peer-review and publication of your data descriptions
Possibly an important source of scientific data in the not so distant future.
The Sokal Hoax: At Whom Are We Laughing? by by Mara Beller.
The philosophical pronouncements of Bohr, Born, Heisenberg and Pauli deserve some of the blame for the excesses of the postmodernist critique of science.
The hoax perpetrated by New York University theoretical physicist Alan Sokal in 1996 on the editors of the journal Social Text quickly became widely known and hotly debated. (See Physics Today January 1997, page 61, and March 1997, page 73.) “Transgressing the Boundaries – Toward a Transformative Hermeneutics of Quantum Gravity,” was the title of the parody he slipped past the unsuspecting editors. [1]
Many readers of Sokal’s article characterized it as an ingenious exposure of the decline of the intellectual standards in contemporary academia, and as a brilliant parody of the postmodern nonsense rampant among the cultural studies of science. Sokal’s paper is variously, so we read, “a hilarious compilation of pomo gibberish”, “an imitation of academic babble”, and even “a transformative hermeneutics of total bullshit”. [2] Many scientists reported having “great fun” and “a great laugh” reading Sokal’s article. Yet whom, exactly, are we laughing at?
As telling examples of the views Sokal satirized, one might quote some other statements. Consider the following extrapolation of Heisenberg’s uncertainty and Bohr’s complementarity into the political realm:
“The thesis ‘light consists of particles’ and the antithesis ‘light consists of waves’ fought with one another until they were united in the synthesis of quantum mechanics. …Only why not apply it to the thesis Liberalism (or Capitalism), the antithesis Communism, and expect a synthesis, instead of a complete and permanent victory for the antithesis? There seems to be some inconsistency. But the idea of complementarity goes deeper. In fact, this thesis and antithesis represent two psychological motives and economic forces, both justified in themselves, but, in their extremes, mutually exclusive. …there must exist a relation between the latitudes of freedom df and of regulation dr, of the type df dr=p. …But what is the ‘political constant’ p? I must leave this to a future quantum theory of human affairs.”
Before you burst out laughing at such “absurdities,” let me disclose the author: Max Born, one of the venerated founding fathers of quantum theory [3]. Born’s words were not written tongue in cheek; he soberly declared that “epistemological lessons [from physics] may help towards a deeper understanding of social and political relations”. Such was Born’s enthusiasm to infer from the scientific to the political realm, that he devoted a whole book to the subject, unequivocally titled Physics and Politics [3].
(…)
A helpful illustration that poor or confused writing, accepted on the basis of “authority,” is not limited to the humanities.
The weakness of postmodernism does not lie exclusively in:
While publicly abstaining from criticizing Bohr, many of his contemporaries did not share his peculiar insistence on the impossibility of devising new nonclassical concepts – an insistence that put rigid strictures on the freedom to theorize. It is on this issue that the silence of other physicists had the most far-reaching consequences. This silence created and sustained the illusion that one needed no technical knowledge of quantum mechanics to fully comprehend its revolutionary epistemological lessons. Many postmodernist critics of science have fallen prey to this strategy of argumentation and freely proclaimed that physics itself irrevoably banished the notion of objective reality.
The question of “objective reality” can be answered only within some universe of discourse, such as quantum mechanics for example.
There are no reports of “objective reality” or “subjective reality” that do not originate from some human speaker situated in a cultural, social, espistemological, etc., context.
Postmodernists, Stanley Fish comes to mind, should have made strong epistemological move to say that all reports, of whatever nature, from literature to quantum mechanics, are reports situated in human context.
The rules for acceptable argument vary from one domain to another.
But there is no “out there” where anyone stands to judge between domains.
Should anyone lay claim to an “out there,” you should feel free to ask how they escaped the human condition of context?
And for what purpose do they claim an “out there?”
I suspect you will find they are trying to privilege some form of argumentation or to exclude other forms of argument.
That is a question of motive and not of some “out there.”
I first saw this at Pete Warden’s Five short links.
Scientific Lenses over Linked Data: An approach to support task specifi c views of the data. A vision. by Christian Brenninkmeijer, Chris Evelo, Carole Goble, Alasdair J G Gray, Paul Groth, Steve Pettifer, Robert Stevens, Antony J Williams, and Egon L Willighagen.
Abstract:
Within complex scienti fic domains such as pharmacology, operational equivalence between two concepts is often context-, user- and task-specifi c. Existing Linked Data integration procedures and equivalence services do not take the context and task of the user into account. We present a vision for enabling users to control the notion of operational equivalence by applying scienti c lenses over Linked Data. The scientifi c lenses vary the links that are activated between the datasets which aff ects the data returned to the user.
Two additional quotes from this paper should convince you of the importance of this work:
We aim to support users in controlling and varying their view of the data by applying a scientifi c lens which govern the notions of equivalence applied to the data. Users will be able to change their lens based on the task and role they are performing rather than having one fixed lens. To support this requirement, we propose an approach that applies context dependent sets of equality links. These links are stored in a stand-off fashion so that they are not intermingled with the datasets. This allows for multiple, context-dependent, linksets that can evolve without impact on the underlying datasets and support diff ering opinions on the relationships between data instances. This flexibility is in contrast to both Linked Data and traditional data integration approaches. We look at the role personae can play in guiding the nature of relationships between the data resources and the desired a ffects of applying scientifi c lenses over Linked Data.
and,
Within scienti fic datasets it is common to fi nd links to the “equivalent” record in another dataset. However, there is no declaration of the form of the relationship. There is a great deal of variation in the notion of equivalence implied by the links both within a dataset’s usage and particularly across datasets, which degrades the quality of the data. The scienti fic user personae have very di fferent needs about the notion of equivalence that should be applied between datasets. The users need a simple mechanism by which they can change the operational equivalence applied between datasets. We propose the use of scientifi c lenses.
Obvious questions:
Does your topic map software support multiple operational equivalences?
Does your topic map interface enable users to choose “lenses” (I like lenses better than roles) to view equivalence?
Does your topic map software support declaring the nature of equivalence?
I first saw this in the slide deck: Scientific Lenses: Supporting Alternative Views of the Data by Alasdair J G Gray at: 4th Open PHACTS Community Workshop.
BTW, the notion of equivalence being represented by “links” reminds me of a comment Peter Neubauer (Neo4j) once made to me, saying that equivalence could be modeled as edges. Imagine typing equivalence edges. Will have to think about that some more.
From the homepage:
Persistent identification for life science data
The MIRIAM Registry provides a set of online services for the generation of unique and perennial identifiers, in the form of URIs. It provides the core data which is used by the Identifiers.org resolver.
The core of the Registry is a catalogue of data collections (corresponding to controlled vocabularies or databases), their URIs and the corresponding physical URLs or resources. Access to this data is made available via exports (XML) and Web Services (SOAP).
And from the FAQ:
What is MIRIAM, and what does it stand for?
MIRIAM is an acronym for the Minimal Information Required In the Annotation of Models. It is important to distinguish between the MIRIAM Guidelines, and the MIRIAM Registry. Both being part of the wider BioModels.net initiative.
What are the ‘MIRIAM Guidelines’?
The MIRIAM Guidelines are an effort to standardise upon the essential, minimal set of information that is sufficient to annotate a model in such a way as to enable its reuse. This includes a means to identify the model itself, the components of which it is composed, and formalises a means by which unambiguous annotation of components should be encoded. This is essential to allow collaborative working by different groups which may not be spatially co-located, and facilitates model sharing and reuse by the general modelling community. The goal of the project, initiated by the BioModels.net effort, was to produce a set of guidelines suitable for model annotation. These guidelines can be implemented in any structured format used to encode computational models, for example SBML, CellML, or NeuroML . MIRIAM is a member of the MIBBI family of community-developed ‘minimum information’ reporting guidelines for the biosciences.
More information on the requirements to achieve MIRIAM Guideline compliance is available on the MIRIAM Guidelines page.
What is the MIRIAM Registry?
The MIRIAM Registry provides the necessary information for the generation and resolving of unique and perennial identifiers for life science data. Those identifiers are of the URI form and make use of Identifiers.org for providing access to the identified data records on the Web. Examples of such identifiers: http://identifiers.org/pubmed/22140103, http://identifiers.org/uniprot/P01308, …
More identifiers for the life sciences, for those who choose to use them.
The curation may be helpful in terms of mappings to other identifiers.
American Geophysical Union (AGU)
The mission of the AGU:
The purpose of the American Geophysical Union is to promote discovery in Earth and space science for the benefit of humanity.
While I was hunting down information on DataONE, I ran across the AGU site.
Like all disciplines, data analysis, collection, collation, sharing, etc. are ongoing concerns at the AGU.
My interest in more in the data techniques than the subject matter.
Seeking to avoid re-inventing the wheel and learning new insights than has yet to reach more familiar areas.
App-lifying USGS Earth Science Data
Challenge Dates:
Submissions: January 9, 2013 at 9:00am EST – Ends April 1, 2013 at 11:00pm EDT.
Public Voting: April 5, 2013 at 5:00pm EDT – Ends April 25, 2013 at 11:00pm EDT.
Judging: April 5, 2013 at 5:00pm EDT – Ends April 25, 2013 at 11:00pm EDT.
Winners Announced: April 26, 2013 at 5:00pm EDT.
From the webpage:
USGS scientists are looking for your help in addressing some of today’s most perplexing scientific challenges, such as climate change and biodiversity loss. To do so requires a partnership between the best and the brightest in Government and the public to guide research and identify solutions.
The USGS is seeking help via this platform from many of the Nation’s premier application developers and data visualization specialists in developing new visualizations and applications for datasets.
USGS datasets for the contest consist of a range of earth science data types, including:
- several million biological occurrence records (terrestrial and marine);
- thousands of metadata records related to research studies, ecosystems, and species;
- vegetation and land cover data for the United States, including detailed vegetation maps for the National Parks; and
- authoritative taxonomic nomenclature for plants and animals of North America and the world.
Collectively, these datasets are key to a better understanding of many scientific challenges we face globally. Identifying new, innovative ways to represent, apply, and make these data available is a high priority.
Submissions will be judged on their relevance to today’s scientific challenges, innovative use of the datasets, and overall ease of use of the application. Prizes will be awarded to the best overall app, the best student app, and the people’s choice.
Of particular interest for the topic maps crowd:
Data used – The app must utilize a minimum of 1 DOI USGS Core Science and Analytics (CSAS) data source, though they need not include all data fields available in a particular resource. A list of CSAS databases and resources is available at: http://www.usgs.gov/core_science_systems/csas/activities.html. The use of data from other sources in conjunction with CSAS data is encouraged.
CSAS has a number of very interesting data sources. Classifications, thesauri, data integration, metadata and more.
Contest wins you a recognition and bragging rights, not to mention visibility for your approach.
From the about page:
Linked Science is an approach to interconnect scientific assets to enable transparent, reproducible and transdisciplinary research. LinkedScience.org is a community driven-effort to show what this means in practice.
LinkedScience.org was founded early 2011 and is led by Tomi Kauppinen affiliated with the Institute for Geoinformatics at the University of Muenster (Germany). The term Linked Science was coined in the early paper about Linked Open Science co-authored with Giovana Mira de Espindola from The Brazil’s National Institute for Space Research (INPE) with a reference to LinkedScience.org. At Oxford in March 2011 in discussions between Tomi Kauppinen and Jun Zhao it became evident that a workshop on Linked Science—which was then realized as a collocated event with ISWC 2011 and organized with a big team—would be a perfect start for creating a community for opening and linking science.
Since then LinkedScience.org has grown step by step, or person by person, to include international activities (check the events organized so far), publications about—and related to—Linked Science, the developed vocabularies, tools such as the SPARQL Package for R (please check also the tutorial), and already one sub community, that of spatial@linkedscience to illustrate the benefits and results of linking science.
A large number of resources and projects related to Linked Data and the Sciences.
Linked Science Core Vocabulary Specification (revision 0.91)
Abstract:
LSC, the Linked Science Core Vocabulary, is a lightweight vocabulary providing terms to enable publishers and researchers to relate things in science to time, space, and themes. More precisely, LSC is designed for describing scientific resources including elements of research, their context, and for interconnecting them. We introduce LSC as an example of building blocks for Linked Science to communicate the linkage between scientific resources in a machine-understandable way. The “core” in the name refers to the fact that LSC only defines the basic terms for science. We argue that the success of Linked Science—or Linked Data in general—lies in interconnected, yet distributed vocabularies that minimize ontological commitments. More specific terms needed by different scientific communities can therefore be introduced as extensions of LSC. LSC is hosted at LinkedScience.org; please check also other available vocabularies at LinkedScience.org/vocabularies.
A Linked Data vocabulary that you may encounter.
I first saw this in a tweet by Ivan Herman.
The Units Ontology: a tool for integrating units of measurement in science by Georgios V. Gkoutos, Paul N. Schofield, and Robert Hoehndorf. ( Database (2012) 2012 : bas033 doi: 10.1093/database/bas03)
Abstract:
Units are basic scientific tools that render meaning to numerical data. Their standardization and formalization caters for the report, exchange, process, reproducibility and integration of quantitative measurements. Ontologies are means that facilitate the integration of data and knowledge allowing interoperability and semantic information processing between diverse biomedical resources and domains. Here, we present the Units Ontology (UO), an ontology currently being used in many scientific resources for the standardized description of units of measurements.
As the paper acknowledges, there are many measurement systems in use today.
Leaves me puzzled as to what happens to data that follows some other drummer? Other than this one?
I assume any coherent system has no difficulty integrating data written in that system.
So how does adding another coherent system assist in that integration?
Unless everyone universally moves to the new system. Unlikely don’t you think?
2013 Workshop on Interoperability in Scientific Computing
From the post:
The 13th annual International Conference on Computational Science (ICCS 2013) will be held in Barcelona, Spain from 5th – 7th June 2013. ICCS is an ERA 2010 ‘A’-ranked conference series. For more details on the main conference, please visit www.iccs-meeting.org The 2nd Workshop on Interoperability in Scientific Computing (WISC ’13) will be co-located with ICCS 2013.
Approaches to modelling take many forms. The mathematical, computational and encapsulated components of models can be diverse in terms of complexity and scale, as well as in published implementation (mathematics, source code, and executable files). Many of these systems are attempting to solve real-world problems in isolation. However the long-term scientific interest is in allowing greater access to models and their data, and to enable simulations to be combined in order to address ever more complex issues. Markup languages, metadata specifications, and ontologies for different scientific domains have emerged as pathways to greater interoperability. Domain specific modelling languages allow for a declarative development process to be achieved. Metadata specifications enable coupling while ontologies allow cross platform integration of data.
The goal of this workshop is to bring together researchers from across scientific disciplines whose computational models require interoperability. This may arise through interactions between different domains, systems being modelled, connecting model repositories, or coupling models themselves, for instance in multi-scale or hybrid simulations. The outcomes of this workshop will be to better understand the nature of multidisciplinary computational modelling and data handling. Moreover we hope to identify common abstractions and cross-cutting themes in future interoperability research applied to the broader domain of scientific computing.
How is your topic map information product going to make the lives of scientists simpler?
Nathan Yau of Flowing Data points to a rendering of the subject area physics as a geographic map.
Somewhat dated (1939) but shows a lot of creativity and not small amount of cartographic skill.
Rather than calling it a “fictional” map I would prefer to say it is an intellectual map of physics.
Like all maps, the objects appear in explicit relationships to each other and there are no doubt as many implicit relationships are there are viewers of the map.
What continuum or dimensions would you use to create a map of modern ontologies?
That could make a very interesting exercise for the topic maps class. To have students create maps and then attempt to draw out what unspoken dimensions were driving the layout between parts of the map.
Suggestions of mapping software anyone?
7 Habits of the Open Scientist
A series of posts by David Ketcheson that begins:
Science has always been based on a fundamental culture of openness. The scientific community rewards individuals for sharing their discoveries through perpetual attribution, and the community benefits by through the ability to build on discoveries made by individuals. Furthermore, scientific discoveries are not generally accepted until they have been verified or reproduced independently, which requires open communication.
Historically, openness simply meant publishing one’s methods and results in the scientific literature. This enabled scientists all over the world to learn about essential advances made by their colleagues, modulo a few barriers. One needed to have access to expensive library collections, to spend substantial time and effort searching the literature, and to wait while research conducted by other groups was refereed, published, and distributed.
Nowadays it is possible to practice a fundamentally more open kind of research — one in which we have immediate, free, indexed, universal access to scientific discoveries. The new vision of open science is painted in lucid tones in Michael Nielsen’s Reinventing Discovery. After reading Nielsen’s book, I was hungry to begin practicing open science, but not exactly sure where to start. Here are seven ways I’m aware of. Each will be the subject of a longer forthcoming post.
The seven principles are:
What are your habits for research on topic maps or other semantic technologies?
I first saw this at: Igor Carron’s Around the blogs in 80 summer hours.
Semantic physical science by Peter Murray-Rust and Henry S Rzepa. (Journal of Cheminformatics 2012, 4:14 doi:10.1186/1758-2946-4-14)
Abstract:
The articles in this special issue arise from a workshop and symposium held in January 2012 (‘Semantic Physical Science’). We invited people who shared our vision for the potential of the web to support chemical and related subjects. Other than the initial invitations, we have not exercised any control over the content of the contributed articles.
There are pointers to videos and other materials for the following workshop presentations:
A remarkable workshop with which I have only one minor difference:
There was remarkable and exciting unanimity that semantics should and could be introduced now and rapidly into the practice of large areas of chemistry. We agreed that we should concentrate on the three main areas of crystallography, computation and NMR spectroscopy. In crystallography, this is primarily a strategy of working very closely with the IUCr, being able to translate crystallographic data automatically into semantic form and exploring the value of semantic publication and repositories. The continued development of Chempound for crystal structures is Open and so can be fed back regularly into mainstream crystallography.
When computers were being introduced to indexing chemistry and other physical sciences in the 1950’s/60’s, the then practitioners were under the impression their data already had semantics. That it did not have to await the next turn of the century in order to have semantics.
Not to take anything away from the remarkable progress that CML and related efforts have made, but they are not the advent of semantics for chemistry.
Clarification of semantics, documentation of semantics, refinement of semantics, all true.
But chemistry (and data) has always had semantics.
First BOSS Data: 3-D Map of 500,000 Galaxies, 100,000 Quasars
From the post:
The Third Sloan Digital Sky Survey (SDSS-III) has issued Data Release 9 (DR9), the first public release of data from the Baryon Oscillation Spectroscopic Survey (BOSS). In this release BOSS, the largest of SDSS-III’s four surveys, provides spectra for 535,995 newly observed galaxies, 102,100 quasars, and 116,474 stars, plus new information about objects in previous Sloan surveys (SDSS-I and II).
“This is just the first of three data releases from BOSS,” says David Schlegel of the U.S. Department of Energy’s Lawrence Berkeley National Laboratory (Berkeley Lab), an astrophysicist in the Lab’s Physics Division and BOSS’s principal investigator. “By the time BOSS is complete, we will have surveyed more of the sky, out to a distance twice as deep, for a volume more than five times greater than SDSS has surveyed before — a larger volume of the universe than all previous spectroscopic surveys combined.”
Spectroscopy yields a wealth of information about astronomical objects including their motion (called redshift and written “z”), their composition, and sometimes also the density of the gas and other material that lies between them and observers on Earth. The BOSS spectra are now freely available to a public that includes amateur astronomers, astronomy professionals who are not members of the SDSS-III collaboration, and high-school science teachers and their students.
The new release lists spectra for galaxies with redshifts up to z = 0.8 (roughly 7 billion light years away) and quasars with redshifts between z = 2.1 and 3.5 (from 10 to 11.5 billion light years away). When BOSS is complete it will have measured 1.5 million galaxies and at least 150,000 quasars, as well as many thousands of stars and other “ancillary” objects for scientific projects other than BOSS’s main goal.
For data access, software tools, tutorials, etc., see: http://sdss3.org/
Interesting data set but also instructive for the sharing of data and development of tools for operations on shared data. You don’t have to have a local supercomputer to process the data. Dare I say a forerunner of the “cloud?”
Be the alpha geek at your local astronomy club this weekend!
Hard science, soft science, hardware, software by John D. Cook.
The post starts:
The hard sciences — physics, chemistry, astronomy, etc. — boasted remarkable achievements in the 20th century. The credibility and prestige of all science went up as a result. Academic disciplines outside the sciences rushed to append “science” to their names to share in the glory.
Science has an image of infallibility based on the success of the hard sciences. When someone says “You can’t argue with science,” I’d rather they said “It’s difficult to argue with hard science.”
Read on….
I think…, well, you decide on John’s basic point for yourself.
Personally I think the world is complicated, historically, linguistically, semantically, theologically, etc. I am much happier searching in hopes of answers that seem adequate for the moment, as opposed to seeking certitudes, particularly for others.
Seismic Data Science: Reflection Seismology and Hadoop by Josh Wills.
From the post:
When most people first hear about data science, it’s usually in the context of how prominent web companies work with very large data sets in order to predict clickthrough rates, make personalized recommendations, or analyze UI experiments. The solutions to these problems require expertise with statistics and machine learning, and so there is a general perception that data science is intimately tied to these fields. However, in my conversations at academic conferences and with Cloudera customers, I have found that many kinds of scientists– such as astronomers, geneticists, and geophysicists– are working with very large data sets in order to build models that do not involve statistics or machine learning, and that these scientists encounter data challenges that would be familiar to data scientists at Facebook, Twitter, and LinkedIn.
A nice overview of areas of science using “big data” decades before the current flurry of activity. The use of Hadoop in reflection seismology is only one fuller example of that use.
The take away that I have from this post is that Hadoop skills are going to be in demand across business, science and one would hope, the humanities.
Powered by WordPress