Programming MapReduce With Scalding
Source code for PACKT book: Programming MapReduce With Scalding (June 2014).
I haven’t seen the book and there are no sample chapters, yet.
Ping me if you post comments about it.
Thanks!
Programming MapReduce With Scalding
Source code for PACKT book: Programming MapReduce With Scalding (June 2014).
I haven’t seen the book and there are no sample chapters, yet.
Ping me if you post comments about it.
Thanks!
Information Overload: Can algorithms help us navigate the untamed landscape of online news? by Jason Cohn.
From the post:
Digital journalism has evolved to a point of paradox: we now have access to such an overwhelming amount of news that it’s actually become more difficult to understand current events. IDEO New York developer Francis Tseng is—in his spare time—searching for a solution to the problem by exploring its root: the relationship between content and code. Tseng received a grant from the Knight Foundation to develop Argos*, an online news aggregation app that intelligently collects, summarizes and provides contextual information for news stories. Having recently finished version 0.1.0, which he calls the first “complete-ish” release of Argos, Tseng spoke with veteran journalist and documentary filmmaker Jason Cohn about the role technology can play in our consumption—and comprehension—of the news.
Great story and very interesting software. And as Alyona notes in her tweet, it’s open source!
Any number of applications, particularly for bloggers who are scanning lots of source material everyday.
Intended for online news but a similar application would be useful for TV news as well. In the Altanta, Georgia area a broadcast could be prefaced by:
I haven’t timed the news and some channels are worse than others but take that as a recurrent, public domain summary of Atlanta news. 😉
For digital news feeds, check out the Argos software!
I first saw this in a tweet by Alyona Medelyan.
From the webpage:
SecureGraph is an API to manipulate graphs, similar to Blueprints. Unlike Blueprints, every Secure graph method requires authorizations and visibilities. SecureGraph also supports multivalued properties as well as property metadata.
The SecureGraph API was designed to be generic, allowing for multiple implementations. The only implementation provided currently is built on top of Apache Accumulo for data storage and Elasticsearch for indexing.
According to the readme file, definitely “beta” software but interesting software none the less.
Are you using insecure graph software?
Might be time to find out!
I first saw this in a tweet by Marko A. Rodriguez
Federal Agencies and the Opportunities and Challenges of Big Data by Nicole Wong.
June 19, 2014
1:00 pm – 5:00 pm
Webcast: http://www.ustream.tv/GeorgetownLive
From the post:
On June 19, the Obama Administration will continue the conversation on big data as we co-host our fourth big data conference, this time with the Georgetown University McCourt School of Public Policy’s Massive Data Institute. The conference, “Improving Government Performance in the Era of Big Data; Opportunities and Challenges for Federal Agencies”, will build on prior workshops at MIT, NYU, and Berkeley, and continue to engage both subject matter experts and the public in a national discussion about the future of data innovation and policy.
Drawing from the recent White House working group report, “Big Data: Seizing Opportunities, Preserving Values”, this event will focus on the opportunities and challenges posed by Federal agencies’ use of data, best practices for sharing data within and between agencies and other partners, and measures the government may use to ensure the protection of privacy and civil liberties in a big data environment.
You can find more information about the workshop and the webcast here.
We hope you will join us!
Nicole Wong is U.S. Deputy Chief Technology Officer at the White House Office of Science & Technology Policy
Approximately between 1:30 – 2:25 p.m., Panel One: Open Data and Information Sharing, Moderator: Nick Sinai, Deputy U.S. Chief Technology Officer.
Could be some useful intelligence on how sharing of data is viewed now. Perhaps you could throttle back a topic map to be just a little ahead of where agencies are now. So it would not look like such a big step.
Yes?
Network Data by Mark Newman.
From the webpage:
This page contains links to some network data sets I’ve compiled over the years. All of these are free for scientific use to the best of my knowledge, meaning that the original authors have already made the data freely available, or that I have consulted the authors and received permission to the post the data here, or that the data are mine. If you make use of any of these data, please cite the original sources.
The data sets are in GML format. For a description of GML see here. GML can be read by many network analysis packages, including Gephi and Cytoscape. I’ve written a simple parser in C that will read the files into a data structure. It’s available here. There are many features of GML not supported by this parser, but it will read the files in this repository just fine. There is a Python parser for GML available as part of the NetworkX package here and another in the igraph package, which can be used from C, Python, or R. If you know of or develop other software (Java, C++, Perl, R, Matlab, etc.) that reads GML, let me know.
I count sixteen (16) data sets and seven (7) collections of data sets.
Reminded me of a tweet I saw today:
It’s used to be the social graph, then the interest-graph. Now, w/ social shopping it’s all about the taste graph. (emphasis added)
That’s three very common graphs and we all belong to networks or have interests that could be represented as still others.
After all the labor that goes into the composition of a graph, Mr. Normalization Graph would say we have to re-normalize these graphs to use them together.
That sounds like a bad plan. To me, reduplicating work that has already been done is always a bad plan.
If we could merge nodes and edges of two or more graphs together, then we can leverage the prior work on both graphs.
Not to mention that after merging, the unified graph could be searched, visualized and explored with less capable graph software and techniques.
Something to keep in mind.
I first saw this in a tweet by Steven Strogatz.
SIGGRAPHITTI Issue 3 – June 2014
News for SIGGRAPH2014!
As you already know:
Conference 10-14 August 2014
Exhibition 12-14 August 2014
Vancouver Convention Center
What you may not know:
Should be easy to make the Balisage Conference, August 4-8, 2014, Washington, DC and then hop a flight to Vancouver. 😉
From the post:
Mobile device data analytics is going to be an important issue in the next few years. Hardware improvements like more efficient batteries, larger memories and more conscious energy consumption will be crucial to allow for complex computations in such devices. Added to that, the analytics capability analytical engines embedded in a mobile device will also allow the users to gather and manage their own private data with analytic objectives at the tip of their fingers.
Graph databases will be important in that area with situations where the mobile device will have to solve different problems like the management of the mobile data, social network analytics, mobile device security, geo-localized medical surveillance and real time geo-localized travel companion services.
Sparksee 5 mobile is an important provider player for mobile analytics applications, being the first graph database for Android and iOS. Sparksee small footprint of less that 50Kbytes* makes it especially attractive for mobile devices along with its high performance capabilities and the compact storage space required. Sparksee is powered by a research-based technology that makes an intensive use of bitmaps allowing for the use of simple logic operations and remarkable data locality to solve graph analytics.
Do you want to be among the first applications making real use of the device hardware possibilities? Have you considered resolving your analytical operations in the device, storing & querying the information in a graph database instead of having an external server? Let us know what do you think about this new possibilities and which applications do you think will benefit more of having an in-device real time process.
Download Sparksee graph database mobile for free at: http://sparsity-technologies.com/#download
You know, we used to talk about how to deliver topic maps to cellphones.
If merging were handled server-side, delivery of a topic map as a graph to a smartphone, that could be all the navigation capability that a smartphone user would need.
Something to think about, very seriously.
From the webpage:
AnalyzeWords helps reveal your personality by looking at how you use words. It is based on good scientific research connecting word use to who people are. So go to town – enter your Twitter name or the handles of friends, lovers, or Hollywood celebrities to learn about their emotions, social styles, and the ways they think.
Even though “…based on good scientific research…” I would not take the results too seriously.
Any more that I would take advice from a book called: “I’m OK, Your’re OK.” (I know the first isn’t likely and the second is untrue.) 😉
Play with it over a couple of days and try to guess the relationships between words and your ratings.
I first saw this in a tweet by Alyona Medelyan.
The Samuelson Clinic releases “Is it in the Public Domain?” handbook
From the post:
The Samuelson Clinic is excited to release a handbook, “Is it in the Public Domain?,” and accompanying visuals. These educational tools help users to evaluate the copyright status of a work created in the United States between January 1, 1923 and December 31, 1977—those works that were created before today’s 1976 Copyright Act. Many important works—from archival materials to family photos and movies—were created during this time, and it can be difficult to tell whether they are still under copyright.
The handbook walks readers though a series of questions—illustrated by accompanying charts—to help readers explore whether a copyrighted work from that time is in the public domain, and therefore free to be used without permission from a copyright owner. Knowing whether a work is in the public domain or protected by copyright is an important first step in any decision regarding whether or how to make use of a work.
The handbook was originally developed for the Student Nonviolent Coordinating Committee Legacy Project (“SLP”), a nonprofit organization run by civil rights movement veterans that is creating a digital archive of historical materials.
Excellent!
This is the resource to reference when questions of “public domain” come up in project discussions.
If you need more advice than you find here, get legal counsel. Intellectual property law isn’t a good area for learning experiences. That is to say the experiences can be quite unpleasant and expensive.
I first saw this in a tweet by Michael Peter Edson.
NSA Playset invites hackers to ‘play along with the NSA’ by Violet Blue.
From the post:
Inspired by the NSA’s ANT Catalog of spyware and surveillance tools, The NSA Playset project invites hackers to reproduce easy, at-home versions of the NSA’s spy-tools arsenal — and NSA-style silly names are required.
The NSA’s ANT Catalog was among documents leaked by Edward Snowden. It revealed 49 different software and hardware tools used for espionage on civilian targets. For hackers, it’s an irresistible Pandora’s Box.
…
What item from the NSA ANT Catalog do you want to help build?
PS: Remember the NSA ANT Catalog dates from 2008 so adjust prices for commercial licensing accordingly.
Exploring FBI Crime Statistics with Glue and plotly by Chris Beaumont.
From the post:
Glue is a project I’ve been working on to interactively visualize multidimensional datasets in Python. The goal of Glue is to make trivially easy to identify features and trends in data, to inform followup analysis.
This notebook shows an example of using Glue to explore crime statistics collected by the FBI (see this notebook for the scraping code). Because Glue is an interactive tool, I’ve included a screencast showing the analysis in action. All of the plots in this notebook were made with Glue, and then exported to plotly (see the bottom of this page for details).
….
FBI crime statistics are used for demonstration purposes but Glue should be generally useful for exploring multidimensional datasets.
It isn’t possible to tell how “clean” or “consistent” the FBI reported crime data may or may not be. And as the FBI itself points out, comparison between locales is fraught with peril.
40 cm satellite imagery starts today by Charlie Loyd.
From the post:
Starting this morning, DigitalGlobe has new permission from the government to sell satellite imagery at 40 cm (16 inch) resolution, up from 50 cm (20 inches). The limit will drop further to 25 cm (10 inches) later this summer, once they’ve launched WorldView-3, which will be the first private satellite technically capable of that resolution. The numbers don’t tell the story, though—let’s look at some pictures.
If going from 50 cm resolution to 40 cm resolution sounds like a small change at first, remember that we’re talking about square pixels. When square A is only ¼ longer on a side than square B, it contains more than 150% as much area. Therefore, a slightly smaller linear size means a lot more clarity. I’ve taken some aerial imagery of San Francisco’s Golden Gate Park and resampled it to demonstrate:
…
And when the market explodes for 25cm (10 inches) later this summer?
Will that drive demand for < 25cm (10 inches) resolution? And pirating the image feeds, will that drive expansion of the NSA's melting data center? I first saw this in a tweet by Mapbox.
Elasticsearch, RethinkDB and the Semantic Web by Michel Dumontier.
From the post:
Everyone is handling big data nowadays, or at least, so it seems. Hadoop is very popular among the Big Data wranglers and it is often mentioned as the de facto solution. I have dabbled into working with Hadoop over the past years and found that: yes, it is very suitable for certain kinds of data mining/analysis and for those it provides high data crunching throughput, but, no, it cannot answer queries quickly and you cannot port every algorithm into Hadoop’s map/reduce paradigm. I have since turned to Elasticsearch and more recently to RethinkDB. It is a joy to work with the latter and it performs faceting just as well as Elasticsearch for the benchmark data that I used, but still permits me to carry out more complex data mining and analysis too.
The story here describes the data that I am working with a bit, it shows how it can be turned into a data format that both Elasticsearch and RethinkDB understand, how the data is being loaded and indexed, and finally, how to get some facets out of the systems.
Interesting post on biomedical data in RDF N-Quads format which is converted into JSON and then processed with ElasticSearch and RethinkDB.
I first saw this in a tweet by Joachim Baran.
A map showing the 22 countries that Great Britain has not invaded
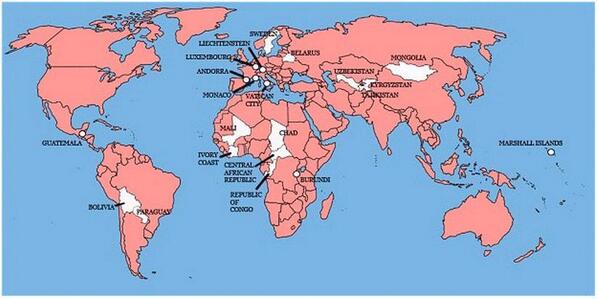
A map that makes the United States look almost benign. 😉
One of the most compelling combinations of a history timeline and a map I have ever seen!
In a nutshell, the map shows the loss of territory by native Americans from 1776 until present.
This should be shown and assigned as homework in every American history class.
Some people who merit a special shout-out for this work:
The Invasion of America is a project of eHistory.org.
Project director: Claudio Saunt, Russell Professor of History at the University of Georgia
Technical director: Sergio Bernardes, Center for Geospatial Research
Special thanks to David Holcomb and Daniel Reeves at ITOS for implementing the map on ArcGIS Server.
Achieve Greater Functionality, Ease of Use and Even Faster Performance with InfiniteGraph 3.3
From the post:
Objectivity, Inc., the leader in real-time, complex Big Data solutions, announced today the release of InfiniteGraph 3.3 which offers up improved functionality and ease of use with additional performance improvements.
Objectivity’s products make Big Data smart. Objectivity’s database software helps you discover and unlock the hidden value in your Big Data for improved real-time intelligence and decision support in distributed environments for improved in-time business value.
InfiniteGraph 3.3 performance enhancements include:
- Faster Data Ingest
- Significant performance improvements in data ingest operations, as well as in operations that delete vertices and edges.
- Enhanced Vertex, Edge and Hop Discovery
- New methods that provide improved functionality for edge, vertex, and hop discovery.
- Updated Logging
- Updated SLF4J logging, which includes the ability to customize log output.
- Updated Tinkerpop Blueprints Implementation
- Critical Bug Fixes
InfiniteGraph 3.3 is available for a free, unlimited 60 day trial at www.objectivity.com/downloads. Get started with our easy Quick Start user guide, Google Group support site and free sample code with vertical use case focus in healthcare, security, social business and more on our InfiniteGraph Wiki site, http://wiki.infinitegraph.com/ and resources section, www.objectivity.com/resources.
I keep waiting for a vendor to try the “Avis, we’re #2 so we try harder” strategy with software. 😉
I checked and the InfiniteGraph 3.3 Technical Specifications aren’t posted yet. The 3.2 specs are there but not 3.3. Looking forward to hearing more about improvement for edge, vertex and hop discovery.
Ping me if you see it before I do. Thanks!
From the post:
Apache CouchDB 1.6.0 has been released and is available for download.
CouchDB is a database that completely embraces the web. Store your data with JSON documents. Access your documents with your web browser, via HTTP. Query, combine, and transform your documents with JavaScript. CouchDB works well with modern web and mobile apps. You can even serve web apps directly out of CouchDB. And you can distribute your data, or your apps, efficiently using CouchDB’s incremental replication. CouchDB supports master-master setups with automatic conflict detection.
Grab your copy here:
Pre-built packages for Windows and OS X are available.
Get it while it’s hot!
Hazelcast Enterprise: A Direct Challenge to Larry Ellison’s Vision for In-Memory Computing
You might not have sipped so much Oracle kool-aid today if Larry Ellison were in fact Pinocchio.
I don’t know about you but seeing Ellison balancing his nose on the end of a wheel barrow would make me think carefully about any statements he made.
You?
In win for libraries, court rules database of Google-scanned books is “fair use” by Jeff John Roberts.
From the post:
A federal appeals court ruled on Tuesday that the Hathi Trust, a searchable collection of digital books controlled by university libraries, does not violate copyright, and that the libraries can continue to make copies for digitally-impaired readers.
The decision is a setback for the Authors Guild and for other groups of copyright holders who joined the lawsuit to shut down the Hathi Trust’s operations. By contrast, it is a victory for many scholars and librarians who regard the database as an invaluable repository of knowledge.
…
Of particular interest to those of us interested in creating topic maps based upon currently copyrighted material:
Do not attempt work on copyrighted material without local legal advice on your particular case, but be aware the court has held:
the creation of a full-text searchable database is a quintessentially transformative use…
of a copyrighted text.
Excellent!
Reclaiming Fair Use: How to Put Balance Back in Copyright by Patricia Aufderheide and Peter Jaszi.
The irony of the title is that no electronic version of the book is available and the online scans are of a very limited part of the content.
Possibly a “do as I say and don’t do as I do” sort of book.
I first saw this in a tweet by Michael Peter Edson.
A dynamic map with a timeline of United States history and its “acquisition” of land from the inhabitants already present.
The continued power of American exceptionalism, the force that drove that conquest, makes the map all the more frightening.
I first saw this in a tweet by Lincoln Mullen.
An Introduction to Statistical Learning with Applications in R by Gareth James, Daniela Witten, Trevor Hastie and Robert Tibshirani.
From the webpage:
This book provides an introduction to statistical learning methods. It is aimed for upper level undergraduate students, masters students and Ph.D. students in the non-mathematical sciences. The book also contains a number of R labs with detailed explanations on how to implement the various methods in real life settings, and should be a valuable resource for a practicing data scientist.
R code, data sets, the full text in pdf. What more could you want? 😉
The text is published by Springer, who is allowing the full text to be posted online.
Reward good behavior by publishers. Recommend this text to your librarian for acquisition.
I first saw this in a tweet by One R Tip a Day.
New Data Sets Available in Census Bureau API
From the post:
Today the U.S. Census Bureau added several data sets to its application programming interface, including 2013 population estimates and 2012 nonemployer statistics.
The Census Bureau API allows developers to create a variety of apps and tools, such as ones that allow homebuyers to find detailed demographic information about a potential new neighborhood. By combining Census Bureau statistics with other data sets, developers can create tools for researchers to look at a variety of topics and how they impact a community.
Data sets now available in the API are:
- July 1, 2013, national, state, county and Puerto Rico population estimates
- 2012-2060 national population projections
- 2007 Economic Census national, state, county, place and region economy-wide key statistics
- 2012 Economic Census national economy-wide key statistics
- 2011 County Business Patterns at the national, state and county level (2012 forthcoming)
- 2012 national, state and county nonemployer statistics (businesses without paid employees)
The API also includes three decades (1990, 2000 and 2010) of census statistics and statistics from the American Community Survey covering one-, three- and five-year periods of data collection. Developers can access the API online and share ideas through the Census Bureau’s Developers Forum. Developers can use the Discovery Tool to examine the variables available in each dataset.
In case you are looking for census data to crunch!
Enjoy!
On Lowered Expectations: Transactions, Scaling, and Honesty by Jennifer Rullmann.
Jennifer reviews Ted Dunning’s list of what developers should demand from database vendors and then adds one more:
But I think the most important thing that developers need from database vendors is missing: honesty. I spent 30 minutes yesterday on a competitor’s website just trying to figure out if they really do ACID, and after four months in the industry, I know quite a bit more about what to look for than most application developers. It’s ridiculous how hard it is to figure out even the most basic things about the vast majority of databases on the market. I feel really strongly about this, so I’ll say it again:
The number one thing we need from database vendors is honesty.
(emphasis in original)
I am sure there are vendors who invent definitions of “hyperedge” and claim to support Unicode when they really support “tick-Unicode,” that is a Unicode character preceded by a “`.”
Beyond basic honesty, I read Jennifer’s complaint as being about the lack of good documentation for database offerings. A lack that is well known.
I doubt developers are suddenly going to start writing high quality documentation for their software. Or at least after decades of not doing so, it seems unlikely.
But that doesn’t mean we are doomed to bad documentation. What if a database vendor decided to document databases comparable to their own? Not complete, not a developer’s guide but ferreting out and documenting basic information comparable databases.
Like support for ACID.
Would take time to develop the data and credibility, but in the long run, whose product would you trust more?
A vendor whose database capabilities are hidden behind smoke and mirrors or a vendor who is honest about themselves and others?
RegexTip is a Twitter account maintained by John D. Cook and it sends out one (1) regex tip per week.
Regexes or regular expressions are everywhere in computer science but especially in search.
I just saw a tweet by Scientific Python that the cycle of regex tips has restarted with the basics.
Good time to follow RegexTip.
Mercator: Extreme by Drew Roos.
The link takes you to a display setting the pole to Atlanta, GA (near my present location).
You should search for a location near you for the maximum impact of the display. Intellectually I have known about map distortion but seeing it for your location, that’s something different.
Highly interactive and strongly recommended!
Makes me wonder about visual displays of other map distortions. Not just well known map projections but policy distortions as well.
Take for example a map that sizes countries by the amount of aid for the United States divided by their population.
Are there any map artists in the audience?
I first saw this in a tweet by Lincoln Mullen.
Puck, a high-speed GPU-powered parser by David Hall.
From the post:
I’m pleased to announce yet another new parser called Puck. Puck is a lightning-fast parser that uses Nvidia GPUs to do most of its computation. It is capable of parsing over 400 sentences per second, or about half a million words per minute. (Most CPU constituency parsers of its quality are on the order of 10 sentences per second.)
Puck is based on the same grammars used in the Berkeley Parser, and produces nearly identical trees. Puck is only available for English right now.
For more information about Puck, please see the project github page (https://github.com/dlwh/puck) , or the accompanying paper (http://www.cs.berkeley.edu/~dlwh/papers/gpuparser.pdf).
Because of some its dependencies are not formally released yet (namely the wonderful JavaCL library), I can’t push artifacts to Maven Central. Instead I’ve uploaded a fat assembly jar here: http://www.scalanlp.org/releases/puck-assembly-0.1.jar (See the readme on github for how to use it.) It’s better used as a command line tool, anyway.
Even more motivation for learning to use GPUs!
I first saw this in a tweet by Jason Baldridge.
“How Not to Be Wrong”: What the literary world can learn from math by Laura Miller.
From the post:
Jordan Ellenberg’s “How Not to Be Wrong: The Power of Mathematical Thinking” is a miscellaneous romp through the world of quantitative reasoning. You can tell just how modular the book is by the way bits of it have been popping up all over the Web of late, promising to explain such mysteries as why so many handsome men are jerks or why an athlete’s performance always seems to suffer a drop-off after he signs a big contract. This pull-apart quality may sound like a bug, but in fact it’s a feature. It makes “How Not to Be Wrong” a rewarding popular math book for just about anyone.
Ellenberg is a professor of mathematics at the University of Wisconsin-Madison who spent “some part of my early 20s thinking I might want to be a Serious Literary Novelist.” (He even published a novel, “The Grasshopper King.”) He has a popular math column at Slate. So Ellenberg can write, and furthermore he brings a set of references to the subject that will make many a numbers-shy humanities major feel right at home. He explains why B.F. Skinner’s “proof” that Shakespeare was not particularly inclined toward poetic alliteration was incorrect, and he is as likely to refer to Robert Frost and Thomas Pynchon as to such mathematical titans as R.A. Fisher and Francis Galton. He takes the playful, gentle, humorous tone of a writer used to cajoling his readers into believing that they can understand what he’s talking about.
At the same time, those who like to pull out a pencil and a piece of paper and work through a few equations for the fun of it should not be utterly put off by the aforementioned cajoling. Interested in a brush-up on plane geometry, the implications of the Prime Numbers Theorem and Yitang Zhang’s recently announced proof of the “bounded gaps” conjecture about the distribution of primes? Pull up a chair. On the other hand, if any sentence containing the term “log N” makes you go cross-eyed and befuddled, you need only turn a few pages ahead to another chapter, where you can read about how two separate math cartels gamed the Massachusetts state lottery.
…
Laura’s review will leave you convinced that “Have you read ‘How Not to be Wrong’ by Jordan Ellenberg?” should be on your technical interview checklist.
Or at least you should pull examples from it to use in your technical interviews.
Despite all the hype about “big data,” “web scale,” etc., the nature of coherent thinking has not changed. The sooner you winnow out candidates that thing otherwise the better.
Bringing researchers and developers together: a call for proposals by Bill Mills.
From the post:
Interdisciplinary Programming is looking for research projects to participate in a pilot study on bringing together the scientific and developer communities to work together on common problems to help further science on the web. This pilot will be run with the Mozilla Science Lab as a means of testing out new ways for the open science and open source community to get their hands dirty and contribute. The pilot is open to coders both within the research enterprise as well as those outside, and for all skill levels.
In this study, we’ll work to break accepted projects down to digestible tasks (think bug reports or github issues) for others to contribute to or offer guidance on. Projects can be small to mid-scale – the key here is to show how we can involve the global research and development community in furthering science on the web, while testing what the right level of engagement is. Any research-oriented software development project is eligible, with special consideration given to projects that further open, collaborative, reproducible research, and reusable tools and technology for open science.
Candidate research projects should:
- Have a clearly stated and specific goal to achieve or problem to solve in software.
- Be directly relevant to your ongoing or shortly upcoming research.
- Require code that is sharable and reusable, with preference given to open source projects.
- Science team should be prepared to communicate regularly with the software team.
Interdisciplinary Programming was the brainchild of Angelina Fabbro (Mozilla) and myself (Bill Mills, TRIUMF) that came about when we realized the rich opportunities for cross-pollination between the fields of software development and basic research. When I was a doctoral student writing analysis software for the Large Hadron Collider’s ATLAS experiment, I got to participate in one of the most exciting experiments in physics today – which made it all the more heartbreaking to watch how much precious time vanished into struggling with unusable software, and how many opportunities for great ideas had to be abandoned while we wrestled with software problems that should have been helping us instead of holding us back. If we could only capture some of the coding expertise that was out there, surely our grievously limited budgets and staff could reach far further, and do so much more.
Later, I had the great good fortune to be charged with building the user interface for TRIUMF’s upcoming GRIFFIN experiment, launching this month; thanks to Angelina, this was a watershed moment in realizing what research could do if it teamed up with the web. Angelina taught me about the incredibly rich thought the web community had in the spheres of usability, interaction design, and user experience; even my amature first steps in this world allowed GRIFFIN to produce a powerful, elegant, web-based UI that was strides ahead of what we had before. But what really struck me, was the incredible enthusiasm coders had for research. Angelina and I spoke about our plans for Interdisciplinary Programming on the JavaScript conference circuit in late 2013, and the response was overwhelming; coders were keen to contribute ideas, participate in the discussion and even get their hands dirty with contributions to the fields that excited them; and if I could push GRIFFIN ahead just by having a peek at what web developers were doing, what could we achieve if we welcomed professional coders to the realm of research in numbers? The moment is now to start studying what we can do together.
We’ll be posting projects in early July 2014, due to conclude no later than December 2014 (shorter projects also welcome); projects anticipated to fit this scope will be given priority. In addition, the research teams should be prepared to answer a few short questions on how they feel the project is going every month or so. Interested participants should send project details to the team at mills.wj@gmail.com by June 27, 2014.
I wonder, do you think documenting semantics of data is likely to come up? 😉
Will report more news as it develops!
Combined Solr and Lucene Javadoc 4.8.0
A resource built by Solr Start using …., you guessed, Solr. 😉
From the Solr Start homepage:
Welcome to the collection of resources to make Apache Solr more comprehensible to beginner and intermediate users. While Solr is very easy to start with, tuning it is – like for any search engine – fairly complex. This website will try to make this simpler by compiling information and creating tools to accelerate learning Solr. The currently available resources are linked in the menubar above. More resources will be coming shortly.
If you would like to be notified of such new resources, get early access and receive exclusive discounts on commercial tools, join the mailing list below:
I’m curious.
This Javadocs resource will be very useful but obviously Javadocs are missing something or else there would be fewer presentations, papers, blogs, etc., on issues covered by the Javadocs.
Yes?
While I applaud the combined index of Lucene and Solr Javadocs, what would an index have to cover beyond the Javadocs to be really useful to you?
I first saw this in a tweet by SolrStart.
Powered by WordPress