Another Word For It Patrick Durusau on Topic Maps and Semantic Diversity

September 13, 2013

Client-side full-text search in CSS

Filed under: CSS3,Full-Text Search,Searching — Patrick Durusau @ 4:40 pm

Client-side full-text search in CSS by François Zaninotto.

Not really “full-text search” in any meaningful sense of the phrase.

But I can imagine it being very useful and the comments to his post about “appropriate” use of CSS are way off base.

The only value of CSS or Javascript or (fill in your favorite technology) is creation and/or delivery of content to a user.

Despite some naming issues, this has the potential to deliver content to users.

You may have other criteria that influence you choice of mechanisms but “appropriate” should not be one of them.

Hypergraph-Based Image Retrieval for Graph-Based Representation

Filed under: Graphs,Hypergraphs,Image Processing — Patrick Durusau @ 4:26 pm

Hypergraph-Based Image Retrieval for Graph-Based Representation by Salim Jouili and Salvatore Tabbone.

Abstract:

In this paper, we introduce a novel method for graph indexing. We propose a hypergraph-based model for graph data sets by allowing cluster overlapping. More precisely, in this representation one graph can be assigned to more than one cluster. Using the concept of the graph median and a given threshold, the proposed algorithm detects automatically the number of classes in the graph database. We consider clusters as hyperedges in our hypergraph model and we index the graph set by the hyperedge centroids. This model is interesting to traverse the data set and efficient to retrieve graphs.

(Salim Jouili and Salvatore Tabbone, Hypergraph-based image retrieval for graph-based representation. Journal of the Pattern Recognition Society, April 2012. © 2012 Elsevier Ltd.)

From the introduction:

In the present work, we address the problematic of graph indexing using directly the graph domain. We provide a new approach based on the hypergraph model. The main idea of this contribution is first to re-organize the graph space (domain) into a hypergraph structure. In this hypergraph, each vertex is a graph and each hyperedge corresponds to a set of similar graphs. Second, our method uses this hypergraph structure to index the graph set by making use of the centroids of the hyperedges as index entries. By this way, our method does not need to store additional information about the graph set. In fact, our method creates an index that contains only pointers to some selected graphs from the dataset which is an interesting feature, especially, in the case of large datasets. Besides indexing, our method addresses also the navigation problem in a database of images represented by graphs. Thanks to the hypergraph structure, the navigation through the data set can be performed by a classical traversal algorithm. The experimental results show that our method provides good performance in term of indexing for tested image databases as well as for a chemical database containing about 35,000 graphs, which points out that the proposed method is scalable and can be applied in different domains to retrieve graphs including clustering, indexing and navigation steps.

Sounds very exciting until I think about the difficulty of constructing a generalized “semantic centroid.”

For example, what is the semantic distance between black and white?

Was disambiguation of black and white a useful thing. Yes/No?

Suggestions on how to develop domain specific “semantic centroids?”

An empirical comparison of graph databases

Filed under: Benchmarks,DEX,Graphs,Neo4j,OrientDB,Titan — Patrick Durusau @ 2:39 pm

An empirical comparison of graph databases by Salim Jouili and Valentin Vansteenberghe.

Abstract:

In recent years, more and more companies provide services that can not be anymore achieved efficiently using relational databases. As such, these companies are forced to use alternative database models such as XML databases, object-oriented databases, document-oriented databases and, more recently graph databases. Graph databases only exist for a few years. Although there have been some comparison attempts, they are mostly focused on certain aspects only.

In this paper, we present a distributed graph database comparison framework and the results we obtained by comparing four important players in the graph databases market: Neo4j, OrientDB, Titan and DEX.

(Salim Jouili and Valentin Vansteenberghe, An empirical comparison of graph databases. To appear in Proceedings of the 2013 ASE/IEEE International Conference on Big Data, Washington D.C., USA, September 2013.)

For your convenience:

DEX

Neo4j

OrientDB

Titan

I won’t reproduce the comparison graphs here. The “winner” depends on your requirements.

Looking forward to seeing this graph benchmark develop!

September 12, 2013

Why Most Published Research Findings Are False [As Are Terrorist Warnings]

Filed under: Data Analysis,Statistics — Patrick Durusau @ 5:57 pm

Why Most Published Research Findings Are False by John Baez.

John’s post is based on John P. A. Ioannidis, Why most published research findings are false, PLoS Medicine 2 (2005), e124, and is very much worth your time to read carefully.

Here is a cartoon that illustrates one problem with research findings (John uses it and it appears in the original paper):

significant

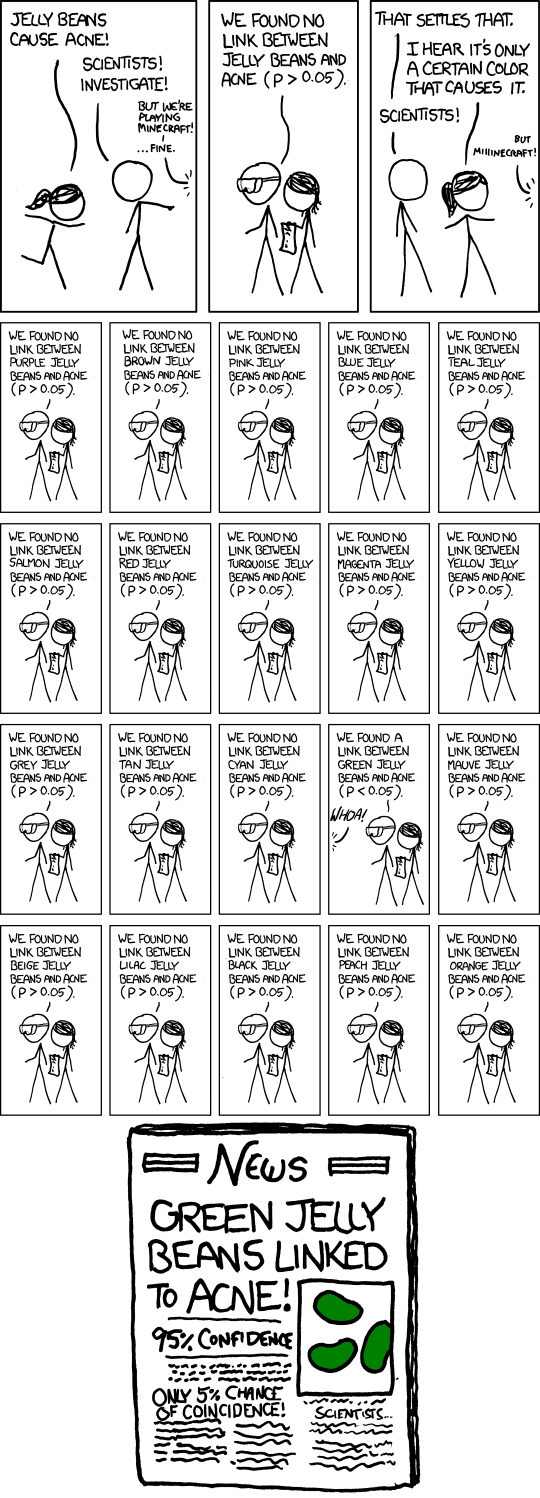
The danger of attributing false significance isn’t limited to statistical data.

Consider Vinson Cerf’s Freedom and the Social Contract in the most recent issue of CACM.

Vinson writes in discussing privacy versus the need for security:

In today’s world, threats to our safety and threats to national security come from many directions and not all or even many of them originate from state actors. If I can use the term “cyber-safety” to suggest safety while making use of the content and tools of the Internet, World Wide Web, and computing devices in general, it seems fair to say the expansion of these services and systems has been accompanied by a growth in their abuse. Moreover, it has been frequently observed that there is an asymmetry in the degree of abuse and harm that individuals can perpetrate on citizens, and on the varied infrastructure of our society. Vast harm and damage may be inflicted with only modest investment in resources. Whether we speak of damage and harm using computer-based tools or damage from lethal, homemade explosives, the asymmetry is apparent. While there remain serious potential threats to the well-being of citizens from entities we call nation- states, there are similarly serious potential threats originating with individuals and small groups.

None of which is false and the reader with a vague sense that some “we” is in danger from known and unknown actors.

To what degree? Unknown. Of what harm? Unknown. Chances of success? Unknown. Personal level of danger? Unknown.

What we do know is that on September 11, 2001, approximately 3,000 people died. Twelve years ago.

Deaths from medical misadventure are estimated to be 98,000 per year.

12 X 98,000 = 1,176,000 or 392 9/11 attack death totals.

Deaths due to medical misadventure are not known accurately but the overall comparison is a valid one.

Your odds of dying from medical misadventure are far higher than dying from a terrorist attack.

But, Vinson doesn’t warn you against death by medical misadventure. Instead you are warned there is some vague, even nebulous individuals or groups that seek to do you harm.

An unknown degree of harm. With some unknown rate of incidence.

And that position is to be taken seriously in a debate over privacy?

Most terrorism warnings are too vague for meaningful policy debate.

…Wheat Data Interoperability Working Group

Filed under: Agriculture,Data Integration,Interoperability — Patrick Durusau @ 3:50 pm

Case statement: Wheat Data Interoperability Working Group

From the post:

The draft case statement for the Wheat Data Interoperability Working Group has been released

The Wheat data interoperability WG is a working group of the RDA Agricultural data interest group. The working group will take advantage of other RDA’s working group’s production. In particular, the working group will be watchful of working groups concerned with metadata, data harmonization and data publishing. 

The working group will also interact with the WheatIS experts and other plant projects such as TransPLANT, agINFRA which are built on standard technologies for data exchange and representation. The Wheat data interoperability group will exploit existing collaboration mechanisms like CIARD to get as much as possible stakeholder involvement in the work.

If you want to contribute with comments, do not hesitate to contact the Wheat Data Interoperability Working Group at Working group “Wheat data interoperability”.

References

Wheat initiative Information System:

GARNet report – Making data accessible to all:

Various relevant refs:

I know, agricultural interoperability doesn’t have the snap of universal suffrage, the crackle of a technological singularity or the pop of first contact.

On the other hand, with a world population estimated at 7.108 billion people, agriculture is an essential activity.

The specifics of wheat data interoperability should narrow down to meaningful requirements. Requirements with measures of success or failure.

Unlike measuring progress towards or away from less precise goals.

Essential Collection of Visualisation Resources

Filed under: Data Mining,Graphics,Visualization — Patrick Durusau @ 3:27 pm

Essential Collection of Visualisation Resources by Andy Kirk.

The categories are:

Some of the resources you will have seen before but this site comes as close to being “essential” as any I have seen for visualization resources.

If you discover new or improved visualization resources, do us all a favor and send Andy a note.

Cartographies of Time:…

Filed under: Cartography,Maps,News,Time — Patrick Durusau @ 2:43 pm

Cartographies of Time: A Visual History of the Timeline by Maria Popova.

Maria reviews Cartographies of Time: A History of the Timeline by Daniel Rosenberg and Anthony Grafton.

More examples drawn from the text than analysis of the same.

The examples represent events but attempt to make the viewer aware of their embedding in time and place. A location that is only partially represented by a map.

I mention that because maps shown on news casts, particularly about military action, seem to operate the other way.

News maps appear to subtract time and its close cousin, distance, out of their maps.

Events happen in the artificial area created by the map, where the rules of normal physics don’t apply.

More troubling, the maps become the “reality” for the viewing audience rather than a representative of a much bloodier and more ambiguous reality on the ground.

Just curious if you have noticed that difference.

Elasticsearch Entity Resolution

Filed under: Deduplication,Duke,ElasticSearch,Entity Resolution — Patrick Durusau @ 2:24 pm

elasticsearch-entity-resolution by Yann Barraud.

From the webpage:

This project is an interactive entity resolution plugin for Elasticsearch based on Duke. Basically, it uses Bayesian probabilities to compute probability. You can pretty much use it an interactive deduplication engine.

It is usable as is, though cleaners are not yet implemented.

To understand basics, go to Duke project documentation.

A list of available comparators is available here.

Intereactive deduplication? Now that sounds very useful for topic map authoring.

Appropriate that I saw this in a Tweet by Duke‘s author, Lars Marius Garshol.

September 11, 2013

…all the people all the time.

Filed under: Cybersecurity,Encryption,NSA,Security — Patrick Durusau @ 5:18 pm

NIST has proven Lincoln’s adage:

You can fool some of the people all of the time, and all of the people some of the time, but you can not fool all of the people all of the time. (emphasis added)

Frank Konkel writes in: NIST reopens NSA-altered standards that:

The National Institute of Standards and Technology reopened the public comment period for already-adopted encryption standards that, according to leaked top-secret documents, were deliberately weakened by the National Security Agency.

Reopening the standards in question – Special Publication 800-90A and draft Special Publications 800-90B and 800-90C – gives the public a chance to weigh in again on encryption standards that were approved by NIST in 2006 for federal and worldwide use.

The move came Sept. 10, a swift response from NIST after several media outlets, including FCW, published articles that questioned the agency’s cryptographic standards development process after the leaks surfaced.
(…)

For your convenience:

Special Publication 800-90A

Draft SP 800-90 A Rev. 1

Draft SP 800-90 B

Draft SP 800-90 C

Disclaimer: I am reporting these links as they appear on the http://csrc.nist.gov website. The content they return may or may not be true and correct copies of the documents listed.

On the topic of reopened public comments, the following was posted at: http://csrc.nist.gov/publications/PubsDrafts.html:

In light of recent reports, NIST is reopening the public comment period for Special Publication 800-90A and draft Special Publications 800-90B and 800-90C.

NIST is interested in public review and comment to ensure that the recommendations are accurate and provide the strongest cryptographic recommendations possible.

The public comments will close on November 6, 2013. Comments should be sent to RBG_Comments@nist.gov.

In addition, the Computer Security Division has released a supplemental ITL Security Bulletin titled “NIST Opens Draft Special Publication 800-90A, Recommendation for Random Number Generation Using Deterministic Random Bit Generators, For Review and Comment (Supplemental ITL Bulletin for September 2013)” to support the draft revision effort.

If NIST got fooled, a pretty big if, rather than hide that possibility, NIST wants more public examination and comment to uncover it.

If you have the time and expertise, please contribute to this reexamination of these important encryption standards.

The NSA can corrupt the standards process if and only if enough of us stay home. Let’s disappoint them.

…Conceptual Model For Evolving Graphs

Filed under: Distributed Computing,Evoluntionary,Graphs,Networks — Patrick Durusau @ 5:17 pm

An Analytics-Aware Conceptual Model For Evolving Graphs by Amine Ghrab, Sabri Skhiri, Salim Jouili, and Esteban Zimanyi.

Abstract:

Graphs are ubiquitous data structures commonly used to represent highly connected data. Many real-world applications, such as social and biological networks, are modeled as graphs. To answer the surge for graph data management, many graph database solutions were developed. These databases are commonly classified as NoSQL graph databases, and they provide better support for graph data management than their relational counterparts. However, each of these databases implement their own operational graph data model, which differ among the products. Further, there is no commonly agreed conceptual model for graph databases.

In this paper, we introduce a novel conceptual model for graph databases. The aim of our model is to provide analysts with a set of simple, well-defined, and adaptable conceptual components to perform rich analysis tasks. These components take into account the evolving aspect of the graph. Our model is analytics-oriented, flexible and incremental, enabling analysis over evolving graph data. The proposed model provides a typing mechanism for the underlying graph, and formally defines the minimal set of data structures and operators needed to analyze the graph.

The authors concede that much work remains to be done, both theoretical and practical on their proposal.

With the rise of distributed computing, every “fact” depends upon a calculated moment of now. What was a “fact” five minutes ago may not longer be considered as a “fact” but as an “error.”

Who is responsible for changes in “facts,” warranties for “facts,” who gives and gets notices about changes in “facts,” all remain to be determined.

Models for evolving graphs may assist in untangling the rights, obligations and relationships that are nearly upon us with distributed computing.

Neo4j 2.0.0-M05 released

Filed under: Graphs,Neo4j — Patrick Durusau @ 5:16 pm

Neo4j 2.0.0-M05 released by Peter Neubauer.

From the post:

We are proud to release Neo4j 2.0.0-M05 as a milestone today. The 2.0 project is now in full speed development after summer vacation. We’re getting close to feature completeness now, and we want to get this release out to you so you can give us refined feedback for the final release.

Peter covers the following highlights:

  • Unique Constraints
  • Label store
  • AutoClosable transactions
  • Minimalistic Cypher and JSON
  • Deprecated > /dev/null

I’m not real sure what Peter means by “…summer vacation…,” must be one of those old European traditions. 😉

However, whatever that may mean, Neo4j 2.0.0-M05 does look like a must have release!

Input Requested: Survey on Legislative XML

Filed under: Law - Sources,Legal Informatics,Semantics — Patrick Durusau @ 5:15 pm

Input Requested: Survey on Legislative XML

A request for survey participants who are familiar with XML and law. To comment on the Crown Legislative Markup Language (CLML) which is used for the content at: legislation.gov.uk.

Background:

By way of background, the Crown Legislation Mark-up Language (CLML) is used to represent UK legislation in XML. It’s the base format for all legislation published on the legislation.gov.uk website. We make both the schema and all our data freely available for anyone to use, or re-use, under the UK government’s Open Government Licence. CLML is currently expressed as a W3C XML Schema which is owned and maintained by The National Archives. A version of the schema can be accessed online at http://www.legislation.gov.uk/schema/legislation.xsd . Legislation as CLML XML can be accessed from the website using the legislation.gov.uk API. Simply add “/data.xml” to any legislation content page, e.g. http://www.legislation.gov.uk/ukpga/2010/1/data.xml .

Why is this important for topic maps?

Would you believe that the markup semantics of CLML are different from the semantics of United States Legislative Markup (USLM)?

That’s just markup syntax differences. Hard to say what substantive semantic variations are in the laws themselves.

Mapping legal semantics becomes important when the United States claims extraterritorial jurisdiction for the application of its laws.

Or when the United States uses its finance laws to inflict harm on others. (Treasury’s war: the unleashing of a new era of financial warfare by Juan Carlos Zarate.)

Mapping legal semantics won’t make U.S. claims any less extreme but may help convince others of a clear and present danger.

how to write a to-do list

Filed under: Project Management,Time — Patrick Durusau @ 5:15 pm

Important: how to write a to-do list by Divya Pahwa.

From the post:

I remember trying out my first hour-by-hour schedule to help me get things done when I was 10. Wasn’t really my thing. I’ve since retired the hourly schedule, but I still rely on a daily to-do list.

I went through the same motions every night in university. I wrote out, by hand, my to-do list for the next day, ranked by priority. Beside each task I wrote down the number of hours each task should take.

This was and still is a habit and finding a system that works has been a struggle for me. I’ve tested out a variety of methods, bought a number of books on the subject, and experimented: colour-coded writing, post-it note reminders in the bathroom, apps, day-timers….you name it, I’ve tried it.

In my moment of retrospection I still wasn’t sure if my current system was spot on. So, I went on an adventure to figure out the most effective way to not only write my daily to-do list but to get more things done.

(…)

A friend was recently tasked with reading the latest “fad” management book. I can’t mention its name in case it appears in a search, etc. But it is one of those big print, wide margins, “…this has never been said this way before…,” type books.

Of course it has never been said that way before. Every rogue has a unique pitch for every fool they meet. I thought everyone knew that. Apparently not since rogues have to assure us they are unique in such publications.

I can’t help my friend but when I saw this short post on to-do lists, I thought it might help both you and me.

Oh, I keep to-do lists but too much stuff falls over to the next day, next day, etc. Some weeks I am better than others. Some weeks are worse.

Take it as a reminder of a best practice. A best practice that will make you more productive at very little expense.

No tapes, audio book, paperback book, software, binders (spiral or otherwise), etc. Hell, you don’t even need a smart phone to do it. 😉

Read Divya’s post and more importantly, put it into practice for a week.

Did you get more done than the week before?

Google expands define but drops dictionary

Filed under: Dictionary,Interface Research/Design,Topic Maps — Patrick Durusau @ 5:15 pm

Google expands define but drops dictionary by Karen Blakeman.

From the post:

Google has added extra information to its web definitions. When using the ‘define’ command, an expandable box now appears containing additional synonyms, how the word is used in a sentence, the origins of the word, the use of the word over time and translations. At the moment it is only available in Google.com and you no longer need the colon immediately after define. So, for definitions of dialectic simply type in define dialectic.

Google Define

The box gives definitions and synonyms of the word and the ‘More’ link gives you an example of its use in a sentence.
(…)

Karen lays out how you can use “define” to your best advantage.

What has my curiosity up is the thought of using a keyword like “define” in a topic map interface.

Rather than giving a user all the information about a subject, to create an on the fly thumbnail of a subject. Which a user can then follow or not.

Mikut Data Mining Tools Big List – Update

Filed under: Data Mining,Software — Patrick Durusau @ 5:14 pm

Mikut Data Mining Tools Big List – Update

From the post:

An update of the Excel table describing 325 recent and historical data mining tools is now online (Excel format), 31 of them were added since the last update in November 2012. These new updated tools include new published tools and some well-established tools with a statistical background.

Here is the full updated table of tools, (XLS format) which contains additional material to the paper

R. Mikut, M. Reischl: “Data Mining Tools“. Wiley Interdisciplinary Reviews: Data Mining and Knowledge Discovery. DOI: 10.1002/widm.24., September/October 2011, Vol. 1

Please help the authors to improve this Excel table:
Contact: ralf.mikut@kit.edu

The post includes a table of the active tools with hyperlinks.

After looking at the spreadsheet, I was puzzled to find that “active and relevant” tools number only one hundred (100).

Does that seem low to you? Especially with the duplication of basic capabilities in different languages?

If you spot any obvious omissions, please send them to: ralf.mikut@kit.edu

PostgreSQL 9.3 released!

Filed under: Database,PostgreSQL,SQL — Patrick Durusau @ 5:13 pm

PostgreSQL 9.3 released!

From the post:

The PostgreSQL Global Development Group announces the release of PostgreSQL 9.3, the latest version of the world’s leading open source relational database system. This release expands PostgreSQL’s reliability, availability, and ability to integrate with other databases. Users are already finding that they can build applications using version 9.3 which would not have been possible before.

“PostgreSQL 9.3 provides features that as an app developer I can use immediately: better JSON functionality, regular expression indexing, and easily federating databases with the Postgres foreign data wrapper. I have no idea how I completed projects without 9.3,” said Jonathan S. Katz, CTO of VenueBook.

From the what’s new page, an item of particular interest:

Writeable Foreign Tables:

“Foreign Data Wrappers” (FDW) were introduced in PostgreSQL 9.1, providing a way of accessing external data sources from within PostgreSQL using SQL. The original implementation was read-only, but 9.3 will enable write access as well, provided the individual FDW drivers have been updated to support this. At the time of writing, only the Redis and PostgreSQL drivers have write support (need to verify this).

I haven’t gotten through the documentation on FDW but for data integration it sounds quite helpful.

Assuming you document the semantics of the data you are writing back and forth. 😉

A use case for a topic map that spans both the local and “foreign” data source or separate topic maps for the local and “foreign” data source that can then be merged together.

Twitter Data Analytics

Filed under: Data Analysis,Social Media,Tweets — Patrick Durusau @ 5:13 pm

Twitter Data Analytics by Shamanth Kumar, Fred Morstatter, and Huan Liu.

From the webpage:

Social media has become a major platform for information sharing. Due to its openness in sharing data, Twitter is a prime example of social media in which researchers can verify their hypotheses, and practitioners can mine interesting patterns and build realworld applications. This book takes a reader through the process of harnessing Twitter data to find answers to intriguing questions. We begin with an introduction to the process of collecting data through Twitter’s APIs and proceed to discuss strategies for curating large datasets. We then guide the reader through the process of visualizing Twitter data with realworld examples, present challenges and complexities of building visual analytic tools, and provide strategies to address these issues. We show by example how some powerful measures can be computed using various Twitter data sources. This book is designed to provide researchers, practitioners, project managers, and graduate students new to the field with an entry point to jump start their endeavors. It also serves as a convenient reference for readers seasoned in Twitter data analysis.

Preprint with data set on analyzing Twitter data.

Although running a scant seventy-nine (79) pages, including an index, Twitter Data Analytics (TDA) covers:

Each chapter end with suggestions for further reading and references.

In addition to learning more about Twitter and its APIs, the reader will be introduced to MondoDB, JUNG and D3.

No mean accomplishment for seventy-nine (79) pages!

Tangle Machines

Filed under: Data Structures,Topology — Patrick Durusau @ 5:12 pm

Daniel Moskovich has started a thread on what he calls: “Tangle Machines.”

The series started with Tangle Machines- Positioning claim.

From that post:

Avishy Carmi and I are in the process of finalizing a preprint on what we call “tangle machines”, which are knot-like objects which store and process information. Topologically, these roughly correspond to embedded rack-coloured networks of 2-spheres connected by line segments. Tangle machines aren’t classical knots, or 2-knots, or knotted handlebodies, or virtual knots, or even w-knot. They’re a new object of study which I would like to market.

Below is my marketing strategy.

My positioning claim is:

  • Tangle machines blaze a trail to information topology.

My three supporting points are:

  • Tangle machines pre-exist in a the sense of Plato. If you look at a knot from the perspective of information theory, you are inevitably led to their definition.
  • Tangle machines are interesting mathematical objects with rich algebraic structure which present a plethora of new and interesting questions with information theoretic content.
  • Tangle machines provide a language in which one might model “real-world” classical and quantum interacting processes in a new and useful way.

Next post, I’ll introduce tangle machines. Right now, I’d like to preface the discussion with a content-free pseudo-philosophical rant, which argues that different approaches to knot theory give rise to different `most natural’ objects of study.

You know where Daniel lost me in his sales pitch. 😉

But, it’s Daniel’s story so read on “as though” knots “pre-exist,” even though he later concedes the pre-existing claim cannot be proven or even tested.

Tangle Machines- Part 1 by Daniel Moskovich begins:

In today’s post, I will define tangle machines. In subsequent posts, I’ll realize them topologically and describe how we study them and more about what they mean.

To connect to what we already know, as a rough first approximation, a tangle machine is an algebraic structure obtained from taking a knot diagram coloured by a rack, then building a graph whose vertices correspond to the arcs of the diagram and whose edges correspond to crossings (the overcrossing arc is a single unit- so it “acts on” one undercrossing arc to change its colour and to convert it into another undercrossing arc). Such considerations give rise to a combinatorial diagrammatic-algebraic setup, and tangle machines are what comes from taking this setup seriously. One dream is that this setup is well-suited to modeling mutually interacting processes which satisfy a natural `conservation law’- and to move in a very applied direction of actually identifying tangle machine inside data.

To whet your appetite, below is a pretty figure illustrating a 926 knot hiding inside a synthetic collection of phase transitions between anyons (an artificial and unrealistic collection; the hope is to find such things inside real-world data):

Hard to say if in the long run this “new” data structure will be useful or not.

Do stay tuned for future developments.

September 10, 2013

Inside the world’s biggest agile software project disaster

Filed under: Programming,Project Management,Requirements — Patrick Durusau @ 11:02 am

Inside the world’s biggest agile software project disaster by Lucy Carey.

From the post:

In theory, it was a good idea – using a smart new methodology to unravel a legacy of bureaucratic tangles. In reality, execution of the world’s largest agile software project has been less than impressive.

By developing its flagship Universal Credit (UC) digital project – an initiative designed to merge six separate benefits strands into one – using agile principles, the UK Department for Work and Pensions (DWP) hoped to decisively lay the ghosts of past DWP-backed digital projects to bed.

Unfortunately, a report by the National Audit Office (NAO) has demonstrated that the UK government’s IT gremlins remain in rude health, with £34 million of new IT assets to date written off by the DWP on this project alone. Moreover, the report states that the project has failed to deliver its rollout targets, and that the DWP is now unsure how much of its current IT will be viable for a national rollout – all pretty damning indictments for an initiative that was supposed to be demonstrating the merits of the Agile Framework for central UK government systems.

Perhaps one of the most biggest errors for implementing an agile approach highlighted by the NAO is the failure of the DWP to define how it would monitor progress or document decisions and the need to integrate the new systems with existing IT, procured and managed assuming the traditional ‘waterfall’ approach.
(…)

Don’t take this post wrong. It is equally easy to screw up with a “waterfall” approach to project management. Particularly with inadequate management, documentation and requirements.

However, this is too good of an example of why everyone in a project should be pushed to write down with some degree of precision what they expect, how to know when it arrives and deadlines for meeting their expectations.

Without all of that in writing, shared writing with the entire team, project “success” will be a matter of face saving and not accomplishment of the original goals, whatever they may have been.

Graphity Server for social activity streams released (GPLv3)

Filed under: Graphs,Neo4j — Patrick Durusau @ 10:51 am

Graphity Server for social activity streams released (GPLv3) by René Pickhardt.

From the post:

It is almost 2 years over since I published my first ideas and works on graphity which is nowadays a collection of algorithms to support efficient storage and retrieval of more than 10k social activity streams per second. You know the typical application of twitter, facebook and co. Retrieve the most current status updates from your circle of friends.

Today I proudly present the first version of the Graphity News Stream Server. Big thanks to Sebastian Schlicht who worked for me implementing most of the Servlet and did an amazing job! The Graphity Server is a neo4j powered servlet with the following properties:

  • Response times for requests are usually less than 10 milliseconds (+network i/o e.g. TCP round trips coming from HTTP)
  • The Graphity News Stream Server is a free open source software (GPLv3) and hosted in the metalcon git repository. (Please also use the bug tracker there to submit bugs and feature requests)
  • It is running two Graphity algorithms: One is read optimized and the other one is write optimized, if you expect your application to have more write than read requests.
  • The server comes with an REST API which makes it easy to hang in the server in whatever application you have.
  • The server’s response also follows the activitystrea.ms format so out of the box there are a large amount of clients available to render the response of the server.
  • The server ships together with unit tests and extensive documentation especially of the news stream server protocol (NSSP) which specifies how to talk to the server. The server can currently handle about 100 write requests in medium size (about a million nodes) networks. I do not recommend to use this server if you expect your user base to grow beyond 10 Mio. users (though we are working to get the server scaling) This is mostly due to the fact that our data base right now won’t really scale beyond one machine and some internal stuff has to be handled synchronized.

Koding.com is currently thinking to implement Graphity like algorithms to power their activity streams. It was for Richard from their team who pointed out in a very fruitfull discussion how to avoid the neo4j limit of 2^15 = 32768 relationship types by using an overlay network. So his ideas of an overlay network have been implemented in the read optimized graphity algorithm. Big thanks to him!

Now I am relly excited to see what kind of applications you will build when using Graphity.

If you’ll use graphity

Please tell me if you start using Graphity, that would be awesome to know and I will most certainly include you to a list of testimonials.

By they way if you want to help spreading the server (which is also good for you since more developer using it means higher chance to get newer versions) you can vote up my answer in stack overflow:

http://stackoverflow.com/questions/202198/whats-the-best-manner-of-implementing-a-social-activity-stream/13171306#13171306

This is very cool!

Take Graphity for a spin and let René know what you think.

Perhaps we can all hide in digital chaff? 😉

How To Capitalize on Clickstream data with Hadoop

Filed under: Hadoop,Marketing — Patrick Durusau @ 10:17 am

How To Capitalize on Clickstream data with Hadoop by Cheryle Custer.

From the post:

In the last 60 seconds there were 1,300 new mobile users and there were 100,000 new tweets. As you contemplate what happens in an internet minute Amazon brought in $83,000 worth of sales. What would be the impact of you being able to identify:

  • What is the most efficient path for a site visitor to research a product, and then buy it?
  • What products do visitors tend to buy together, and what are they most likely to buy in the future?
  • Where should I spend resources on fixing or enhancing the user experience on my website?

In the Hortonworks Sandbox, you can run a simulation of website Clickstream behavior to see where users are located and what they are doing on the website. This tutorial provides a dataset of a fictitious website and the behavior of the visitors on the site over a 5 day period. This is a 4 million line dataset that is easily ingested into the single node cluster of the Sandbox via HCatalog.

The first paragraph is what I would call an Economist lead-in. It captures your attention:

…60 seconds…1300 new mobile users …100,000 new tweets. …minute…Amazon…$83,000…sales.

If the Economist is your regular fare, your pulse rate went up at “1300 new mobile users” and by the minute/$83,000 you started to tingle. 😉

How to translate that for semantic technologies in general and topic maps in particular?

Remember The Monstrous Cost of Work Failure graphic?

Where we read that 58% of employees spend one-half of a workday “filing, deleting, or sorting information.”

Just to simplify the numbers, one-quarter (1/4) of your total workforce hours are spent on “filing, deleting, or sorting information.”

Divide your current payroll figure by four (4).

Does that result get your attention?

If not, call emergency services. You are dead or having a medical crisis.

Use that payroll division as:

A positive, topic maps can help you recapture some of that 1/4 of your payroll, or

A negative, topic maps can help you stem the bleeding from non-productive activity,

depending on which will be more effective with a particular client.

BTW, do read Cheryle’s post.

Hadoop’s capabilities are more limited by your imagination than any theoretical CS limit.

Clusters and DBScan

Filed under: Clustering,K-Means Clustering,Subject Identity — Patrick Durusau @ 9:46 am

Clusters and DBScan by Jesse Johnson.

From the post:

A few weeks ago, I mentioned the idea of a clustering algorithm, but here’s a recap of the idea: Often, a single data set will be made up of different groups of data points, each of which corresponds to a different type of point or a different phenomenon that generated the points. For example, in the classic iris data set, the coordinates of each data point are measurements taken from an iris flower. There are 150 data points, with 50 from each of three species. As one might expect, these data points form three (mostly) distinct groups, called clusters. For a general data set, if we know how many clusters there are and that each cluster is a simple shape like a Gaussian blob, we could determine the structure of the data set using something like K-means or a mixture model. However, in many cases the clusters that make up a data set do not have a simple structure, or we may not know how many there are. In these situations, we need a more flexible algorithm. (Note that K-means is often thought of as a clustering algorithm, but note I’m going to, since it assumes a particular structure for each cluster.)

Jesse has started a series of post on clustering that you will find quite useful.

Particularly if you share my view that clustering is the semantic equivalent of “merging” in TMDM terms without the management of item identifiers.

In the final comment in parentheses, “Note that K-means…” is awkwardly worded. From later in the post you learn that Jesse doesn’t consider K-means to be a clustering algorithm at all.

Wikipedia on DBScan. Which reports that scikit-learn includes a Python implementation of DBScan.

Greetings Intelligence Adversaries!

Filed under: Cybersecurity,NSA,Security — Patrick Durusau @ 4:44 am

Recent disclosures drew this statement from the Office of the Director of National Intelligence:

It should hardly be surprising that our intelligence agencies seek ways to counteract our adversaries’ use of encryption. Throughout history, nations have used encryption to protect their secrets, and today, terrorists, cybercriminals, human traffickers and others also use code to hide their activities. Our intelligence community would not be doing its job if we did not try to counter that.

While the specifics of how our intelligence agencies carry out this cryptanalytic mission have been kept secret, the fact that NSA’s mission includes deciphering enciphered communications is not a secret, and is not news. Indeed, NSA’s public website states that its mission includes leading “the U.S. Government in cryptology … in order to gain a decision advantage for the Nation and our allies.”

The stories published yesterday, however, reveal specific and classified details about how we conduct this critical intelligence activity. Anything that yesterday’s disclosures add to the ongoing public debate is outweighed by the road map they give to our adversaries about the specific techniques we are using to try to intercept their communications in our attempts to keep America and our allies safe and to provide our leaders with the information they need to make difficult and critical national security decisions. (emphasis added)

If you expect your banking, shopping, medical, email or other information to be withheld from U.S. intelligence agencies, you are in the same class as “terrorists, cybercriminals [and] human traffickers.”

An attempt at privacy is evidence that you are working against the intelligence community and by inference, the preservation of America.

We were at a dangerous point on that slippery slope some time ago. Since then the intelligence community slid into a paranoid fantasy land and is attempting to drag other segments of government with it.

Are there people and/or organizations that would like to hurt the U.S. and/or its citizens? Given the abusive/exploitive relationship the U.S. has maintained for over a century with other countries, I would suspect so.

One response to view everyone as a threat and potential source of well-deserved retribution. Your defense being to rely upon abuse and exploitation.

Another response is to “be a blessing” to others, both personally and on a national level.

We can follow the intelligence community into more cycles of paranoia and pain or choose to break that cycle for a chance at healing.

Your call.


PS: Sorry, forgot to cite the source on the Director of National Intelligence quote. Would not want you to think I read his draft email or something. 😉

Revealed: The NSA’s Secret Campaign to Crack, Undermine Internet Security

Migrating [AMA] search to Solr

Filed under: Searching,Solr — Patrick Durusau @ 3:59 am

Migrating American Medical Association’s search to Solr by Doug Turnbull.

Read the entire post but one particular point is important to me:

Research journal users value recent publications very highly. Users want to see recent research, not just documents that score well due to how frequently search terms occur in a document. If you were a doctor, would you rather see brain cancer research that occurred this decade or in the early 20th century?

I call this out because it is one of my favorite peeves about Google search results.

Even if generalized date parsing is too hard, Google should know when it first encountered a particular resource.

At the very least a listing by “age” of a link should be trivially possible.

How important is recent information to your users?

Building the Perfect Cassandra Test Environment

Filed under: Cassandra — Patrick Durusau @ 3:42 am

Building the Perfect Cassandra Test Environment by John Berryman.

John outlines the qualities of a Cassandra test framework as follows:

  • Light-weight and available — A good test framework will take up as little resources as possible and be accessible right when you want it.
  • Parity with Production — The test environment should perfectly simulate the production environment. This is a no-brainer. After all what good does it do you to pass a test only to wonder whether or not an error lurks in the differences between the test and production environments?
  • Stateless — Between running tests, there’s no reason to keep any information around. So why not just throw it all away?
  • Isolated — Most often there will be several developers on a team, and there’s a good chance they’ll be testing things at the same time. It’s important to keep each developer quarantined from the others.
  • Fault Resistant — Remember, we’re a little concerned here that Cassandra is going to be a resource hog or otherwise just not work. Being “fault resistant” means striking the right balance so that Cassandra takes up as little resources as possible without actually failing.

Projects without test environments are like sky diving without a main chute, only the reserve.

If it works, ok. If not, very much not ok.

With John’s notes, you too can have a Cassandra test environment!

Aerospike 3

Filed under: Aerospike,NoSQL — Patrick Durusau @ 3:12 am

Aerospike 3 by Alex Popescu.

From the post:

Aerospike 3 database builds off of Aerospike’s legacy of speed, scale, and reliability, adding an extensible data model that supports complex data types, large data types, queries using secondary indexes, user defined functions (UDFs) and distributed aggregations. Process more data faster to create the richest, most relevant real-time interactions.

Aerospike 3 Community Edition is a free unlimited license designed for a single cluster of up to two nodes and storage of up to 200GB of data. Enterprise version is available upon request.

Try the FREE version now.

Alex has picked up a new sponsor that merits your attention!

From the community download page:

Free Aerospike 3 Community Edition is a full copy of Aerospike Database, in a 2-node cluster configuration that supports a database up to 200 GB in size. For example, if you have 125 million records at 1.5 K bytes/object, you can do 16k reads/sec and 8k/writes/sec with data on SSD. Or, if you are deploying an in-memory database, you can handle 60k reads/sec and 30k writes/sec. This product includes:

  • Unlimited license to use the software forever. No fees, no strings attached.
  • Access to online forums and documentation
  • Tools for setting up and managing two Aerospike Servers in a single Aerospike Cluster
  • Aerospike Server software and Aerospike SDK for developing your database client application
  • When scale demands, easy upgrade to the Enterprise Edition without stopping your service!

The in-memory performance numbers look particularly impressive!

Paperscape

Filed under: Bibliography,Graphics,Interface Research/Design,Visualization — Patrick Durusau @ 2:55 am

Paperscape

A mapping of papers from arXiv.

I had to “zoom in” a fair amount to get a useful view of the map. Choosing any paper displays its bibliographic information with links to that paper.

Quite clever but I can’t help but think of what a more granular map might offer.

More “granular” in the sense of going below the document level to terms/concepts in each paper and locating them in a stream of discussion by different authors.

Akin to the typical “review” article that traces particular ideas through a series of publications.

But in any event, I commend Paperscape to you as a very clever bit of work.

I first saw this in Nat Torkington’s Four short links: 9 September 2013.

September 9, 2013

NSA:…bound by laws of computational complexity

Filed under: Cybersecurity,NSA,Security — Patrick Durusau @ 6:25 pm

NSA: Possibly breaking US laws, but still bound by laws of computational complexity by Scott Aaronson.

From the post:

Last week, I got an email from a journalist with the following inquiry. The recent Snowden revelations, which made public for the first time the US government’s “black budget,” contained the following enigmatic line from the Director of National Intelligence: “We are investing in groundbreaking cryptanalytic capabilities to defeat adversarial cryptography and exploit internet traffic.” So, the journalist wanted to know, what could these “groundbreaking” capabilities be? And in particular, was it possible that the NSA was buying quantum computers from D-Wave, and using them to run Shor’s algorithm to break the RSA cryptosystem?

I replied that, yes, that’s “possible,” but only in the same sense that it’s “possible” that the NSA is using the Easter Bunny for the same purpose. (For one thing, D-Wave themselves have said repeatedly that they have no interest in Shor’s algorithm or factoring. Admittedly, I guess that’s what D-Wave would say, were they making deals with NSA on the sly! But it’s also what the Easter Bunny would say.) More generally, I said that if the open scientific world’s understanding is anywhere close to correct, then quantum computing might someday become a practical threat to cryptographic security, but it isn’t one yet.

That, of course, raised the extremely interesting question of what “groundbreaking capabilities” the Director of National Intelligence was referring to. I said my personal guess was that, with ~99% probability, he meant various implementation vulnerabilities and side-channel attacks—the sort of thing that we know has compromised deployed cryptosystems many times in the past, but where it’s very easy to believe that the NSA is ahead of the open world. With ~1% probability, I guessed, the NSA made some sort of big improvement in classical algorithms for factoring, discrete log, or other number-theoretic problems. (I would’ve guessed even less than 1% probability for the latter, before the recent breakthrough by Joux solving discrete log in fields of small characteristic in quasipolynomial time.)

Scott goes on to point out that known encryption techniques, when used properly, put a major cramp on the style of data collectors. Why else would they be strong arming technology companies for back doors?

Solution? Make encryption the default and easier to use.

For example, email clients should come with default security (2048 bits anyone?) enabled and should store passwords to encrypt and decrypt. Bad security? You bet, but it does make it easier to use security for email across the Internet.

The more encrypted email that crosses the net, the more privacy for all of us.

Back doors? The only known solution for back doors is open source software.

STEFFI…

Filed under: Graphs,Neo4j,STEFFI,Titan — Patrick Durusau @ 6:03 pm

STEFFI – Scalable Traversal Engine For Fast In-memory graphDB

From the webpage:

STEFFI is a distributed graph database fully in-memory and amazingly fast when it comes to querying large datasets.

As a scalable graph database, STEFFI’s performance can directly be compared to Neo4j and Titan. It provides its users with a clear competitive advantage when it comes to complicated traversal operations on large datasets. Speedups of up to 200 have been observed when comparing STEFFI whith its alternatives.

More than an alternative to existing solutions, STEFFI opens up new possibilities for high-performance graph storage and manipulation.

Main features

  • in-memory storage for a fast random access
  • distributed parallel computing for high-speed graph queries
  • graph traversal engine for graph processing
  • scalability for a growing data
  • implementing the Blueprints API from tinkerpop for an enchanced accessibility

Recommended for

  • fast recommendation engines (e-commerce, telecommunications, finance, …)
  • large biological networks analysis (biopharma, healthcare, … )
  • security networks management & real-time fraud detection (bank, public institutions, …)
  • complex network & data center management (telecommunications, e-commerce, …)
  • and much more!

Availability

STEFFI is currently in its incubation phase within EURA NOVA. Once the code is mature and stable enough, STEFFI will be provided via this website under the Apache Licence Version 2. If you would like to know more about this project evolution, do not hesitate to subscribe to our mailing list or contact EURA NOVA.

I haven’t run the performance tests personally against Neo4j and Titan but the reported performance gains (200X and 150X, respectively) are impressive.

BTW, you probably want the paper that lead to STEFFI, imGraph: A distributed in-memory graph database by Salim Jouili and Aldemar Reynaga.

« Newer PostsOlder Posts »

Powered by WordPress