Another Word For It Patrick Durusau on Topic Maps and Semantic Diversity

June 24, 2013

Quantitative Research and Eye-Tracking:…

Filed under: Interface Research/Design,Usability,Users,UX — Patrick Durusau @ 1:33 pm

Quantitative Research and Eye-Tracking: A match made in UX heaven by James Breeze and Alexis Conomos.

From the post:

Administering many sessions of usability testing has shown us that people either attribute their failures to forces outside of their control (e.g. “The website doesn’t work and needs to be fixed) or to things they have influence over (e.g. “I’m not that good with computers but I could probably learn how to use it”).

A person’s perceived influence over outcomes is known, in psychobabble, as their ‘locus of control’ and it has a profound effect on usability testing results.

Qualitative data and verbatims from individuals with an internal locus of control often reflect a positive user experience, even when they have made several errors performing tasks. Similar to the respondent in the scenario depicted in the cartoon below, these individuals attribute their errors to their own actions, rather than failures of the product being tested.

(…)

The higher end of research on user experiences with technology.

Being aware of the issues may help you even if you lack funding for some of the tools and testing described in the post.

GraphLab Image Processing Toolkit – Image Stitching

Filed under: GraphLab,Graphs,Image Processing — Patrick Durusau @ 1:25 pm

GraphLab Image Processing Toolkit – Image Stitching by Danny Bickson.

From the post:

We got some exciting news from Dhruv Batra from Virginia Tech:

Dear Graphlab team,

As most of you know, I was working on the Graphlab computer vision toolbox last summer. The motivation behind it was to provide distributed implementations of computer vision algorithms as a service.

In that spirit, I am happy to announce that that my students and I have a produced a first version of CloudCV.

— In the first version, the only implemented algorithm is image stitching
— The front-end allows you to upload a collection of images, which will be stitched to create a panorama.

— The back-end is a server in my lab running our local repository of graphlab
— We are currently running stitching in shared-memory parallel mode with ncpus = 3.

— The ‘terminal’ in the webpage will show you familiar looking messages from graphlab.

Cheers,
Dhruv

Danny includes some images to try out.

Or, you can try some images from your favorite image repository. 😉

Laasie: Building the next generation of collaborative applications

Filed under: Collaboration,Editor,Topic Map Software — Patrick Durusau @ 1:17 pm

Laasie: Building the next generation of collaborative applications by Oliver Kennedy.

From the post:

With the first Laasie paper (ever) being presented tomorrow at WebDB (part of SIGMOD), I thought it might be a good idea to explain the hubbub. What is Laasie?

The short version is that it’s an incremental state replication and persistence infrastructure, targeted mostly at web applications. In particular, we’re focusing on a class of collaborative applications, where multiple users interact with the same application state simultaneously. A commonly known instance of such applications is the Google Docs office suite. Multiple users viewing the same document can simultaneously both view and edit the document.

Do your topic maps collaborate with other topic maps?

Mapping Metaphor with the Historical Thesaurus

Filed under: Graphics,Metaphors,Thesaurus,Visualization — Patrick Durusau @ 9:36 am

Mapping Metaphor with the Historical Thesaurus: Visualization of Links

From the post:

By the end of the Mapping Metaphor with the Historical Thesaurus project we will have a web resource which allows the user to find pathways into our data. It will show a map of the conceptual metaphors of English over the last thousand years, showing links between each semantic area where we find evidence of metaphorical overlap. Unsurprisingly, given the visual and spatial metaphors which we are necessarily already using to describe our data and the analysis of it (e.g pathways and maps), this will be represented graphically as well as in more traditional forms.

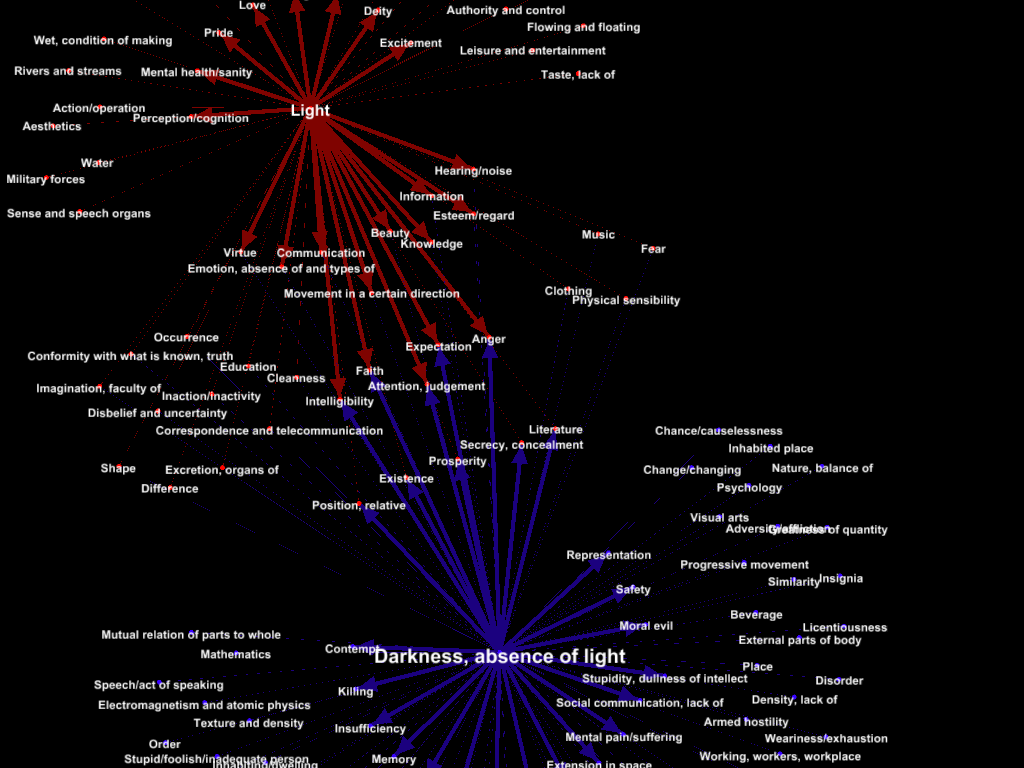
Below is a very early (in the project) example of a visualisation of the semantic domains of ‘Light’ and ‘Darkness, absence of light’, showing their metaphorical links with other semantic areas in the Historical Thesaurus data. We produced this using the program Gephi, which allows links between nodes to be shown using different colours, thickness of lines, etc.

Light and Darkness

From the project description at University of Glasgow, School of Critical Studies:

Over the past 30 years, it has become clear that metaphor is not simply a literary phenomenon; metaphorical thinking underlies the way we make sense of the world conceptually. When we talk about ‘a healthy economy’ or ‘a clear argument’ we are using expressions that imply the mapping of one domain of experience (e.g. medicine, sight) onto another (e.g. finance, perception). When we describe an argument in terms of warfare or destruction (‘he demolished my case’), we may be saying something about the society we live in. The study of metaphor is therefore of vital interest to scholars in many fields, including linguists and psychologists, as well as to scholars of literature.

Key questions about metaphor remain to be answered; for example, how did metaphors arise? Which domains of experience are most prominent in metaphorical expressions? How have the metaphors available in English developed over the centuries in response to social changes? With the completion of the Historical Thesaurus, published as the Historical Thesaurus of the Oxford English Dictionary by OUP (Kay, Roberts, Samuels, Wotherspoon eds, 2009), we can begin to address these questions comprehensively and in detail for the first time. We now have the opportunity to track how metaphorical ways of thinking and expressing ourselves have changed over more than a millennium.

Almost half a century in the making, the Historical Thesaurus is the first source in the world to offer a comprehensive semantic classification of the words forming the written record of a language. In the case of English, this record covers thirteen centuries of change and development, in metaphor as in other areas. We will use the Historical Thesaurus evidence base to investigate how the language of one domain of experience (e.g. medicine) contributes to others (e.g. finance). As we proceed, we will be able to see innovations in metaphorical thinking at particular periods or in particular areas of experience, such as the Renaissance, the scientific revolution, and the early days of psychoanalysis.

To achieve our goals, we will devise tools for the analysis of metaphor historically, beginning with a systematic identification of instances where words extend their meanings from one domain into another. An annotated ‘Metaphor Map’, which will be freely available online, will allow us to demonstrate when and how significant shifts in meaning took place. On the basis of this evidence, the team will produce series of case studies and a book examining key domains of metaphorical meaning.

Conference papers from the project.

What a wickedly topic map-like idea!

OpenGLAM

Filed under: Archives,Library,Museums,Open Data — Patrick Durusau @ 9:14 am

OpenGLAM

From the FAQ:

What is OpenGLAM?

OpenGLAM (Galleries, Libraries, Archives and Museum) is an initiative coordinated by the Open Knowledge Foundation that is committed to building a global cultural commons for everyone to use, access and enjoy.

OpenGLAM helps cultural institutions to open up their content and data through hands-on workshops, documentation and guidance and it supports a network of open culture evangelists through its Working Group.

What do we mean by “open”?

“Open” is a term you hear a lot these days. We’ve tried to get some clarity around this important issue by developing a clear and succinct definition of openness – see Open Definition.

The Open Definition says that a piece of content or data is open if “anyone is free to use, reuse, and redistribute it — subject only, at most, to the requirement to attribute and/or share-alike.”

There a number of Open Definition compliant licenses that GLAMs are increasingly using to license digital content and data that they hold. Popular ones for data include CC-0 and for content CC-BY or CC-BY-SA are often used.

Open access to cultural heritage materials will grow the need for better indexing/organization. As if you needed another reason to support it. 😉

June 23, 2013

Magnify Digital Images – 700 times faster

Filed under: Graphics,Visualization — Patrick Durusau @ 6:57 pm

A new method that is 700 times faster than the norm is developed to magnify digital images

From the post:

Aránzazu Jurío-Munárriz, a graduate in computer engineering from the NUP/UPNA-Public University of Navarre, has in her PhD thesis presented new methods for improving two of the most widespread means used in digital image processing: magnification and thresholding. Her algorithm to magnify images stands out not only due to the quality obtained but also due to the time it takes to execute, which is 700 times less than other existing methods that obtain the same quality.

Image processing consists of a set of techniques that are applied to images to solve two problems: to improve the visual quality and to process the information contained in the image so that a computer can understand it on its own.

Nowadays, image thresholding is used to resolve many problems. Some of them include remote sensing where it is necessary to locate specific objects like rivers, forests or crops in aerial images; the analysis of medical tests to locate different structures (organs, tumours, etc.), to measure the volumes of tissue and even to carry out computer-guided surgery; or the recognition of patterns, for example to identify a vehicle registration plate at the entrance to a car park or for personal identification by means of fingerprints. “Image thresholding separates out each of the objects that comprise the image,” explains Aránzazu Jurío. To do this, each of the pixels is analysed so that all the ones sharing the same features are considered to form part of the same object.”

The thesis entitled “Numerical measures for image processing. Magnification and Thresholding” has produced six papers, which have been published in the most highly rated journals in the field.

Sounds great but I wasn’t able to quickly find any accessible references to point out.

Yahoo! Search Blog moved!

Filed under: Yahoo! — Patrick Durusau @ 2:57 pm

Just in case you noticed that Yahoo! Search Blog has moved and left you an incorrect forwarding address: yahoosearch.tumblr.com.

FYI: The correct address is: http://www.ysearchblog.com/.

Microsoft kicks off its own bug bounty programme [seed money?]

Filed under: Cybersecurity,Funding — Patrick Durusau @ 2:53 pm

Microsoft kicks off its own bug bounty programme

From the post:

Microsoft has announced a three-pronged bug bounty programme for its upcoming Windows and Internet Explorer versions. The company will start paying security researchers for disclosing security vulnerabilities to it in a responsible manner, similar to Google’s bug bounty programme for Chrome and Chrome OS that has been ongoing since 2010. Under Microsoft’s new initiative, researchers can report vulnerabilities in the under-development Windows 8.1 and the preview of its Internet Explorer 11 browser. If submissions are accompanied by ideas about how to defend against the attack, the submitting researcher will earn a substantial monetary bonus.

Under the Mitigation Bypass Bounty category, Microsoft will pay researchers up to $100,000 for “truly novel exploitation techniques” against the protections of the latest version of Windows, with up to an additional $50,000 BlueHat Bonus for Defense for ideas how to defend against them. These two categories are open indefinitely. Until 26 July, researchers can also earn up to $11,000 for reporting critical vulnerabilities that affect the Internet Explorer 11 Preview on Windows 8.1 Preview. The company’s bug bounty programme will open for submissions on 26 June, the same day that the company plans to release the Windows 8.1 preview to the wider public.

I mention this as a source of funding for startups, particularly those interested in topic maps.

Introduction to Apache HBase Snapshots, Part 2: Deeper Dive

Filed under: HBase — Patrick Durusau @ 2:35 pm

Introduction to Apache HBase Snapshots, Part 2: Deeper Dive by Matteo Bertozzi.

From the post:

In Part 1 of this series about Apache HBase snapshots, you learned how to use the new Snapshots feature and a bit of theory behind the implementation. Now, it’s time to dive into the technical details a bit more deeply.

I have been reading about writing styles recently and one author suggested that every novel start with the second chapter.

That is show the characters in action and get the audience to caring about them before filling in the background.

All of the details in Matteo’s post are important, but you have to get near the end to answer the question: Why should I care?

Try this:

*****
Have you ever deleted a file or table that should not have been deleted?

The cloning and restoration features of HBase snapshots can save you embarrassment, awkward explanations and possibly even your position.
*****
Now read Matteo’s post.

Did that make a difference?

Announcing Yet Another Big Data Book

Filed under: BigData — Patrick Durusau @ 2:17 pm

Announcing Yet Another Big Data Book (but this one by a local author) by Jules J. Berman.

From the post:

My book, Principles of Big Data: Preparing, Sharing, and Analyzing Complex Information was published this month, and Sean Murphy invited me to write a few words about Big Data (and to plug the book).

Berman lists his main points as:

1. Identifiers: you cannot create a good Big Data resource without them.

2. Data should be described with metadata, and the metadata descriptors should be organized under a classification or an ontology.

3. Big Data must be immutable.

4. Big Data must be accessible to the public if it is to have any scientific value.

5.Data analysis is important, but data re-analysis is much more important.

Sounds interesting but there aren’t enough reviews online for me to splurge on a copy just yet.

BTW, if you read Berman’s post you will find a discount code you can use for 30% off and free shipping at the Elsevier order site.

I am particularly sympathetic to the immutable data point.

We either are at or nearly at the point of eliminating the need for data to change, ever.

Which should make auditing financial records easier. Change will be difficult and the first sign of fraud.

Not sure if present governments will survive the transition.

Mapping Twitter demographics

Filed under: Graphics,Tweets,Visualization — Patrick Durusau @ 2:04 pm

Mapping Twitter demographics by Nathan Yau.

languages of twitter

Nathan has uncovered an interactive map of over 3 billion tweets by MapBox, along with Gnip and Eric Fischer.

See Nathan’s post for details.

How to Contribute to HBase and Hadoop 2.0

Filed under: Hadoop,HBase — Patrick Durusau @ 1:58 pm

How to Contribute to HBase and Hadoop 2.0 by Nick Dimiduk.

From the post:

In case you haven’t heard, Hadoop 2.0 is on the way! There are loads more new features than I can begin to enumerate, including lots of interesting enhancements to HDFS for online applications like HBase. One of the most anticipated new features is YARN, an entirely new way to think about deploying applications across your Hadoop cluster. It’s easy to think of YARN as the infrastructure necessary to turn Hadoop into a cloud-like runtime for deploying and scaling data-centric applications. Early examples of such applications are rare, but two noteworthy examples are Knitting Boar and Storm on YARN. Hadoop 2.0 will also ship a MapReduce implementation built on top of YARN that is binary compatible with applications written for MapReduce on Hadoop-1.x.

The HBase project is rearing to get onto this new platform as well. Hadoop2 will be a fully supported deployment environment for HBase 0.96 release. There are still lots of bugs to squish and the build lights aren’t green yet. That’s where you come in!

To really “know” software you can:

  • Teach it.
  • Write (good) documentation about it.
  • Squash bugs.

Nick is inviting you to squash bugs for HBase and Hadoop 2.0.

Memories of sun drenched debauchery will fade.

Being a contributor to an Apache project over the summer won’t.

Last chance registration to the 2nd GraphLab Workshop

Filed under: Conferences,GraphLab,Graphs — Patrick Durusau @ 1:28 pm

Last chance registration to the 2nd GraphLab Workshop by Danny Bickson.

From the post:

We are having a great demand for this year’s 2nd GraphLab workshop (Monday July 1st in SF): already 378 383 467 registrations and growing quickly. Please register ASAP here: http://glw2.eventbrite.com before we are sold out!

You will see weapons grade graph work at the workshop.

Don’t let spy agencies take the last few seats!

Register today!

Fun with Facebook in Neo4j [Separation from Edward Snowden?]

Filed under: Facebook,Graphs,Neo4j — Patrick Durusau @ 1:13 pm

Fun with Facebook in Neo4j by Rik Van Bruggen.

From the post:

Ever since Facebook promoted its “graph search” methodology, lots of people in our industry have been waking up to the fact that graphs are über-cool. Thanks to the powerful query possibilities, people like Facebook, Twitter, LinkedIn, and let us not forget, Google have been providing us with some of the most amazing technologies. Specifically, the power of the “social network” is tempting many people to get their feet wet, and to start using graph technology. And they should: graphs are fantastic at storing, querying and exploiting social structures, stored in a graph database.

So how would that really work? I am a curious, “want to know” but “not very technical” kind of guy, and I decided to get my hands dirty (again), and try some of this out by storing my own little part of Facebook – in neo4j. Without programming any kind of production-ready system – because I don’t know how – but with enough real world data to make us see what it would be like.

Rik walks you through obtaining data from Facebook, munging it in a spreadsheet and loading it into Neo4j.

Can’t wait for Facebook graph to support degrees of separation from named individuals, like Edward Snowden.

Complete with the intervening people of course.

What’s privacy compared to a media-driven witch hunt for anyone “connected” to the latest “face” on the TV?

If Facebook does that for Snowden, they should do it for NSA chief, Keith Alexander as well.

Nanocubes: Fast Visualization of Large Spatiotemporal Datasets

Filed under: Graphics,Visualization — Patrick Durusau @ 12:35 pm

Nanocubes: Fast Visualization of Large Spatiotemporal Datasets

From the webpage:

Nanocubes are a fast datastructure for in-memory data cubes developed at the Information Visualization department at AT&T Labs – Research. Nanocubes can be used to explore datasets with billions of elements at interactive rates in a web browser, and in some cases it uses sufficiently little memory that you can run a nanocube in a modern-day laptop.

Live Demos

You will need a web browser that supports WebGL. We have tested it on Chrome and Firefox, but ourselves use Chrome for development.

People

Nanocubes were developed by Lauro Lins, Jim Klosowski and Carlos Scheidegger.

Paper

The research paper describing nanocubes has been conditionally accepted to VIS 2013. The manuscript is available for download.

Software

Currently, all nanocubes above are running on a single machine with 16GB of ram.

The main software component is an HTTP server written in C++ 11 that answers queries about the dataset it processed. We plan to release nanocubes as open-source software before the publication of the paper at IEEE VIS 2013. Stay tuned!

Important Data: VIS 2013 is 13 – 18 of October, 2013. Another 112 days according to the conference webpage. 😉

Run one or more of the demos.

Then start reading the paper.

Can subject sameness values be treated to the same aggregation within an error of margin technique? (Assuming you have subject sameness values that are not subject to Boolean tests.)

I first saw this in Nat Torkington’s Four short links: 20 June 2013.

A new Lucene suggester based on infix matches

Filed under: Lucene,Search Engines — Patrick Durusau @ 8:39 am

A new Lucene suggester based on infix matches by Michael McCandless.

From the post:

Suggest, sometimes called auto-suggest, type-ahead search or auto-complete, is now an essential search feature ever since Google added it almost 5 years ago.

Lucene has a number of implementations; I previously described AnalyzingSuggester. Since then, FuzzySuggester was also added, which extends AnalyzingSuggester by also accepting mis-spelled inputs.

Here I describe our newest suggester: AnalyzingInfixSuggester, now going through iterations on the LUCENE-4845 Jira issue.

Unlike the existing suggesters, which generally find suggestions whose whole prefix matches the current user input, this suggester will find matches of tokens anywhere in the user input and in the suggestion; this is why it has Infix in its name.

You can see it in action at the example Jira search application that I built to showcase various Lucene features.

Lucene is a flagship open source project. It just keeps pushing the boundaries of its area of interest.

June 22, 2013

insight3d

Filed under: Graphics,Visualization — Patrick Durusau @ 6:29 pm

insight3d (Tutorial, pdf)

Website: http://insight3d.sourceforge.net

From the tutorial:

insight3d lets you create 3D models from photographs. You give it a series of photos of a real scene (e.g., of a building), it automatically matches them and then calculates positions in space from which each photo has been taken (plus camera’s optical parameters) along with a 3D pointcloud of the scene. You can then use insight3d ‘s modeling tools to create textured polygonal model.

I thought folks still traveling to conferences would find this interesting.

No more flat shots but 3D ones!

Enjoy!

The Quipper Language [Quantum Computing]

Filed under: Computation,Computer Science,Functional Programming,Programming,Quantum — Patrick Durusau @ 5:26 pm

The Quipper Language

From the webpage:

Quipper is an embedded, scalable functional programming language for quantum computing. It provides, among other things:

  • A high-level circuit description language. This includes gate-by-gate descriptions of circuit fragments, as well as powerful operators for assembling and manipulating circuits.
  • A monadic semantics, allowing for a mixture of procedural and declarative programming styles.
  • Built-in facilities for automatic synthesis of reversible quantum circuits, including from classical code.
  • Support for hierarchical circuits.
  • Extensible quantum data types.
  • Programmable circuit transformers.
  • Support for three execution phases: compile time, circuit generation time, and circuit execution time. A dynamic lifting operation to allow circuit generation to be parametric on values generated at circuit execution time.
  • Extensive libraries of quantum functions, including: libraries for quantum integer and fixed-point arithmetic; the Quantum Fourier transform; an efficient Qram implementation; libraries for simulation of pseudo-classical circuits, Stabilizer circuits, and arbitrary circuits; libraries for exact and approximate decomposition of circuits into specific gate sets.

The website has a Quipper tutorial, online documentation and a detailed look at the language itself.

No link for a quantum computer but that isn’t very far off.

Learn Quipper now and perhaps you can lead the first Apache project to develop open source software for a quantum computer.

I first saw this in a tweet by Jose A. Alonso.

Lucene/Solr Revolution EU 2013

Filed under: Conferences,Lucene,LucidWorks,Solr — Patrick Durusau @ 4:49 pm

Lucene/Solr Revolution EU 2013

November 4 -7, 2013
Dublin, Ireland

Abstract Deadline: August 2, 2013.

From the webpage:

LucidWorks is proud to present Lucene/Solr Revolution EU 2013, the biggest open source conference dedicated to Apache Lucene/Solr.

The conference, held in Dublin, Ireland on November 4-7, will be packed with technical sessions, developer content, user case studies, and panels. Come meet and network with the thought leaders building and deploying Lucene/Solr open source search technology.

From the call for papers:

The Call for Papers for Lucene/Solr Revolution EU 2013 is now open.

Lucene/Solr Revolution is the biggest open source conference dedicated to Apache Lucene/Solr. The great content delivered by speakers like you is the heart of the conference. If you are a practitioner, business leader, architect, data scientist or developer and have something important to share, we welcome your submission.

We are particularly interested in compelling use cases and success stories, best practices, and technology insights.

Don’t be shy!

Tips for Tuning Solr Search: No Coding Required [June 25, 2013]

Filed under: Search Engines,Searching,Solr — Patrick Durusau @ 4:40 pm

Tips for Tuning Solr Search: No Coding Required

Date & time: Tuesday, June 25, 2013 01:00 PM EDT
Duration: 60 min
Speakers: Nick Veenhof, Senior Search Engineer, Acquia

Description:

Helping online visitors easily find what they’re looking for is key to a website’s success. In this webinar, you’ll learn how to improve search in ways that don’t require any coding or code changes. We’ll show you easy modifications to tune up the relevancy to more advanced topics, such as altering the display or configuring advanced facets.

Acquia’s Senior Search Engineer, Nick Veenhof , will guide you step by step through improving the search functionality of a website, using an in-house version of an actual conference site.

Some of the search topics we’ll demonstrate include:

  • Clean faceted URL’s
  • Adding sliders, checkboxes, sorting and more to your facets
  • Complete customization of your search displays using Display Suite
  • Tuning relevancy by using Solr optimization

This webinar will make use of the Facet API module suite in combination with the Apache Solr Search Integration module suite. We’ll also use some generic modules to improve the search results that are independent of the search technology that is used. All of the examples shown are fully supported by Acquia Search.

I haven’t seen a webinar from Acquia so going to take a chance and attend.

Some webinars are pure gold, others, well, extended infommercials at best.

Will be reporting back on the experience!


First complaint: Why the long registration form for the webinar? Phone number? What? Is your marketing department going to pester me into buying your product or service?

If you want to offer a webinar, name and email should be enough. You need to know how many attendees to allow for but more than that is a waste of your time and mine.

13 Things People Hate about Your Open Source Docs [+ One More]

Filed under: Documentation,Open Source — Patrick Durusau @ 4:28 pm

13 Things People Hate about Your Open Source Docs by Andy Lester.

From the post:

Most open source developers like to think about the quality of the software they build, but the quality of the documentation is often forgotten. Nobody talks about how great a project’s docs are, and yet documentation has a direct impact on your project’s success. Without good documentation, people either do not use your project, or they do not enjoy using it. Happy users are the ones who spread the news about your project – which they do only after they understand how it works, which they learn from the software’s documentation.

Yet, too many open source projects have disappointing documentation. And it can be disappointing in several ways.

The examples I give below are hardly authoritative, and I don’t mean to pick on any particular project. They’re only those that I’ve used recently, and not meant to be exemplars of awfulness. Every project has committed at least a few of these sins. See how many your favorite software is guilty of (whether you are user or developer), and how many you personally can help fix.

Andy’s list:

  1. Lacking a good README or introduction
  2. Docs not available online
  3. Docs only available online
  4. Docs not installed with the package
  5. Lack of screenshots
  6. Lack of realistic examples
  7. Inadequate links and references
  8. Forgetting the new user
  9. Not listening to the users
  10. Not accepting user input
  11. No way to see what the software does without installing it
  12. Relying on technology to do your writing
  13. Arrogance and hostility toward the user

See Andy’s post for the details on his points and the comments that follow.

I do think Andy missed one point:

14. Commercial entity open sources a product, machine generates documentation, expects users to contribute patches to the documentation for free.

What seems odd about that to you?

Developers getting paid to develop poor documentation and their response to user comments on documentation is the “community” should fix it for free.

At least in a true open source project, everyone is contributing and can use the (hopefully) great results equally.

Not so with a, “well…., for that you would need commercial license X” type project.

I first saw this in a tweet by Alexandre.

The New Search App in Hue 2.4

Filed under: Hadoop,Hue,Interface Research/Design,Solr,UX — Patrick Durusau @ 3:59 pm

The New Search App in Hue 2.4

From the post:

In version 2.4 of Hue, the open source Web UI that makes Apache Hadoop easier to use, a new app was added in addition to more than 150 fixes: Search!

Using this app, which is based on Apache Solr, you can now search across Hadoop data just like you would do keyword searches with Google or Yahoo! In addition, a wizard lets you tweak the result snippets and tailors the search experience to your needs.

The new Hue Search app uses the regular Solr API underneath the hood, yet adds a remarkable list of UI features that makes using search over data stored in Hadoop a breeze. It integrates with the other Hue apps like File Browser for looking at the index file in a few clicks.

Here’s a video demoing queries and results customization. The demo is based on Twitter Streaming data collected with Apache Flume and indexed in real time:

Even allowing for the familiarity of the presenter with the app, this is impressive!

More features are reported to be on the way!

Definitely sets a higher bar for search UIs.

Machine Learning Cheat Sheet [Suggestions for a better one]

Filed under: Algorithms,Machine Learning — Patrick Durusau @ 3:39 pm

Machine Learning Cheat Sheet (pdf)

If you need to memorize machine learning formulas for an exam, this might be the very thing.

On the other hand, if you are sitting at your console, you are likely to have online or hard copy references with this formula and more detailed information.

A generally helpful machine learning cheatsheet would some common cases where each algorithm has been successful. Perhaps even some edge cases you are unlikely to think about.

The algorithms are rarely in question. Proper application, well, that’s an entirely different story.

I first saw this in a tweet by Siah.

Dlib C++ Library [New Release]

Filed under: Machine Learning — Patrick Durusau @ 3:26 pm

Dlib C++ Library

From the webpage:

A major design goal of this portion of the library is to provide a highly modular and simple architecture for dealing with kernel algorithms. Towards this end, dlib takes a generic programming approach using C++ templates. In particular, each algorithm is parameterized to allow a user to supply either one of the predefined dlib kernels (e.g. RBF operating on column vectors), or a new user defined kernel. Moreover, the implementations of the algorithms are totally separated from the data on which they operate. This makes the dlib implementation generic enough to operate on any kind of data, be it column vectors, images, or some other form of structured data. All that is necessary is an appropriate kernel.

New features in 18.3:

  • Machine Learning:
    • Added the svr_linear_trainer, a tool for solving large scale support vector
      regression problems.
    • Added a tool for working with BIO and BILOU style sequence taggers/segmenters. This is the new sequence_segmenter object and its associated structural_sequence_segmentation_trainer object.
    • Added a python interface to some of the machine learning tools. These include the svm_c_trainer, svm_c_linear_trainer, svm_rank_trainer, and structural_sequence_segmentation_trainer objects as well as the cca() routine.
  • Added point_transform_projective and find_projective_transform().
  • Added a function for numerically integrating arbitrary functions, this is the new integrate_function_adapt_simpson() routine which was contributed by Steve Taylor
  • Added jet(), a routine for coloring images with the jet color scheme.

This looks interesting. Lots of good references, etc.

I first saw this in a tweet by Mxlearn.

AWS: Your Next Utility Bill?

Filed under: Amazon Web Services AWS,Hadoop,MapReduce — Patrick Durusau @ 3:08 pm

Netflix open sources its Hadoop manager for AWS be Derrick Harris.

From the post:

Netflix runs a lot of Hadoop jobs on the Amazon Web Services cloud computing platform, and on Friday the video-streaming leader open sourced its software to make running those jobs as easy as possible. Called Genie, it’s a RESTful API that makes it easy for developers to launch new MapReduce, Hive and Pig jobs and to monitor longer-running jobs on transient cloud resources.

In the blog post detailing Genie, Netflix’s Sriram Krishnan makes clear a lot more about what Genie is and is not. Essentially, Genie is a platform as a service running on top of Amazon’s Elastic MapReduce Hadoop service. It’s part of a larger suite of tools that handles everything from diagnostics to service registration.

It is not a cluster manager or workflow scheduler for building ETL processes (e.g., processing unstructured data from a web source, adding structure and loading into a relational database system). Netflix uses a product called UC4 for the latter, but it built the other components of the Genie system.

It’s not very futuristic to say that AWS (or something very close to it) will be your next utility bill.

Like paying for water, gas, cable, electricity, it will be an auto-pay setup on your bank account.

What will you say when clients ask if the service you are building for them is hosted on AWS?

Are you going to say your servers are more reliable? That you don’t “trust” Amazon?

Both of which may be true but how will you make that case?

Without sounding like you are selling something the client doesn’t need?

As the price of cloud computing drops, those questions are going to become common.

June 21, 2013

TokuMX: High Performance for MongoDB

Filed under: Fractal Trees,Indexing,MongoDB,Tokutek — Patrick Durusau @ 6:20 pm

TokuMX: High Performance for MongoDB

From the webpage:

TokuMXTM for MongoDB is here!

Tokutek, whose Fractal Tree® indexing technology has brought dramatic performance and scalability to MySQL and MariaDB users, now brings those same benefits to MongoDB users.

TokuMX is open source performance-enhancing software for MongoDB that make MongoDB more performant in large application with demanding requirements. In addition to replacing B-tree indexing with more modern technology, TokuMX adds transaction support, document-level locking for concurrent writes, and replication.

You have seen the performance specs on Fractal Tree indexing.

Now they are available for MongoDB!

Graphillion

Filed under: Graphillion,Graphs,Networks,Python — Patrick Durusau @ 6:07 pm

Graphillion

From the webpage:

Graphillion is a Python library for efficient graphset operations. Unlike existing graph tools such as NetworkX, which are designed to manipulate just a single graph at a time, Graphillion handles a large set of graphs very efficiently. Surprisingly, trillions of trillions of graphs can be processed on a single computer with Graphillion.

You may be curious about an uncommon concept of graphset, but it comes along with any graph or network when you consider multiple subgraphs cut from the graph; e.g., considering possible driving routes on a road map, examining feasible electric flows on a power grid, or evaluating the structure of chemical reaction networks. The number of such subgraphs can be trillions even in a graph with just a few hundreds of edges, since subgraphs increase exponentially with the graph size. It takes millions of years to examine all subgraphs with a naive approach as demonstrated in the funny movie above; Graphillion is our answer to resolve this issue.

Graphillion allows you to exhaustively but efficiently search a graphset with complex, even nonconvex, constraints. In addition, you can find top-k optimal graphs from the complex graphset, and can also extract common properties among all graphs in the set. Thanks to these features, Graphillion has a variety of applications including graph database, combinatorial optimization, and a graph structure analysis. We will show some practical use cases in the following tutorial, including evaluation of power distribution networks.

Just skimming the tutorial, this looks way cool!

Be sure to check out the references:

  • Takeru Inoue, Hiroaki Iwashita, Jun Kawahara, and Shin-ichi Minato: “Graphillion: Software Library Designed for Very Large Sets of Graphs in Python,” Hokkaido University, Division of Computer Science, TCS Technical Reports, TCS-TR-A-13-65, June 2013.
    (pdf)
  • Takeru Inoue, Keiji Takano, Takayuki Watanabe, Jun Kawahara, Ryo Yoshinaka, Akihiro Kishimoto, Koji Tsuda, Shin-ichi Minato, and Yasuhiro Hayashi, “Loss Minimization of Power Distribution Networks with Guaranteed Error Bound,” Hokkaido University, Division of Computer Science, TCS Technical Reports, TCS-TR-A-12-59, 2012. (pdf)
  • Ryo Yoshinaka, Toshiki Saitoh, Jun Kawahara, Koji Tsuruma, Hiroaki Iwashita, and Shin-ichi Minato, “Finding All Solutions and Instances of Numberlink and Slitherlink by ZDDs,” Algorithms 2012, 5(2), pp.176-213, 2012. (doi)
  • DNET – Distribution Network Evaluation Tool

I first saw this in a tweet by David Gutelius.

Configure Solr on Ubuntu, the quickest way

Filed under: Indexing,Solr,Topic Maps — Patrick Durusau @ 5:51 pm

Configure Solr on Ubuntu, the quickest way

From the webpage:

Note: I used the wiki page Ubuntu-10.04-lts-server as basis of this tutorial.
More infos on the general installation at :http://wiki.apache.org/solr/SolrTomcat

One of the most efficient way to deploy a Solr server is to encapsulate it in a Java servlet, the Apache Foundation (the provider of Solr) brought to us Tomcat, a powerfull http server written in Java.

I thought you might find this useful.

With the various advances in indexing, I am beginning to wonder in what way does a topic map “backend,” differ from an index?

And if it doesn’t (or by much), what can indexing structures teach us about faster topic maps?

The LION Way

Filed under: Interface Research/Design,Machine Learning — Patrick Durusau @ 5:43 pm

The LION Way: Machine Learning plus Intelligent Optimization by Roberto Battiti and Mauro Brunato.

From the introduction:

Learning and Intelligent Optimization (LION) is the combination of learning from data and optimization applied to solve complex and dynamic problems. The LION way is about increasing the automation level and connecting data directly to decisions and actions. More power is directly in the hands of decision makers in a self-service manner, without resorting to intermediate layers of data scientists. LION is a complex array of mechanisms, like the engine in an automobile, but the user (driver) does not need to know the inner-workings of the engine in order to realize tremendous benefits. LION’s adoption will create a prairie fire of innovation which will reach most businesses in the next decades. Businesses, like plants in wildfire-prone ecosystems, will survive and prosper by adapting and embracing LION techniques, or they risk being transformed from giant trees to ashes by the spreading competition.

The questions to be asked in the LION paradigm are not about mathematical goodness models but about abundant data, expert judgment of concrete options (examples of success cases), interactive definition of success criteria, at a level which makes a human person at ease with his mental models. For example, in marketing, relevant data can describe the money allocation and success of previous campaigns, in engineering they can describe experiments about motor designs (real or simulated) and corresponding fuel consumption.

OK, the “…prairie fire of innovation…” stuff is a bit over the top but it’s promoting a paradigm.

And I’m not unsympathetic to making tools easier for users to use.

Although, I must confess that people who choose a “self-service” model for complex information processing are likely to get the results they deserve (but don’t want).

Like most people I can “type” after a fashion. I don’t look at the keyboard and do use all ten fingers. But, compared to a professional typist of my youth, I am not even an entry level typist. A professional typist could produce far more error free content in a couple of hours than I can all day.

Odd how “self-service” works out to putting more of a burden on the user for a poorer result.

The book is free and worth a read.

I first saw this at KDNuggets.

::MG4J: Managing Gigabytes for Java™

Filed under: Indexing,MG4J,Search Engines — Patrick Durusau @ 4:43 pm

::MG4J: Managing Gigabytes for Java™

From the webpage:

Release 5.0 has several source and binary incompatibilities, and introduces quasi-succinct indices[broken link]. Benchmarks on the performance of quasi-succinct indices can be found here; for instance, this table shows the number of seconds to answer 1000 multi-term queries on a document collection of 130 million web pages:


MG4J MG4J* Lucene 3.6.2
Terms 70.9 132.1 130.6
And 27.5 36.7 108.8
Phrase 78.2 127.2
Proximity 106.5 347.6

Both engines were set to just enumerate the results without scoring. The column labelled MG4J* gives the timings of an artificially modified version in which counts for each retrieved document have been read (MG4J now stores document pointers and counts in separate files, but Lucene interleaves them, so it has to read counts compulsorily). Proximity queries are conjunctive queries that must be satisfied within a window of 16 words. The row labelled “Terms” gives the timings for enumerating the posting lists of all terms appearing in the queries.

I tried the link for “quasi-succinct indices” and it consistently returns a 404.

In lieu of that reference, see: Quasi-Succinct Indices by Sebastiano Vigna.

Abstract:

Compressed inverted indices in use today are based on the idea of gap compression: documents pointers are stored in increasing order, and the gaps between successive document pointers are stored using suitable codes which represent smaller gaps using less bits. Additional data such as counts and positions is stored using similar techniques. A large body of research has been built in the last 30 years around gap compression, including theoretical modeling of the gap distribution, specialized instantaneous codes suitable for gap encoding, and ad hoc document reorderings which increase the efficiency of instantaneous codes. This paper proposes to represent an index using a different architecture based on quasi-succinct representation of monotone sequences. We show that, besides being theoretically elegant and simple, the new index provides expected constant-time operations and, in practice, significant performance improvements on conjunctive, phrasal and proximity queries.

Heavy sledding but with search results as shown from the benchmark, well worth the time to master.

« Newer PostsOlder Posts »

Powered by WordPress