Another Word For It Patrick Durusau on Topic Maps and Semantic Diversity

February 9, 2015

Newly Discovered Networks among Different Diseases…

Filed under: Bioinformatics,Medical Informatics,Networks — Patrick Durusau @ 4:32 pm

Newly Discovered Networks among Different Diseases Reveal Hidden Connections by Veronique Greenwood and Quanta Magazine.

From the post:

Stefan Thurner is a physicist, not a biologist. But not long ago, the Austrian national health insurance clearinghouse asked Thurner and his colleagues at the Medical University of Vienna to examine some data for them. The data, it turned out, were the anonymized medical claims records—every diagnosis made, every treatment given—of most of the nation, which numbers some 8 million people. The question was whether the same standard of care could continue if, as had recently happened in Greece, a third of the funding evaporated. But Thurner thought there were other, deeper questions that the data could answer as well.

In a recent paper in the New Journal of Physics, Thurner and his colleagues Peter Klimek and Anna Chmiel started by looking at the prevalence of 1,055 diseases in the overall population. They ran statistical analyses to uncover the risk of having two diseases together, identifying pairs of diseases for which the percentage of people who had both was higher than would be expected if the diseases were uncorrelated—in other words, a patient who had one disease was more likely than the average person to have the other. They applied statistical corrections to reduce the risk of drawing false connections between very rare and very common diseases, as any errors in diagnosis will get magnified in such an analysis. Finally, the team displayed their results as a network in which the diseases are nodes that connect to one another when they tend to occur together.

The style of analysis has uncovered some unexpected links. In another paper, published on the scientific preprint site arxiv.org, Thurner’s team confirmed a controversial connection between diabetes and Parkinson’s disease, as well as unique patterns in the timing of when diabetics develop high blood pressure. The paper in the New Journal of Physics generated additional connections that they hope to investigate further.

Every medical claim for almost eight (8) million people would make a very dense graph. Yes?

When you look at the original papers, notice that the researchers did not create a graph that held all their data. In the New Journal of Physics paper, only the diseases appear to demonstrate their clustering and the patients not at all. In the archiv.org paper, another means is used to demonstrate the risk of specific diseases and the two types (DM1, DM2) of diabetes.

I think the lesson here is that despite being “network” data, that isn’t determinative for presentation or analysis of data.
The National Centre for Biotechnology Information (NCBI) is part…

Filed under: Bioinformatics,DOI,R — Patrick Durusau @ 4:05 pm

The National Centre for Biotechnology Information (NCBI) is part…

The National Centre for Biotechnology Information (NCBI) is part of the National Institutes of Health’s National Library of Medicine, and most well-known for hosting Pubmed, the go-to search engine for biomedical literature – every (Medline-indexed) publication goes up there.

On a separate but related note, one thing I’m constantly looking to do is get DOIs for papers on demand. Most recently I found a package for R, knitcitations that generates bibliographies automatically from DOIs in the text, which worked quite well for a 10 page literature review chock full of references (I’m a little allergic to Mendeley and other clunky reference managers).

The “Digital Object Identifier”, as the name suggests, uniquely identifies a research paper (and recently it’s being co-opted to reference associated datasets). There’re lots of interesting and troublesome exceptions which I’ve mentioned previously, but in the vast majority of cases any paper published in at least the last 10 years or so will have one.

Although NCBI Pubmed does a great job of cataloguing biomedical literature, another site, doi.org provides a consistent gateway to the original source of the paper. You only need to append the DOI to “dx.doi.org/” to generate a working redirection link.

Last week the NCBI posted a webinar detailing the inner workings of Entrez Direct, the command line interface for Unix computers (GNU/Linux, and Macs; Windows users can fake it with Cygwin). It revolves around a custom XML parser written in Perl (typical for bioinformaticians) encoding subtle ‘switches’ to tailor the output just as you would from the web service (albeit with a fair portion more of the inner workings on show).

I’ve pieced together a basic pipeline, which has a function to generate citations for knitcitations from files listing basic bibliographic information, and in the final piece of the puzzle now have a custom function (or several) that does its best to find a single unique article matching the author, publication year, and title of a paper systematically, to find DOIs for entries in such a table.

BTW, the correct Github Gist link is: https://gist.github.com/lmmx/3c9406c4ec2c42b82158

The link in:

The scripts below are available here, I’ll update them on the GitHub Gist if I make amendments.

is broken.

A clever utility, although I am more in need of one for published CS literature. 😉

The copy to clipboard feature would be perfect for pasting into blogs posts.

NodeXL Eye Candy

Filed under: Graphs,Visualization — Patrick Durusau @ 3:30 pm

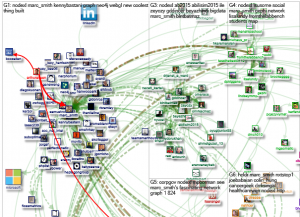
node-xl-1

This only part of a graph visualization that you will find at: http://nodexlgraphgallery.org/Pages/Graph.aspx?graphID=39261. The visualization was produced by Marc Smith.

I first saw this mentioned in a tweet by Kenny Bastani.

With only two hundred and fifty-six nodes and five hundred and fifty-two unique edges, you can start to see some of the problems with graph visualization.

Can you visually determine the top ten (10) nodes in this display?

The more complex the graph, the harder it will be in some cases to visually evaluate the graph. Citation graphs for example, will exhibit recognizable clusters even if the graph is very “busy.” On the other hand, if you are seeking links between individuals, some connections are likely to be lost in the noise.

Without losing each node’s integrity as individual nodes, do you know of techniques to treat nodes as components of a larger node so that the larger nodes behavior in the visualization is determined by the “sub-“nodes it contains? Thinking of it as a way to “summarize” the data of the individual nodes and keep them in play for a visualization.

When interesting behavior is exhibited, the virtual node could be expanded and the relationships refined based on the nodes within.

LambdaCms (Haskell based cms)

Filed under: CMS,Functional Programming,Hashtags — Patrick Durusau @ 10:23 am

LambdaCms (Haskell based cms)

Documentation

LambdaCms is an open source CMS in Haskell, buildon top of the Yesod web-application framework. All of Yesod’s features are available to LambdaCms sites. The main features of LambdaCms include:

  • Performant: we measured 2-10ms response times for dynamic content (HTML), w/o caching.
  • Responsive admin interface: works well on tablets and phones.
  • Modular: LambdaCms extensions using Yesod’s subsite mechanism, extensions use Cabal’s dependency specifications to depend on eachother.
  • Support for SQL databases that Yesod’s persistent supports (Postgres, MySQL, Sqlite).
  • Out-of-the-box support for authentication strategies that yesod-auth provides (BrowserID, Google, Email), and extendible with yesod-auth plugins (such as the ones for Facebook and OAuth2).
  • User management.
  • User roles.
  • Fully programmable route-based permissions.
  • Admin activity log that extensions can plug into.
  • Allows internationalization of the admin interface.
  • UI strings of the admin interface allow overrides.
  • Basic media management capabilities (from the lambdacms-media extension).

Version specific API documentation can be found on Hackage:

Besides the README’s in the various repositories, and the documentation on Hackage, we maintain some tutorials —providing guidance through several common tasks— which can be found in the section below.

From reading the documentation, LambdaCms isn’t a full featured cms, yet, but if you are interested in Haskell, this may prove to be the perfect CMS for you!

I first saw this in a tweet by Dora Marquez

Scala DataTable

Filed under: Immutable,Scala,Tables — Patrick Durusau @ 10:03 am

Scala DataTable by Martin Cooper.

From the webpage:

Overview

Scala DataTable is a lightweight, in-memory table structure written in Scala. The implementation is entirely immutable. Modifying any part of the table, adding or removing columns, rows, or individual field values will create and return a new structure, leaving the old one completely untouched. This is quite efficient due to structural sharing.

Features :

  • Fully immutable implementation.
  • All changes use structural sharing for performance.
  • Table columns can be added, inserted, updated and removed.
  • Rows can be added, inserted, updated and removed.
  • Individual cell values can be updated.
  • Any inserts, updates or deletes keep the original structure and data completely unchanged.
  • Internal type checks and bounds checks to ensure data integrity.
  • RowData object allowing typed or untyped data access.
  • Full filtering and searching on row data.
  • Single and multi column quick sorting.
  • DataViews to store sets of filtered / sorted data.

If you are curious about immutable data structures and want to start with something familiar, this is your day!

See the Github page for example code and other details.

Twitter can solve harassment right now…

Filed under: Governance,Twitter — Patrick Durusau @ 9:51 am

Twitter can solve harassment right now with verified accounts by Jason Calacanis.

Jason’s proposal to stop harassment on Twitter is simplicity itself. Twitter would add a forth privacy option that limits the tweets you see to users who have been “verified.” Where “verified” means they have a “real world” address and identity. Easier to hold them responsible for harassment. Twitter’s incentive is a nominal annual fee for the verification option.

Jason extols the many benefits of his proposal so see the original post.

Jason doesn’t mention demand for the verified option. If offered to all Twitter users at once, demand would outstrip their ability to respond. Better to offer “verification” to blocks of users and maintain a high quality experience.

Let’s get Twitter’s attention on Jason’s post. Let’s make it a trending topic on Twitter!

February 8, 2015

The Parable of Google Flu… [big data hubris]

Filed under: Algorithms,BigData — Patrick Durusau @ 7:13 pm

The Parable of Google Flu: Traps in Big Data Analysis by David Lazer, Ryan Kennedy, Gary King, Alessandro Vespignani.

From the article:

In February 2013, Google Flu Trends (GFT) made headlines but not for a reason that Google executives or the creators of the flu tracking system would have hoped. Nature reported that GFT was predicting more than double the proportion of doctor visits for influenza-like illness (ILI) than the Centers for Disease Control and Prevention (CDC), which bases its estimates on surveillance reports from laboratories across the United States (1,2). This happened despite the fact that GFT was built to predict CDC reports. Given that GFT is often held up as an exemplary use of big data (3, 4), what lessons can we drawfrom this error?

The problems we identify are not limited to GFT. Research on whether search or social media can predict x has become commonplace (5-7) and is often put in sharp contrast with traditional methods and hypotheses. Although these studies have shown the value of these data, we are far from a place where they can supplant more traditional methods or theories (8). We explore two issues that contributed to GFT’s mistakes— big data hubris and algorithm dynamics— and offer lessons for moving forward in the big data age.

Highly recommended reading for big data advocates.

Not that I doubt the usefulness of big data, but I do doubt its usefulness in the absence of an analyst who understands the data.

Did you catch the aside about documentation?

There are multiple challenges to replicating GFT’s original algorithm. GFT has never documented the 45 search terms used, and the examples that have been released appear misleading (14) (SM). Google does provide a service, Google Correlate, which allows the user to identify search data that correlate with a given time series; however, it is limited to national level data, whereas GFT was developed using correlations at the regional level (13). The service also fails to return any of the sample search terms reported in GFT-related publications (13,14).

Document your analysis and understanding of data. Or you can appear in a sequel to Google Flu. Not really where I want my name to appear. You?

I first saw this in a tweet by Edward Tufte.

National Security Strategy – February 2015

Filed under: Government,NSA,Security — Patrick Durusau @ 6:53 pm

National Security Strategy – February 2015 by Barack Obama.

If you are not already following the U.S. Dept. of Fear (FearDept) on Twitter, you should be.

FearDept tweets that “terrorism” is mentioned fifty-three (53) times in thirty-five (35) pages.

Despite bold claims about our educational system, it is mentioned only sixteen (16) times. And the president doesn’t mention that LSU is facing a one-third (1/3) cut to its budget, damaging higher education in Louisiana in ways that won’t be easy to repair. Cutting Louisiana higher education by $300 million, putting it into perspective Louisiana isn’t the only state raising tuition and cutting state support for higher education, but it is one of the worst offenders.

If you want to know exactly how grim the situation is for education, see: States Are Still Funding Higher Education Below Pre-Recession Levels, which details how all fifty (50) states, save for Alaska and North Dakota, have cut funding for education. The report explores a variety of measures to illustrate the impact that funding cuts and tuition increases have had on education.

Unlike the extolling of the U.S. education system rhetoric in President Obama’s text, the report concludes:

States have cut higher education funding deeply since the start of the recession. These cuts were in part the result of a revenue collapse caused by the economic downturn, but they also resulted from misguided policy choices. State policymakers relied overwhelmingly on spending cuts to make up for lost revenues. They could have lessened the need for higher education funding cuts if they had used a more balanced mix of spending cuts and revenue increases to balance their budgets.

To compensate for lost state funding, public colleges have both steeply increased tuition and pared back spending, often in ways that may compromise the quality of the education and jeopardize student outcomes. Now is the time to renew investment in higher education to promote college affordability and quality.

Strengthening state investment in higher education will require state policymakers to make the right tax and budget choices over the coming years. A slow economic recovery and the need to reinvest in other services that also have been cut deeply means that many states will need to raise revenue to rebuild their higher education systems. At the very least, states must avoid shortsighted tax cuts, which would make it much harder for them to invest in higher education, strengthen the skills of their workforce, and compete for the jobs of the future.

The conclusions on education funding were based on facts. President Obama’s text is based on fantasies that support the military-industrial complex and their concubines.

Can you name a foreign terrorist attack on the United States other than 9/11? That’s what I thought. Unique events are not a good basis for policy making or funding.

TOGAF® 9.1 Translation Glossary: English – Norwegian

Filed under: Design,Enterprise Integration,IT — Patrick Durusau @ 5:03 pm

TOGAF® 9.1 Translation Glossary: English – Norwegian (PDF)

From the Wikipedia entry The Open Group Architecture Framework

The Open Group Architecture Framework (TOGAF) is a framework for enterprise architecture which provides an approach for designing, planning, implementing, and governing an enterprise information technology architecture.[2] TOGAF has been a registered trademark of The Open Group in the United States and other countries since 2011.[3]

TOGAF is a high level approach to design. It is typically modeled at four levels: Business, Application, Data, and Technology. It relies heavily on modularization, standardization, and already existing, proven technologies and products.

I saw a notice of this publication today and created a local copy for your convenience (the offical copy requires free registration and login). The downside is that over time, this copy will not be the latest version. The latest version can be downloaded from: www.opengroup.org/bookstore.

You can purchase TOGAF 9.1 here: http://www.opengroup.org/togaf/. I haven’t read it but at $39.95 for the PDF version, it compares favorably to other standards pricing.

February 7, 2015

Encouraging open data usage…

Filed under: Government Data,Open Data — Patrick Durusau @ 7:04 pm

Encouraging open data usage by commercial developers: Report

From the post:

The second Share-PSI workshop was very different from the first. Apart from presentations in two short plenary sessions, the majority of the two days was spent in facilitated discussions around specific topics. This followed the success of the bar camp sessions at the first workshop, that is, sessions proposed and organised in an ad hoc fashion, enabling people to discuss whatever subject interests them.

Each session facilitator was asked to focus on three key questions:

  1. What X is the thing that should be done to publish or reuse PSI?
  2. Why does X facilitate the publication or reuse of PSI?
  3. How can one achieve X and how can you measure or test it?

This report summarises the 7 plenary presentations, 17 planned sessions and 7 bar camp sessions. As well as the Share-PSI project itself, the workshop benefited from sessions lead by 8 other projects. The agenda for the event includes links to all papers, slides and notes, with many of those notes being available on the project wiki. In addition, the #sharepsi tweets from the event are archived, as are a number of photo albums from Makx Dekkers,
Peter Krantz and José Luis Roda. The event received a generous write up
on the host’s Web site (in Portuguese). The spirit of the event is captured in this video by Noël Van Herreweghe of CORVe.

To avoid confusion, PSI in this context means Public Sector Information, not Published Subject Identifier (PSI).

Amazing coincidence that the W3C has smudged yet another name. You may recall the W3C decided to confuse URIs and IRIs in its latest attempt to re-write history, calling both the the acronym, URI:

Within this specification, the term URI refers to a Universal Resource Identifier as defined in [RFC 3986] and extended in [RFC 2987] [RFC 3987] with the new name IRI. The term URI has been retained in preference to IRI to avoid introducing new names for concepts such as “Base URI” that are defined or referenced across the whole family of XML specifications. (Corrected the RFC listing as shown.) (XQuery and XPath Data Model 3.1 , N. Walsh, J. Snelson, Editors, W3C Candidate Recommendation (work in progress), 18 December 2014, http://www.w3.org/TR/2014/CR-xpath-datamodel-31-20141218/ . Latest version available at http://www.w3.org/TR/xpath-datamodel-31/.)

Interesting discussion but I would pay very close attention to market demand, perhaps I should say, commercial market demand, before planning a start-up based on government data. There is unlimited demand for free data or even better, free enhanced data, but that should not be confused with enhanced data that can be sold to support a start-up on an ongoing basis.

To give you an idea of the uncertainly of conditions for start-ups relying on open data, let me quote the final bullet points of this article:

  • There is a lack of knowledge of what can be done with open data which is hampering uptake.
  • There is a need for many examples of success to help show what can be done.
  • Any long term re-use of PSI must be based on a business plan.
  • Incubators/accelerators should select projects to support based on the business plan.
  • Feedback from re-users is an important component of the ecosystem and can be used to enhance metadata.
  • The boundary between what the public and private sectors can, should and should not do do needs to be better defined to allow the public sector to focus on its core task and businesses to invest with confidence.
  • It is important to build an open data infrastructure, both legal and technical, that supports the sharing of PSI as part of normal activity.
  • Licences and/or rights statements are essential and should be machine readable. This is made easier if the choice of licences is minimised.
  • The most valuable data is the data that the public sector already charges for.
  • Include domain experts who can articulate real problems in hackathons (whether they write code or not).
  • Involvement of the user community and timely response to requests is essential.
  • There are valid business models that should be judged by their effectiveness and/or social impact rather than financial gain.

Just so you know, that last point:

There are valid business models that should be judged by their effectiveness and/or social impact rather than financial gain.

that is not a business model, unless you have renewal financing from some source other than by financial gain. That is a charity model where you are the object of the charity.

100 pieces of flute music

Filed under: Design,Graphics,Music,Visualization — Patrick Durusau @ 3:28 pm

100 pieces of flute music – A quantified self project where music and design come together by Erika von Kelsch.

From the post:

flute-image1-680x490

(image: The final infographic | Erika von Kelsch)

The premise of the project was to organize 100 pieces of data into a static print piece. At least 7 metadata categories were to be included within the infographic, as well as a minimum of 3 overall data rollups. I chose 100 pieces of flute music that I have played that have been in my performance repertoire. Music was a potential career path for me, and the people and experiences I had through music influence how I view and explore the world around me to this day. The way I approach design is also influenced by what I learned from studying music, including the technical aspects of both flute and theory, as well as the emotional facets of performance. I decided to use this project as a vehicle to document this experience.

Not only is this a great visualization but the documentation of the design process is very impressive!

Have you ever attempted to document your design process during a project? That is what actually happened as opposed to what “must have happended” in the design process?

Geojournalism.org

Filed under: Geographic Data,Geography,Geospatial Data,Journalism,Mapping,Maps — Patrick Durusau @ 3:05 pm

Geojournalism.org

From the webpage:

Geojournalism.org provides online resources and training for journalists, designers and developers to dive into the world of data visualization using geographic data.

From the about page:

Geojournalism.org is made for:

Journalists

Reporters, editors and other professionals involved on the noble mission of producing relevant news for their audiences can use Geojournalism.org to produce multimedia stories or simple maps and data visualization to help creating context for complex environmental issues

Developers

Programmers and geeks using a wide variety of languages and tools can drink on the vast knowledge of our contributors. Some of our tutorials explore open source libraries to make maps, infographics or simply deal with large geographical datasets

Designers

Graphic designers and experts on data visualizations find in the Geojournalism.org platform a large amount of resources and tips. They can, for example, improve their knowledge on the right options for coloring maps or how to set up simple charts to depict issues such as deforestation and climate change

It is one thing to have an idea or even a story and quite another to communicate it effectively to a large audience. Geojournalism is designed as a community site that will help you communicate geophysical data to a non-technical audience.

I think it is clear that most governments are shy about accurate and timely communication with their citizens. Are you going to be one of those who fills in the gaps? Geojournalism.org is definitely a site you will be needing.

Pick up Python

Filed under: Communities of Practice,Programming,Python,R — Patrick Durusau @ 2:45 pm

Pick up Python by Jeffrey M. Perkel. (Nature 518, 125–126 (05 February 2015) doi:10.1038/518125a)

From the post:

Last month, Adina Howe took up a post at Iowa State University in Ames. Officially, she is an assistant professor of agricultural and biosystems engineering. But she works not in the greenhouse, but in front of a keyboard. Howe is a programmer, and a key part of her job is as a ‘data professor’ — developing curricula to teach the next generation of graduates about the mechanics and importance of scientific programming.

Howe does not have a degree in computer science, nor does she have years of formal training. She had a PhD in environmental engineering and expertise in running enzyme assays when she joined the laboratory of Titus Brown at Michigan State University in East Lansing. Brown specializes in bioinformatics and uses computation to extract meaning from genomic data sets, and Howe had to get up to speed on the computational side. Brown’s recommendation: learn Python.

Among the host of computer-programming languages that scientists might choose to pick up, Python, first released in 1991 by Dutch programmer Guido van Rossum, is an increasingly popular (and free) recommendation. It combines simple syntax, abundant online resources and a rich ecosystem of scientifically focused toolkits with a heavy emphasis on community.

The community aspect is particularly important to Python’s growing adoption. Programming languages are popular only if new people are learning them and using them in diverse contexts, says Jessica McKellar, a software-engineering manager at the file-storage service Dropbox and a director of the Python Software Foundation, the non-profit organization that promotes and advances the language. That kind of use sets up a “virtuous cycle”, McKellar says: new users extend the language into new areas, which in turn attracts still more users.

Curious what topic mappers make of the description of the community aspects of Python?

I ask because more sematically opaque Big Data comes online everyday and there have been rumblings about needing a solution. A solution that I think topic maps are well suited to provide.

BTW, R folks should not feel slighted: Adventures with R by Sylvia Tippmann. (Nature 517, 109–110 (01 January 2015) doi:10.1038/517109a)

RDF Stream Processing Workshop at ESWC2015

Filed under: Conferences,RDF — Patrick Durusau @ 2:25 pm

RDF Stream Processing Workshop at ESWC2015

May 31th, 2015 in Portoroz, Slovenia

Important dates:

Submission for EoI: Friday March 6, 2015
Notification of acceptance: Friday April 3, 2015
Workshop days: Sunday May 31, 2015

From the webpage:

Motivation

Data streams are an increasingly prevalent source of information in a wide range of domains and applications, e.g. environmental monitoring, disaster response, or smart cities. The RDF model is based on a traditional persisted-data paradigm, where the focus is on maintaining a bounded set of data items in a knowledge base. This paradigm does not fit the case of data streams, where data items flow continuously over time, forming unbounded sequences of data. In this context, the W3C RDF Stream Processing (RSP) Community Group has taken the task to explore the existing technical and theoretical proposals that incorporate streams to the RDF model, and to its query language, SPARQL. More concretely, one of the main goals of the RSP Group is to define a common, but extensible core model for RDF stream processing. This core model can serve as a starting point for RSP engines to be able to talk to each other and interoperate.

Goal

The goal of this workshop is to bring together interested members of the community to:

  • Demonstrate their latest advances in stream processing systems for RDF.
  • Foster discussion for agreeing on a core model and query language for RDF streams.
  • Involve and attract people from related research areas to actively participate in the RSP Community Group.

Each of these objectives will intensify interest and participation in the community to ultimately broaden its impact and allow for going towards a standardization process. As a result of this workshop the authors will contribute to the W3C RSP Community Group Report that will be published as part of the group activities.

As the world of technology continues to evolve and RDF does not, you have to admire the persistent of the RDF community in bolting RDF onto every new technical innovation.

I never thought the problem with RDF was with technological. No, rather the problem was: Why should I use your identifiers and relationships when I much prefer my own? Which include an implied basis I used to assign each identifier to a subject. The “implied” part being how we came to have multiple meanings for owl:sameAs. If I can’t see the “implied” part, I cannot agree or disagree with it.

February 6, 2015

Announcing the Interest Graph API [Prismatic]

Filed under: Graphs — Patrick Durusau @ 3:07 pm

Announcing the Interest Graph API by Dave Golland.

From the post:

Today we’re taking the first step in opening up our interest graph by releasing an API that automatically identifies the thematic content of a piece of text. Sign up for an API token to start tagging your text.

Our Expertise in Your Hands

At Prismatic we’ve spent a long time thinking about how to provide our users with the most relevant recommendations. To do this, we’ve engineered the interest graph — a model that helps us understand our users, their interests, publishers, content, and the connections between them. By aligning with users’ interests, the interest graph enables recommendations of products and content to deliver an experience that people care about. Today, we’re releasing the first building block of our interest graph, the connection between content and interests.

When we built the interest graph for Prismatic, we wanted to find interests that people identify with. Most existing taxonomies were either too specific (e.g., Wikipedia) or too task-focused (e.g., ads targeting), so we decided to build our own. We surveyed the popular newspaper categories that have been used to classify articles for centuries, supplemented this list with the top liked pages on Facebook, and added the most popular search queries from the Prismatic app. The result is the most comprehensive list of interests that people care about on the web today.

These interests are single-phrase summaries of the thematic content of a piece of text; examples include Functional Programming, Celebrity Gossip, or Flowers. Interests provide a short, meaningful summary of the content of an article, so you can quickly get a sense for what it’s about without spending the time reading it. By providing a short, intelligible summary, interests lend useful structure to otherwise raw, unstructured text.

We have received many requests to open our interest graph to external developers. Today, we’re happy to announce an ALPHA version of the same interest graph powering Prismatic. We are excited to see the creative and new projects that will come from getting our interest graph into the hands of developers.

As an “ALPHA” version, Prismatic needs your help to check the functioning of the API and the accuracy of tagging. Get in on the “ground” floor!

Big Data Processing with Apache Spark – Part 1: Introduction

Filed under: BigData,Spark — Patrick Durusau @ 2:45 pm

Big Data Processing with Apache Spark – Part 1: Introduction by Srini Penchikala.

From the post:

What is Spark

Apache Spark is an open source big data processing framework built around speed, ease of use, and sophisticated analytics. It was originally developed in 2009 in UC Berkeley’s AMPLab, and open sourced in 2010 as an Apache project.

Spark has several advantages compared to other big data and MapReduce technologies like Hadoop and Storm.

First of all, Spark gives us a comprehensive, unified framework to manage big data processing requirements with a variety of data sets that are diverse in nature (text data, graph data etc) as well as the source of data (batch v. real-time streaming data).

Spark enables applications in Hadoop clusters to run up to 100 times faster in memory and 10 times faster even when running on disk.

Spark lets you quickly write applications in Java, Scala, or Python. It comes with a built-in set of over 80 high-level operators. And you can use it interactively to query data within the shell.

In addition to Map and Reduce operations, it supports SQL queries, streaming data, machine learning and graph data processing. Developers can use these capabilities stand-alone or combine them to run in a single data pipeline use case.

In this first installment of Apache Spark article series, we’ll look at what Spark is, how it compares with a typical MapReduce solution and how it provides a complete suite of tools for big data processing.

If the rest of this series of posts is as comprehensive as this one, this will be a great overview of Apache Spark! Looking forward to additional posts in this series.

February 5, 2015

Intelligence agencies tout transparency [Clapper? Eh?]

Filed under: Government,NSA,Transparency — Patrick Durusau @ 6:54 pm

Intelligence agencies tout transparency by Josh Gerstein.

From:

A year and a half after Edward Snowden’s surveillance revelations changed intelligence work forever, the U.S. intelligence community is formally embracing the value of transparency. Whether America’s spies and snoopers are ready to take that idea to heart remains an open question.

On Tuesday, Director of National Intelligence James Clapper released a set of principles that amounts to a formal acknowledgement that intelligence agencies had tilted so far in the direction of secrecy that it actually undermined their work by harming public trust.

“The thought here was we needed to strategically get on the same page in terms of what we were trying to do with transparency,” DNI Civil Liberties Protection Officer Alex Joel told POLITICO Monday. “The intelligence community is by design focused on keeping secrets rather than disclosing them. We have to figure out how we can work with our very dedicated work force to be transparent while they’re keeping secrets.”

The principles (posted here) are highly general and include a call to “provide appropriate transparency to enhance public understanding about the IC’s mission and what the IC does to accomplish it (including its structure and effectiveness).” The new statement is vague on whether specific programs or capabilities should be made public. In addition, the principle on handling of classified information appears largely to restate the terms of an executive order President Barack Obama issued on the subject in 2009.

If I understand the gist of this story correctly, the Director of National Intelligence (DNI) James Clapper, the same James Clapper that lied to Congress about the NSA, wants regain the public’s trust. Really?

Hmmm, how about James Clapper and every appointed official in the security services resigning as a start. The second step would be congressional appointment of oversight personnel who can go anywhere, see any information, question anyone, throughout the security apparatus and report back to Congress. Those reports back to Congress can elide details where necessary but by rotating the oversight personnel, they won’t become captives of the agencies where they work.

BTW, the intelligence community is considering how it can release more information to avoid “program shock” from Snowden like disclosures. Not that they have released any such information but they are thinking about it. OK, I’m thinking about winning $1 million in the next lottery drawing. Doesn’t mean that it is going to happen.

Let’s get off the falsehood merry-go-round that Clapper and others want to keep spinning. Unless and until all the known liars are out of government and kept out of government, including jobs with security contractors, there is no more reason to trust our intelligence community any more than we would trust the North Korean intelligence community.

Perhaps more of a reason to trust the North Korean intelligence community because at least we know whose side they are on. As far as the DNI and the rest of the U.S. security community, hard to say whose side they are on. Booz Allen’s? NSA’s? CIA’s? Some other contractors? Certainly not on the side of Congress and not on the side of the American people, despite their delusional pretensions to the contrary.

No doubt there is a role for a well-functioning and accountable intelligence community for the United States. That in no way could be applied to our current intelligence community, which is is a collection of parochial silos more concerned with guarding their turf and benefiting their contractors than any semblance of service to the American people.

Congress needs to end the intelligence community as we know it and soon. In the not distant future, the DNI and not the President will be the decision maker in Washington.

SecLists.Org Security Mailing List Archive

Filed under: Cybersecurity,Security — Patrick Durusau @ 4:33 pm

SecLists.Org Security Mailing List Archive

From the webpage:

Any hacker will tell you that the latest news and exploits are not found on any web site—not even Insecure.Org. No, the cutting edge in security research is and will continue to be the full disclosure mailing lists such as Bugtraq. Here we provide web archives and RSS feeds (now including message extracts), updated in real-time, for many of our favorite lists. Browse the individual lists below, or search them all:

Subject to my proclivity for sorting, ;-), the following list archives appear at SecList.Org.

Insecure.Org Lists

Full Disclosure — A public, vendor-neutral forum for detailed discussion of vulnerabilities and exploitation techniques, as well as tools, papers, news, and events of interest to the community. It higher traffic than other lists, but the relaxed atmosphere of this quirky list provides some comic relief and certain industry gossip. More importantly, fresh vulnerabilities sometimes hit this list many hours or days before they pass through the Bugtraq moderation queue.

Nmap Announce — Moderated list for the most important new releases and announcements regarding the Nmap Security Scanner and related projects. We recommend that all Nmap users subscribe.

Nmap Development — Unmoderated technical development forum for debating ideas, patches, and suggestions regarding proposed changes to Nmap and related projects. Subscribe here.

Other Excellent Security Lists

Bugtraq — The premier general security mailing list. Vulnerabilities are often announced here first, so check frequently!

CERT Advisories — The Computer Emergency Response Team has been responding to security incidents and sharing vulnerability information since the Morris Worm hit in 1986. This archive combines their technical security alerts, tips, and current activity lists.

Daily Dave — This technical discussion list covers vulnerability research, exploit development, and security events/gossip. It was started by ImmunitySec founder Dave Aitel and many security luminaries participate. Many posts simply advertise Immunity products, but you can’t really fault Dave for being self-promotional on a list named DailyDave.

Educause Security Discussion — Securing networks and computers in an academic environment.

Firewall Wizards — Tips and tricks for firewall administrators

Funsec — While most security lists ban off-topic discussion, Funsec is a haven for free community discussion and enjoyment of the lighter, more humorous side of the security community.

Honeypots — Discussions about tracking attackers by setting up decoy honeypots or entire honeynet networks.

IDS Focus — Technical discussion about Intrusion Detection Systems. You can also read the archives of a previous IDS list.

Info Security News — Carries news items (generally from mainstream sources) that relate to security.

Microsoft Sec Notification — Beware that MS often uses these security bulletins as marketing propaganda to downplay serious vulnerabilities in their products—note how most have a prominent and often-misleading “mitigating factors” section.

Open Source Security — Discussion of security flaws, concepts, and practices in the Open Source community

PaulDotCom — General discussion of security news, research, vulnerabilities, and the PaulDotCom Security Weekly podcast.

Penetration Testing — While this list is intended for “professionals”, participants frequenly disclose techniques and strategies that would be useful to anyone with a practical interest in security and network auditing.

Secure Coding — The Secure Coding list (SC-L) is an open forum for the discussion on developing secure applications. It is moderated by the authors of Secure Coding: Principles and Practices.

Security Basics — A high-volume list which permits people to ask “stupid questions” without being derided as “n00bs”. I recommend this list to network security newbies, but be sure to read Bugtraq and other lists as well.

Web App Security — Provides insights on the unique challenges which make web applications notoriously hard to secure, as well as attack methods including SQL injection, cross-site scripting (XSS), cross-site request forgery, and more.

Internet Issues and Infrastructure

Data Loss — Data Loss covers large-scale personal data loss and theft incidents. This archive combines the main list (news releases) and the discussion list.

Interesting People — David Farber moderates this list for discussion involving internet governance, infrastructure, and any other topics he finds fascinating

NANOG — The North American Network Operators’ Group discusses fundamental Internet infrastructure issues such as routing, IP address allocation, and containing malicious activity.

The RISKS Forum — Peter G. Neumann moderates this regular digest of current events which demonstrate risks to the public in computers and related systems. Security risks are often discussed.

Open Source Tool Development

Metasploit — Development discussion for Metasploit, the premier open source remote exploitation tool

Snort — Everyone’s favorite open source IDS, Snort. This archive combines the snort-announce, snort-devel, snort-users, and snort-sigs lists.

Wireshark — Discussion of the free and open source Wireshark network sniffer. No other sniffer (commercial or otherwise) comes close. This archive combines the Wireshark announcement, users, and developers mailing lists.

More Lists

Declan McCullagh’s Politech

Security Incidents

TCPDump/LibPCAP Dev

Vulnerability Development

Vulnerability Watch

BTW, a fascinating source of materials for indexing/mapping security issues.

Forty and Seven Inspector Generals Hit a Stone Wall

Filed under: Government,Government Data,Transparency — Patrick Durusau @ 3:16 pm

Inspectors general testify against agency ‘stonewalling’ before Congress by Sarah Westwood.

From the post:

Frustration with federal agencies that block probes from their inspectors general bubbled over Tuesday in a congressional hearing that dug into allegations of obstruction from a number of government watchdogs.

The Peace Corps, Environmental Protection Agency and Justice Department inspectors general each argued to members of the House Oversight and Government Reform Committee that some of their investigations had been thwarted or stalled by officials who refused to release necessary information to their offices.

Committee members from both parties doubled down on criticisms of the Justice Department’s lack of transparency and called for solutions to the government-wide problem during their first official hearing of the 114th Congress.

“If you can’t do your job, then we can’t do our job in Congress,” Chairman Jason Chaffetz, R-Utah, told the three witnesses and the scores of agency watchdogs who also attended, including the Department of Homeland Security and General Service Administration inspectors general.

Michael Horowitz, the Justice Department’s inspector general, testified that the FBI began reviewing requested documents in 2010 in what he said was a clear violation of federal law that is supposed to grant watchdogs unfettered access to agency records.

The FBI’s process, which involves clearing the release of documents with the attorney general or deputy attorney general, “seriously impairs inspector general independence, creates excessive delays, and may lead to incomplete, inaccurate or significantly delayed findings or recommendations,” Horowitz said.

Perhaps no surprise that the FBI shows up in the non-transparency column. But given the number of inspector generals with similar problems (47), it seems to be part of a larger herd.

If you are interested in going further into this issue, there was a hearing last August 2014), Obstructing Oversight: Concerns from Inspectors General, which is here in ASCII and here with video and witness statements in PDF.

Both sources omit the following documents:

Sept. 9, 2014, letter to Chairman Issa from OMB submitted by Chairman Issa.. 58
Aug. 5, 2014, letter to Reps. Issa, Cummings, Carper, and Coburn from 47 IGs, submitted by Rep. Chaffetz.. 61
Aug. 8, 2014, letter to OMB from Reps. Carper, Coburn, Issa and Cummings, submitted by Rep. Walberg.. 69
Statement for the record from The Institute of Internal Auditors. 71

Isn’t that rather lame? To leave these items in the table of contents but to omit them from the ASCII version and to not even include them with the witness statements.

I’m curious who the other forty-four (44) inspector generals might be. Aren’t you?

If you know where to find these appendix materials, please send me a pointer.

I think it will be more effective to list all of the Inspector Generals who have encountered this stone wall treatment than treat them as all and sundry.

Chairman Jason Chaffetz suggests that by controlling funding that Congress can force transparency. I would use a finer knife. Cut all funding for health care and retirement benefits in the agencies/departments in question. See how the rank and file in the agencies like them apples.

Assuming transparency results, I would not restore those benefits retroactively. Staff chose to support, explicitly or implicitly, illegal behavior. Making bad choices has negative consequences. It would be a teaching opportunity for all future federal staff members.

Linguistic Geographies: The Gough Map of Great Britain and its Making

Filed under: Cartography,History,Mapping,Maps — Patrick Durusau @ 2:31 pm

Linguistic Geographies: The Gough Map of Great Britain and its Making

From the home page:

The Gough Map is internationally-renowned as one of the earliest maps to show Britain in a geographically-recognizable form. Yet to date, questions remain of how the map was made, who made it, when and why.

This website presents an interactive, searchable edition of the Gough Map, together with contextual material, a blog, and information about the project and the Language of Maps colloquium.

Another snippet from the about page:

The Linguistic Geographies project involved a group of researchers from across three UK HEIs, each bringing distinctive skills and expertise to bear. Each has an interest in maps and mapping, though from differing disciplinary perspectives, from geography, cartography and history. Our aim was to learn more about the Gough Map, specifically, but more generally to contribute to ongoing intellectual debates about how maps can be read and interpreted; about how maps are created and disseminated across time and space; and about technologies of collating and representing geographical information in visual, cartographic form. An audio interview with two of the project team members – Keith Lilley and Elizabeth Solopova – is available via the Beyond Text web-site, at http://projects.beyondtext.ac.uk/video.php (also on YouTube).

The project’s focus on a map, as opposed to a conventional written text, thus opens up theoretical and conceptual issues about the relationships between ‘image’ and ‘text’ – for maps comprise both – and about maps as objects and artifacts with a complex and complicated ‘language’ of production and consumption. To explore these issues the project team organized an international colloquium on The Language of Maps, held over the weekend of June 23-25 2011 at the Bodleian Library Oxford. Further details and a short report on the colloquium are available here.

Be sure to visit the Beyond Text web-site. The interface under publications isn’t impressive but the publications for any given project are.

Cross Site Scripting zero-day bug [Or Feature?]

Filed under: Cybersecurity,Microsoft,Security — Patrick Durusau @ 1:36 pm

Internet Explorer has a Cross Site Scripting zero-day bug by Paul Ducklin.

From the post:

Another day, another zero-day.

This time, Microsoft Internet Explorer is attracting the sort of publicity a browser doesn’t want, following the public disclosure of what’s known as a Cross-Site Scripting, or XSS, bug.

With Microsoft apparently now investigating and looking at a patch, the timing of the disclosure certainly looks to be irresponsible.

There’s no suggestion that Microsoft failed to meet any sort of deadline to get a patch out, or even that the company was contacted in advance.

Nevertheless, details of the bug have been revealed, including some proof-of-concept JavaScript showing how to abuse the hole.

So, what is XSS, and what does this mean for security?

The bug violates the same origin policy (SOP) which Wikipedia describes as:

This mechanism bears a particular significance for modern web applications that extensively depend on HTTP cookies to maintain authenticated user sessions, as servers act based on the HTTP cookie information to reveal sensitive information or take state-changing actions. A strict separation between content provided by unrelated sites must be maintained on the client side to prevent the loss of data confidentiality or integrity.

While phrased in terms of “security,” take note that this includes content from other sites as well. As one post I read on to the topic suggested that content can be intermingled, but that isn’t the same as manipulation of content from another source.

If you think of SOP as preventing programmatic, creative and imaginative re-use of content from other sites, suddenly it sounds a lot less like a feature doesn’t it?

Only if you follow the “cookie, cookie, me want cookie” philosophy of browser interaction is SOP even necessary. Once I authenticate to a remote site, if state is maintained at all it could be maintained on the server side. Rendering SOP, how did Eve in the The Diaries of Adam and Eve put it?, ah, superfluous.

Curious how security became intertwined with the desire of content owners to prevent re-use of content. That doesn’t sound like a neutral choice to me. Perhaps we should make another choice and evolve a different security model for web browsers.

A different security model that puts security in the hands of those best able to maintain it, that is server side. And at the same time, empower users, script writers and others to re-use any content they can load into their browsers. Imagine the range of services and capabilities that would add!

Better security, better access to content from any site. Sounds like a win-win to me. You?

In the meantime, thinks with IE may not be as grim as reported. Sean Michael Kerner reports in: Researcher Discloses Potential Internet Explorer XSS Zero-Day Flaw, that Microsoft has known about the bug since October 13, 2014 and doesn’t seem to be all that excited about it.

I make that to be 115 days, including February 4, 2015, so zero-day + 115 days. Rather long in the tooth for a zero-day bug I would say. 😉 You do know that “zero-day” doesn’t mean the day you read about it. Yes?

The bug was reported on the Full Disclosure list, for which neither of the posts cited gave a URL.

PS: Is anyone working on a fork of JavaScript that enables cross site scripting by design? The advantages for content re-use would be enormous. Users in charge of content on their own screens. What a concept.

February 4, 2015

Graph-Tool – Update!

Filed under: Graphs,Networks — Patrick Durusau @ 8:35 pm

Graph-Tool – Update!

From the webpage:

Graph-tool is an efficient Python module for manipulation and statistical analysis of graphs (a.k.a. networks). Contrary to most other python modules with similar functionality, the core data structures and algorithms are implemented in C++, making extensive use of template metaprogramming, based heavily on the Boost Graph Library. This confers it a level of performance that is comparable (both in memory usage and computation time) to that of a pure C/C++ library.

A new version of graph-tool is available for downloading!

A graph based analysis of the 2016 U.S. Budget is going to require all the speed you can muster!

Enjoy!

[U.S.] President’s Fiscal Year 2016 Budget

Filed under: Government,Government Data,Politics — Patrick Durusau @ 7:45 pm

Data for the The President’s Fiscal Year 2016 Budget

From the webpage:

Each year, after the President’s State of the Union address, the Office of Management and Budget releases the Administration’s Budget, offering proposals on key priorities and newly announced initiatives. This year we are releasing all of the data included in the President’s Fiscal Year 2016 Budget in a machine-readable format here on GitHub. The Budget process should be a reflection of our values as a country, and we think it’s important that members of the public have as many tools at their disposal as possible to see what is in the President’s proposals. And, if they’re motivated to create their own visualizations or products from the data, they should have that chance as well.

You can see the full Budget on Medium.

About this Repository

This repository includes three data files that contain an extract of the Office of Management and Budget (OMB) budget database. These files can be used to reproduce many of the totals published in the Budget and examine unpublished details below the levels of aggregation published in the Budget.

The user guide file contains detailed information about this data, its format, and its limitations. In addition, OMB provides additional data tables, explanations and other supporting documents in XLS format on its website.

Feedback and Issues

Please submit any feedback or comments on this data, or the Budget process here.

Before you start cheering too loudly, spend a few minutes with the User Guide. Not impenetrable but not an easy stroll either. I suspect the additional data tables, etc. are going to be necessary for interpretation of the main files.

Writing up how to use this data set would be a large but worthwhile undertaking.

A larger in scope but also worthwhile project would be to track how the initial allocations in the budget change through the legislative process. That is to know on a day to day basis, which departments, programs, etc. are up or down. Tied to votes in Congress and particular amendments that could prove to be very interesting.


Update: A tweet from Aaron Kirschenfeld directed us to: The U.S. Tax Code Is a Travesty by John Cassidy. Cassidy says to take a look at table S-9 in the numbers section under “Loophole closers.” The trick to the listed loopholes is that very few people qualify for the loophole. See Cassidy’s post for the details.

Other places that merit special attention?


Update: DHS Budget Justification 2016 (3906 pages, PDF). First saw this in a tweet by Dave Maass.

All Models of Learning have Flaws

Filed under: Artificial Intelligence,Machine Learning — Patrick Durusau @ 5:55 pm

All Models of Learning have Flaws by John Langford.

From the post:

Attempts to abstract and study machine learning are within some given framework or mathematical model. It turns out that all of these models are significantly flawed for the purpose of studying machine learning. I’ve created a table (below) outlining the major flaws in some common models of machine learning.

Quite dated (2007) but still quite handy chart of what is “right” and “wrong” about machine learning models.

Would be even more useful with smallish data sets that illustrate what is “right” and “wrong” about each model.

Anything you would add or take away?

I first saw this in a tweet by Computer Science.

Is 123456 Really The Most Common Password?

Filed under: Cybersecurity,Security — Patrick Durusau @ 5:44 pm

Is 123456 Really The Most Common Password? by Mark Burnett.

From the post:

I recently worked with SplashData to compile their 2014 Worst Passwords List and yes, 123456 tops the list. In the data set of 3.3 million passwords I used for SplashData, almost 20,000 of those were in fact 123456. But how often do you really see people using that, or the second most common password, password in real life? Are people still really that careless with their passwords?

While 123456 is indeed the most common password, that statistic is a bit misleading. Although 0.6% of all users on my list used that password, it’s important to remember that 99.4% of the users on my list didn’t use that password. What is noteworthy here is that while the top passwords are still the top passwords, the number of people using those passwords has dramatically decreased.

The fact is that the top passwords are always going to be the top passwords, it’s just that the percentage of users actually using those will–at least we hope–continually get smaller. This year, for example, a hacker using the top 10 password list would statistically be able to guess 16 out of 1000 passwords.

Getting a true picture of user passwords is surprisingly difficult. Even though password is #2 on the list, I don’t know if I have seen someone actually use that password for years. Part of the problem is how we collect and analyze password data. Because we typically can’t just go to some company and ask for all their user passwords, we have to go with the data that is available to us. And that data does have problems.

Unlike cybersecurity alarmists, Mark has an acute sense for the difficulties in his password data.

Mark’s questions about his data make a good template for questioning the “data” used in other cybersecurity reports. Or to put it another way, cybersecurity reports that don’t ask the same questions should be viewed with suspicion.

Somewhat dated now but Mark has also authored: How I Collect Passwords which should give you some tips on collecting passwords and possibly other data.

I first saw this in the CouchDB Weekly News, February 03, 2015.

Google Freebase Annotations of TREC KBA 2014 Stream Corpus, v1 (FAKBA1)

Filed under: Entities,Freebase,TREC — Patrick Durusau @ 5:26 pm

Google Freebase Annotations of TREC KBA 2014 Stream Corpus, v1 (FAKBA1)

From the webpage:

Researchers at Google annotated the English-language pages from the TREC KBA Stream Corpus 2014 with links to Freebase. The annotation was performed automatically and are imperfect. For each entity recognized with high confidence an annotation with a link to Freebase is provided (see the details below).

For any questions, join this discussion forum: https://groups.google.com/group/streamcorpus.

Data Description

The entity annotations are for the TREC KBA Stream Corpus 2014. These annotations are freely available. The annotation data for the corpus is provided as a collection of 2000 files (the partitioning is somewhat arbitrary) that total 196 GB, compressed (gz). Each file contains annotations for a batch of pages and the entities identified on the page. These annotations are freely available.

I first saw this in a tweet by Jeff Dalton.

Jeff has a blog post about this release at: Google Research Entity Annotations of the KBA Stream Corpus (FAKBA1). Jeff speculates on the application of this corpus to other TREC tasks.

Jeff suggests that you monitor Knowledge Data Releases for future data releases. I need to ping Jeff as the FAKBA1 release does not appear on the Knowledge Data Release page.

BTW, don’t be misled by the “9.4 billion entity annotations from over 496 million documents” statistic. Impressive but ask yourself, how many of your co-workers, their friends, families, relationships at work, projects where you work, etc. appear in Freebase? Sounds like there is a lot of work to be done with your documents and data that have little or nothing to do with Freebase. Yes?

Enjoy!

Creating Excel files with Python and XlsxWriter

Filed under: Excel,Microsoft,Python,Spreadsheets — Patrick Durusau @ 4:53 pm

Creating Excel files with Python and XlsxWriter

From the post:

XlsxWriter is a Python module for creating Excel XLSX files.

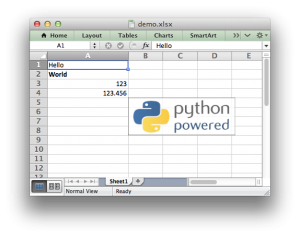
demo-xlsxwriter

(Sample code to create the above spreadsheet.)

XlsxWriter

XlsxWriter is a Python module that can be used to write text, numbers, formulas and hyperlinks to multiple worksheets in an Excel 2007+ XLSX file. It supports features such as formatting and many more, including:

  • 100% compatible Excel XLSX files.
  • Full formatting.
  • Merged cells.
  • Defined names.
  • Charts.
  • Autofilters.
  • Data validation and drop down lists.
  • Conditional formatting.
  • Worksheet PNG/JPEG images.
  • Rich multi-format strings.
  • Cell comments.
  • Memory optimisation mode for writing large files.

I know what you are thinking. If you are processing the data with Python, why the hell would you want to write data to XSL or XLSX?

Good question! But it also has an equally good answer.

Attend a workshop for mid-level managers and introduce one of the speakers saying:

We are going to give away copies of the data used in this presentation. By show of hands, how many people want it in R format? Now, how many people want it in Excel format?

Or you can reverse the questions so the glazed look from the audience on the R question doesn’t blind you. 😉

If your data need to transition to management, at least most management, spreadsheet formats are your friend.

If you don’t believe me, see any number of remarkable presentation by Felienne Hermans on the use of spreadsheets or check out my spreadsheets category.

Don’t get me wrong, I prefer being closer to the metal but on the other hand, delivering data that users can use is more profitable than the alternatives.

I first saw this in a tweet by Scientific Python.

ChEMBL 20 incorporates the Pistoia Alliance’s HELM annotation

Filed under: Bioinformatics,Chemistry,Medical Informatics — Patrick Durusau @ 4:35 pm

ChEMBL 20 incorporates the Pistoia Alliance’s HELM annotation by Richard Holland.

From the post:

The European Bioinformatics Institute (EMBL-EBI) has released version 20 of ChEMBL, the database of compound bioactivity data and drug targets. ChEMBL now incorporates the Hierarchical Editing Language for Macromolecules (HELM), the macromolecular representation standard recently released by the Pistoia Alliance.

HELM can be used to represent simple macromolecules (e.g. oligonucleotides, peptides and antibodies) complex entities (e.g. those with unnatural amino acids) or conjugated species (e.g. antibody-drug conjugates). Including the HELM notation for ChEMBL’s peptide-derived drugs and compounds will, in future, enable researchers to query that content in new ways, for example in sequence- and chemistry-based searches.

Initially created at Pfizer, HELM was released as an open standard with an accompanying toolkit through a Pistoia Alliance initiative, funded and supported by its member organisations. EMBL-EBI joins the growing list of HELM adopters and contributors, which include Biovia, ACD Labs, Arxspan, Biomax, BMS, ChemAxon, eMolecules, GSK, Lundbeck, Merck, NextMove, Novartis, Pfizer, Roche, and Scilligence. All of these organisations have either built HELM-based infrastructure, enabled HELM import/export in their tools, initiated projects for the incorporation of HELM into their workflows, published content in HELM format, or supplied funding or in-kind contributions to the HELM project.

More details:

The European Bioinformatics Institute

HELM project (open source, download, improve)

Pistoia Alliance

Another set of subjects ripe for annotation with topic maps!

Oranges and Blues

Filed under: Image Understanding,UX,Visualization — Patrick Durusau @ 4:19 pm

Oranges and Blues by Edmund Helmer.

From the post:

Title-Fifth-Element

When I launched this site over two years ago, one of my first decisions was to pick a color scheme – it didn’t take long. Anyone who watches enough film becomes quickly used to Hollywood’s taste for oranges and blues, and it’s no question that these represent the default palette of the industry; so I made those the default of BoxOfficeQuant as well. But just how prevalent are the oranges and blues?

Some people have commented and researched how often those colors appear in movies and movie posters, and so I wanted to take it to the next step and look at the colors used in film trailers. Although I’d like to eventually apply this to films themselves, I used trailers because 1) They’re our first window into what a movie will look like, and 2) they’re easy to get (legally). So I’ve downloaded all the trailers available on the-numbers.com, 312 in total – not a complete set, but the selection looks random enough – and I’ve sampled across all the frames of these trailers to extract their Hue, Saturation, and Value. If you’re new to those terms, the chart below should make it clear enough: Hue is the color, Value is the distance from black, (and saturation, not shown, is the color intensity).

Edmund’s data isn’t “big” or “fast” but it is “interesting.” Unfortunately, “interesting” data is one of those categories where I know it when I see it.

I have seen movies and movie trailers but it never occurred to me to inspect the colors used in movie trailers. Turns out to not be a random choice. Great visualizations in this post and a link to further research on genre and colors, etc.

How is this relevant to you? Do you really want to use scary colors for your UI? It’s not really that simple but neither are movie trailers. What makes some capture your attention and stay with you? Others you could not repeat at the end of the next commercial. Personally, I would prefer a UI that captured my attention and that I remembered from the first time I saw it. (Especially if I were selling the product with that UI.)

You?

I first saw this in a tweet by Neil Saunders.

PS: If you are interested in statistics and film, BoxOfficeQuant – Statistics and Film (Edmund’s blog) is a great blog to follow.

What Happens if We #Sunset215? [Patriot Act surveillance]

Filed under: Government,NSA,Security — Patrick Durusau @ 3:11 pm

What Happens if We #Sunset215? by Harley Geiger.

From the post:

A law the government cites as authority for the bulk collection of millions of Americans’ communications records—Section 215 of the PATRIOT Act—expires unless Congress extends it by Memorial Day weekend.

The Center for Democracy & Technology, and other public interest groups, believes that Sec. 215 should sunset unless it is reformed to stop nationwide surveillance dragnets. What would happen to domestic bulk collection if Sec. 215 sunsets?

After a detailed review of the history and nuances of Sec. 215, Harley says:


Sunset of Sec. 215 would prevent new bulk collection programs under Sec. 215, but would not affect current bulk collection programs under Sec. 215, nor prevent bulk collection programs under the FISA pen/trap statute. From the perspective of the intelligence community, a sunset of Sec. 215 would deprive the government of an evidence-gathering tool with many targeted, legitimate uses other than bulk collection.

I’m sorry, that went by a little fast.

Even if Sec. 215 sunsets, what evidence is there that the government would stop conducting new bulk collection programs or more targeted uses other than bulk collection?

The evidence we do have suggests that sunsetting Sec. 215 will have no impact on NSA data collection efforts. For example, James Clapper lying to Congress. Fire James Clapper. What does that say to lower staffer who appear before Congress or who are interviewed by investigators? Particularly with regard to the consequences of lying to Congress or to investigators?

If Congress and other investigators can’t get truthful answers from the NSA, who is to say that Sec. 215 sunsetting has had any impact at all? A drop in FISA requests? Perhaps the NSA just decides to drop the fiction that the FISA court is any meaningful limit on their power.

The post footer says:

Harley Geiger is Advocacy Director and Senior Counsel at the Center for Democracy & Technology (CDT).

And I am sure that he is far more qualified than I am to address the policy issues of Sec. 215, if one assumes the government is telling the truth and playing by the rules Congress has passed. But the evidence we have to date suggests that the government isn’t telling the truth and pays lip service to any rule that Congress passes.

What needs to sunset is all bulk data collection and all targeted collection that is not subject to the traditional safeguards of U.S. district courts. My suggestion is embedded congressional oversight in all agencies that conduct surveillance with clearance to see or go anywhere, including any compartmentalized projects.

If the argument is that the honest public need not fear bulk surveillance, then honest agencies need fear no embedded congressional oversight.

« Newer PostsOlder Posts »

Powered by WordPress