Another Word For It Patrick Durusau on Topic Maps and Semantic Diversity

June 30, 2014

Fess

Filed under: Search Engines,Solr — Patrick Durusau @ 8:31 pm

Fess: Open Source Enterprise Search Server

From the homepage:

Fess is very powerful and easily deployable Enterprise Search Server. You can install and run Fess quickly on any platforms, which have Java runtime environment. Fess is provided under Apache license.

[image omitted]

Fess is Solr based search server, but knowledge/experience about Solr is NOT needed because of All-in-One Enterprise Search Server. Fess provides Administration GUI to configure the system on your browser. Fess also contains a crawler, which can crawl documents on Web/File System/DB and support many file formats, such as MS Office, pdf and zip.

Features

  • Very Easy Installation/Configuration
  • Apache License (OSS)
  • OS-independent (Runs on Java)
  • Crawl documents on Web/File System/DB/Windows Shared Folder
  • Support many document types, such as MS Office, PDF, Zip archive,…
  • Support a web page for BASIC/DIGEST/NTLM authentication
  • Contain Apache Solr as a search engine
  • Provide UI as a responsive web design
  • Provide a browser based administative page
  • Support a role authentication
  • Support XML/JSON/JSONP format
  • Provide a search/click log and statistics
  • Provide auto-complete(suggest)

Sounds interesting enough.

I don’t have a feel for the trade-offs between a traditional Solr/Tomcat install and what appears to be a Solr-out-of-the-box solution. At least not today.

I recently built a Solr/Tomcat install on a VM so this could be a good comparison to that process.

Any experience with Fess?

12 JavaScript Libraries for Data Visualization

Filed under: Javascript,Visualization — Patrick Durusau @ 7:02 pm

12 JavaScript Libraries for Data Visualization by Thomas Greco.

Thomas gives quick summaries and links for:

  • Dygraphs.js
  • D3.js
  • InfoVis
  • The Google Visualization API
  • Springy.js
  • Polymaps.js
  • Dimple
  • Sigma.js
  • Raphael.js
  • gRaphëaut;l
  • Leaflet
  • Ember Charts

Do you see any old friends? See any you don’t yet know?

Enjoy!

Hypothes.is Project

Filed under: Annotation — Patrick Durusau @ 6:52 pm

Hypothes.is Project

From the post:

The Hypothes.is Project is pleased to announce an award for $752,000 from the Andrew W. Mellon Foundation to investigate the use of annotation in humanities and social science scholarship over a two year period. Our partners in this grant include Michigan Publishing at the University of Michigan; Project MUSE at the Johns Hopkins University; Project Scalar at USC; Stanford University’s Shared Canvas; the Modern Language Association, and the Open Knowledge Foundation. In addition, we will be working with the World Wide Web Consortium (W3C) and edX/HarvardX to explore integration into other environments with high user interaction.

This grant was established to address potential impediments in the arts and humanities which could retard the adoption of open standards. These barriers range from the prevalence of more tradition-bound forms of communication and publishing; the absence of pervasive experimentation with network-based models of sharing and knowledge extraction; the difficulties of automating description for arts and disciplines of practice; and the reliance on information dense media such as images, audio, and video. Nonetheless, we believe that with concerted work among our partners, alongside groups making steady progress in the annotation community, we can unite useful threads, bringing the arts and humanities to a point where self-sustaining interest in annotation can be reached.

The project is also seeking donations of time and expertise and subject identity is always in play with annotation projects.

Are you familiar with this project?

Balisage Travel Shortage!

Filed under: Conferences — Patrick Durusau @ 4:44 pm

I’m the last person in the world to start rumors about a shortage of airline seats to Washington, DC. Especially around the Balisage Markup Conference, August 4 — 8, 2014 (Bethesda North Marriott Hotel & Conference Center).

However unreliable my information may be, I don’t want Balisage registrants to miss out by waiting too late to order plane tickets.

I can’t say (under certain non-disclosure agreements) if it was the posting of the Late Breaking News slots:

  • Streamable functions in XSLT 3.0
  • Teaching XQuery to (non-programmer) humanists
  • Making XML easy to work with (an easier API for XML than SAX or DOM)
  • Extending the relevance of XPath
  • Identity Constraints for XML
  • Teaching NIEM-based models to XML and NIEM novices
  • Enabling XML entity reference while protecting against data theft and denial-of-service attacks

that prompted the rumors that lead to this post or not. Use your own judgement.

Teaching XQuery to (non-programmer) humanists? Need a session on teaching programmers (non-humanists) to write documentation. Do you remember that Nietzsche quote about remembering to take your whip?

Well, without disclosing any information that would impair national security or be an aid to the fifth columnists in DC, I have tried to warn you about getting to Balisage.

It’s now up to you to take the appropriate action. (And register for Balisage at the same time.)

Quick Play with Cayley Graph DB…

Filed under: Cayley,Graphs — Patrick Durusau @ 4:20 pm

Quick Play with Cayley Graph DB and Ordnance Survey Linked Data by John Goodwin.

From the post:

Earlier this month Google announced the release of the open source graph database/triplestore Cayley. This weekend I thought I would have a quick look at it, and try some simple queries using the Ordnance Survey Linked Data.

Just unpack to install.

Loading data is almost that easy, except that the examples are limited to n-triple format and the documentation doesn’t address importing other data types.

Has a Gremlin-“inspired” query language, which makes me wonder what shortcoming in Gremlin is addressed by this new query language?

If there is, that isn’t apparent from the documentation which is rather sparse at the moment.

It will be interesting to see if Cayley goes beyond the capabilities of the average graph db or not.

June 29, 2014

Snark Hunting: Force Directed Graphs in D3

Filed under: D3,Graphs,Visualization — Patrick Durusau @ 7:13 pm

Snark Hunting: Force Directed Graphs in D3 by Stephen Hall.

From the post:

Is it possible to write a blog post that combines d3.js, pseudo-classical JavaScript, graph theory, and Lewis Carroll? Yes, THAT Lewis Carroll. The one who wrote Alice in Wonderland. We are going to try it here. Graphs can be pretty boring so I thought I would mix in some fun historical trivia to keep it interesting as we check out force directed graphs in D3. In this post we are going to develop a tool to load up, display, and manipulate multiple graphs for exploration using the pseudo-classical pattern in JavaScript. We’ll add in some useful features, a bit of style, and some cool animations to make a finished product (see the examples below).

As usual, the demos presented here use a minimal amount of code. There’s only about 250 lines of JavaScript (if you exclude the comments) in these examples. So it’s enough to be a good template for your own project without requiring a ton of time to study and understand. The code includes some useful lines to keep the visualization responsive (without requiring JQuery) and methods that do things like remove or add links or nodes.

There’s also a fun “shake” method to help minimize tangles when the graph is displayed by agitating the nodes a little. I find it annoying when the graph doesn’t display correctly when it loads, so we’ll take care of that. Additionally, the examples incorporate a set of controls to help understand and explore the effect of the various D3 force layout parameters using the awesome dat.gui library from Google. You can see a picture of the controls above. We’ll cover the controls in depth below, but first I’ll introduce the examples and talk a little bit about the data.

I don’t think graphs are boring at all but must admit that adding Lewis Carroll to the mix doesn’t hurt a bit.

Great way to start off the week!

PS: The Hunting of the Snark (An Agony in 8 Fits) (PDF, 1876 edition)

June 28, 2014

Why Extended Attributes are Coming to HDFS

Filed under: Files,HDFS — Patrick Durusau @ 4:23 pm

Why Extended Attributes are Coming to HDFS by Charles Lamb.

From the post:

Extended attributes in HDFS will facilitate at-rest encryption for Project Rhino, but they have many other uses, too.

Many mainstream Linux filesystems implement extended attributes, which let you associate metadata with a file or directory beyond common “fixed” attributes like filesize, permissions, modification dates, and so on. Extended attributes are key/value pairs in which the values are optional; generally, the key and value sizes are limited to some implementation-specific limit. A filesystem that implements extended attributes also provides system calls and shell commands to get, list, set, and remove attributes (and values) to/from a file or directory.

Recently, my Intel colleague Yi Liu led the implementation of extended attributes for HDFS (HDFS-2006). This work is largely motivated by Cloudera and Intel contributions to bringing at-rest encryption to Apache Hadoop (HDFS-6134; also see this post) under Project Rhino – extended attributes will be the mechanism for associating encryption key metadata with files and encryption zones — but it’s easy to imagine lots of other places where they could be useful.

For instance, you might want to store a document’s author and subject in sometime like user.author=cwl and user.subject=HDFS. You could store a file checksum in an attribute called user.checksum. Even just comments about a particular file or directory can be saved in an extended attribute.

In this post, you’ll learn some of the details of this feature from an HDFS user’s point of view.

Extended attributes sound like an interesting place to tuck away additional information about a file.

Such as the legend to be used to interpret it?

Apache Lucene/Solr 4.9.0 Released!

Filed under: Lucene,Solr — Patrick Durusau @ 4:09 pm

From the announcement:

The Lucene PMC is pleased to announce the availability of Apache Lucene 4.9.0 and Apache Solr 4.9.0.

Lucene can be downloaded from http://lucene.apache.org/core/mirrors-core-latest-redir.html and Solr can be downloaded from http://lucene.apache.org/solr/mirrors-solr-latest-redir.html

See the Lucene CHANGES.txt and Solr CHANGES.txt files included with the release for a full list of details.

June 27, 2014

Communicating and resolving entity references

Filed under: Communication,Entity Resolution,Shannon,Subject Identity — Patrick Durusau @ 1:17 pm

Communicating and resolving entity references by R.V. Guha.

Abstract:

Statements about entities occur everywhere, from newspapers and web pages to structured databases. Correlating references to entities across systems that use different identifiers or names for them is a widespread problem. In this paper, we show how shared knowledge between systems can be used to solve this problem. We present “reference by description”, a formal model for resolving references. We provide some results on the conditions under which a randomly chosen entity in one system can, with high probability, be mapped to the same entity in a different system.

An eye appointment is going to prevent me from reading this paper closely today.

From a quick scan, do you think Guha is making a distinction between entities and subjects (in the topic map sense)?

What do you make of literals having no identity beyond their encoding? (page 4, #3)

Redundant descriptions? (page 7) Would you say that defining a set of properties that must match would qualify? (Or even just additional subject indicators?)

Expect to see a lot more comments on this paper.

Enjoy!

I first saw this in a tweet by Stefano Bertolo.

Propositions as Types

Filed under: Computer Science,Logic,Programming,Types — Patrick Durusau @ 12:56 pm

Propositions as Types by Philip Wadler.

From the Introduction::

Powerful insights arise from linking two fields of study previously thought separate. Examples include Descartes’s coordinates, which links geometry to algebra, Planck’s Quantum Theory, which links particles to waves, and Shannon’s Information Theory, which links thermodynamics to communication. Such a synthesis is offered by the principle of Propositions as Types, which links logic to computation. At first sight it appears to be a simple coincidence—almost a pun—but it turns out to be remarkably robust, inspiring the design of automated proof assistants and programming languages, and continuing to influence the forefronts of computing.

Propositions as Types is a notion with many names and many origins. It is closely related to the BHK Interpretation, a view of logic developed by the intuitionists Brouwer, Heyting, and Kolmogorov in the 1930s. It is often referred to as the Curry-Howard Isomorphism, referring to a correspondence observed by Curry in 1934 and refined by Howard in 1969 (though not published until 1980, in a Festschrift dedicated to Curry). Others draw attention to significant contributions from de Bruijn’s Automath and Martin-Löf’s Type Theory in the 1970s. Many variant names appear in the literature, including Formulae as Types, Curry-Howard-de Bruijn Correspondence, Brouwer’s Dictum, and others.

Propositions as Types is a notion with depth. It describes a correspondence between a given logic and a given programming language, for instance, between Gentzen’s intuitionistic natural deduction (a logic) and Church’s simply-typed lambda calculus (which may be viewed as a programming language). At the surface, it says that for each proposition in the logic there is a corresponding type in the programming language—and vice versa…

Important work even if it is very heavy sledding!

BTW, Wadler mentions two textbook treatments of the subject:

M. H. Sørensen and P. Urzyczyn. Lectures on the Curry-Howard isomorphism. Elsevier, 2006. Amazon has it listed for $146.33.

S. Thompson. Type Theory and Functional Programming. Addison-Wesley, 1991. Better luck here, out of print and posted online by the author: https://www.cs.kent.ac.uk/people/staff/sjt/TTFP/. Errata page was last updated October 2013.

I just glanced at 4.10 Equality and 5.1 Assumptions – 5.2 Naming and abbreviations in Thompson and it promises to be an interesting read!

Enjoy!

I first saw this in a tweet by Chris Ford.

June 26, 2014

Charities, Transparency and Trade Secrets

Filed under: Transparency — Patrick Durusau @ 7:00 pm

Red Cross: How We Spent Sandy Money Is a ‘Trade Secret’ by Justin Elliott.

From the post:

Just how badly does the American Red Cross want to keep secret how it raised and spent over $300 million after Hurricane Sandy?

The charity has hired a fancy law firm to fight a public request we filed with New York state, arguing that information about its Sandy activities is a “trade secret.”

The Red Cross’ “trade secret” argument has persuaded the state to redact some material, though it’s not clear yet how much since the documents haven’t yet been released.

The documents include “internal and proprietary methodology and procedures for fundraising, confidential information about its internal operations, and confidential financial information,” wrote Gabrielle Levin of Gibson Dunn in a letter to the attorney general’s office.

If those details were disclosed, “the American Red Cross would suffer competitive harm because its competitors would be able to mimic the American Red Cross’s business model for an increased competitive advantage,” Levin wrote.

The letter doesn’t specify who the Red Cross’ “competitors” are.

I see bizarre stories on a regular basis but this is a real “man bites dog” sort of story.

See Justin’s post for the details, such as are known now. I am sure there will be follow up stories on these records.

It may just be my background but when anyone, government, charity, industry, assures me that information I can’t see is ok, that sets off multiple alarm bells.

You?

PS: Not that I think transparency automatically leads to better government or decision making. I do know that a lack of transparency, cf. the NSA, leads to very poor decision making.

Graphing 173 Million Taxi Rides

Filed under: Government,Government Data,GraphLab,Python — Patrick Durusau @ 6:43 pm

Interesting taxi rides dataset by Danny Bickson.

From the post:

I got the following from my collaborator Zach Nation. NY taxi ride dataset that was not properly anonymized and was reverse engineered to find interesting insights in the data.

Danny mapped the data using GraphLab and asks some interesting questions of the data.

BTW, Danny is offering the iPython notebook to play with!

Cool!

This is the same data set I mentioned in: On Taxis and Rainbows

Asteroid Hunting!

Filed under: Astroinformatics,Crowd Sourcing — Patrick Durusau @ 6:29 pm

Planetary Resources Wants Public to Help Find Asteroids by Doug Messier.

From the post:

Planetary Resources, the asteroid mining company, and Zooniverse today launched Asteroid Zoo (www.asteroidzoo.org), empowering students, citizen scientists and space enthusiasts to aid in the search for previously undiscovered asteroids. The program allows the public to join the search for Near Earth Asteroids (NEAs) of interest to scientists, NASA and asteroid miners, while helping to train computers to better find them in the future.

Asteroid Zoo joins the Zooniverse’s family of more than 25 citizen science projects! It will enable participants to search terabytes of imaging data collected by Catalina Sky Survey (CSS) for undiscovered asteroids in a fun, game-like process from their personal computers or devices. The public’s findings will be used by scientists to develop advanced automated asteroid-searching technology for telescopes on Earth and in space, including Planetary Resources’ ARKYD.

“With Asteroid Zoo, we hope to extend the effort to discover asteroids beyond astronomers and harness the wisdom of crowds to provide a real benefit to Earth,” said Chris Lewicki, President and Chief Engineer, Planetary Resources, Inc. “Furthermore, we’re excited to introduce this program as a way to thank the thousands of people who supported Planetary Resources through Kickstarter. This is the first of many initiatives we’ll introduce as a result of the campaign.”

The post doesn’t say who names an asteroid that qualifies for an Extinction Event. 😉 If it is a committee, it may go forever nameless.

Visualizing Algorithms

Filed under: Algorithms,Visualization — Patrick Durusau @ 4:03 pm

Visualizing Algorithms by Mike Bostock.

From the post:

Algorithms are a fascinating use case for visualization. To visualize an algorithm, we don’t merely fit data to a chart; there is no primary dataset. Instead there are logical rules that describe behavior. This may be why algorithm visualizations are so unusual, as designers experiment with novel forms to better communicate. This is reason enough to study them.

But algorithms are also a reminder that visualization is more than a tool for finding patterns in data. Visualization leverages the human visual system to augment human intellect: we can use it to better understand these important abstract processes, and perhaps other things, too.

Better start with fresh pot of coffee when you read Mike’s post. Mike covers visualization of sampling algorithms using Van Gogh’s The Starry Night, sorting and maze generation (2-D). It is well written and illustrated but it is a lot of material to cover in one read.

The post finishes up with numerous references to other algorithm visualization efforts.

Put on your “must read” list for this weekend!

Who Needs Terrorists? We Have The NSA.

Filed under: Cybersecurity,NSA,Security — Patrick Durusau @ 3:45 pm

Germany dumps Verizon for government work over NSA fears by David Meyer.

From the post:

The German government is ditching Verizon as its network infrastructure provider, and it’s citing Edward Snowden’s revelations about NSA surveillance as a reason.

David summarizes and gives pointers to all the statements you will need for “thank you” notes to the NSA or complaints to the current and past administrations.

United States citizens don’t need to worry about possible terrorist attacks. Our own government agencies are working to destroy any trust or confidence in U.S. technology companies. Care to compare that damage to the fictional damage from imagined terrorists?

Are there terrorists in the world? You bet. But the relevant question is: Other than blowing smoke for contracts and appropriations, what real danger exists for average U.S. citizen?

I read recently that “6 times more likely to die from hot weather than from a terrorist attack.” For similar numbers and sources, see: Fear of Terror Makes People Stupid.

Let’s not worry the country into the poor house over terrorism.

When anyone claims we are in danger from terrorism, press them for facts. What data? What intelligence? Press for specifics.

If they claim the details are “secret,” know that they don’t know and don’t want you to know they don’t know. (Remembering the attack that was going to happen at the Russian Olympics. Not a threat, not a warning, but was going to happen. Which didn’t happen, by the way.)

June 25, 2014

Storm 0.9.2 released

Filed under: Storm — Patrick Durusau @ 7:36 pm

Storm 0.9.2 released

From the post:

We are pleased to announce that Storm 0.9.2-incubating has been released and is available from the downloads page. This release includes many important fixes and improvements.

There are a number of fixes and improvements but the topology visualization tool by Kyle Nusbaum (@knusbaum) will be the one that catches your eye.

Upgrade before the next release catches you. 😉

One Hundred Million…

Filed under: Data,Image Processing,Image Understanding,Yahoo! — Patrick Durusau @ 7:29 pm

One Hundred Million Creative Commons Flickr Images for Research by David A. Shamma.

From the post:

Today the photograph has transformed again. From the old world of unprocessed rolls of C-41 sitting in a fridge 20 years ago to sharing photos on the 1.5” screen of a point and shoot camera 10 years back. Today the photograph is something different. Photos automatically leave their capture (and formerly captive) devices to many sharing services. There are a lot of photos. A back of the envelope estimation reports 10% of all photos in the world were taken in the last 12 months, and that was calculated three years ago. And of these services, Flickr has been a great repository of images that are free to share via Creative Commons.

On Flickr, photos, their metadata, their social ecosystem, and the pixels themselves make for a vibrant environment for answering many research questions at scale. However, scientific efforts outside of industry have relied on various sized efforts of one-off datasets for research. At Flickr and at Yahoo Labs, we set out to provide something more substantial for researchers around the globe.

[image omitted]

Today, we are announcing the Flickr Creative Commons dataset as part of Yahoo Webscope’s datasets for researchers. The dataset, we believe, is one of the largest public multimedia datasets that has ever been released—99.3 million images and 0.7 million videos, all from Flickr and all under Creative Commons licensing.

The dataset (about 12GB) consists of a photo_id, a jpeg url or video url, and some corresponding metadata such as the title, description, title, camera type, title, and tags. Plus about 49 million of the photos are geotagged! What’s not there, like comments, favorites, and social network data, can be queried from the Flickr API.

The good news doesn’t stop there, the 100 million photos have been analyzed for standard features as well!

Enjoy!

Covering the European Elections with Linked Data

Filed under: EU,Linked Data,Politics — Patrick Durusau @ 7:15 pm

Covering the European Elections with Linked Data by Basile Simon.

From the post:

What we wanted to do was:

  • to use Linked Data in a news context (something that the Vote2014 team was trying to do with Paul’s new model, article above),
  • to provide some background on this important event for the UK and Europe,
  • and to offer alternative coverage of the election (sort of).

In the end, we built an experimental dashboard for the elections, and eventually discovered some potentially editorially challenging stuff in our data—detailed below—which led us to decide not to release the experiment to the public. Despite being unable to release the project, this one or two weeks rush taught us lots, and we are today coming up with improvements to our data model, following the questions raised by our findings. Before we get to the findings, though, I’ll walk through the process of making the dashboard.

If you are thinking about covering the U.S. mid-term elections this Fall, you need to read Basile’s post.

Not only will you be inspired in many ways but you will gain insight into what it will take to have a quality interface ready by election time. It is a non-trivial task but apparently a very exciting one.

Perhaps you can provide an alternative to the mind numbing stalling until enough results are in for the elections to be called.

Gremlin and Visualization with Gephi [Death of Import/Export?]

Filed under: Gephi,Graphs,Gremlin,TinkerPop — Patrick Durusau @ 6:55 pm

Gremlin and Visualization with Gephi by Stephen Mallette.

From the post:

We are often asked how to go about graph visualization in TinkerPop. We typically refer folks to Gephi or Cytoscape as the standard desktop data visualization tools. The process of using those tools involves: getting your graph instance, saving it to GraphML (or the like) then importing it to those tools

TinkerPop3 now does two things to help make that process easier:

  1. A while back we introduced the “subgraph” step which allows you to pop-off a Graph instance from a Traversal, which help greatly simplify the typical graph visualization process with Gremlin, where you are trying to get a much smaller piece of your large graph to focus the visualization effort.
  2. Today we introduce a new :remote command in the Console. Recall that :remote is used to configure a different context where Gremlin will be evaluated (e.g. Gremlin Server). For visualization, that remote is called “gephi” and it configures the :submit command to take any Graph instance and push it through to the Gephi Streaming API. No more having to import/export files!

This rocks!

How do you imagine processing your data when import/export goes away?

Of course, this doesn’t have anything on *nix pipes but it is nice to see good ideas come back around.

Cayley

Filed under: Cayley,Graph Databases,Graphs — Patrick Durusau @ 6:45 pm

Cayley – An open-source graph database

From the webpage:

Cayley is an open-source graph inspired by the graph database behind Freebase and Google’s Knowledge Graph.

Its goal is to be a part of the developer’s toolbox where Linked Data and graph-shaped data (semantic webs, social networks, etc) in general are concerned.

Features

  • Written in Go
  • Easy to get running (3 or 4 commands, below)
  • RESTful API
    • or a REPL if you prefer
  • Built-in query editor and visualizer
  • Multiple query languages:
    • Javascript, with a Gremlin-inspired* graph object.
    • (simplified) MQL, for Freebase fans
  • Plays well with multiple backend stores:
  • Modular design; easy to extend with new languages and backends
  • Good test coverage
  • Speed, where possible.

Rough performance testing shows that, on consumer hardware and an average disk, 134m triples in LevelDB is no problem and a multi-hop intersection query — films starring X and Y — takes ~150ms.

If you are seriously thinking about a graph database, see also these comments. Not everything you need to know but useful comments none the less.

I first saw this in a tweet from Hacker News.

On Taxis and Rainbows

Filed under: Data,Privacy — Patrick Durusau @ 4:06 pm

On Taxis and Rainbows: Lessons from NYC’s improperly anonymized taxis logs by Vijay Pandurangan.

From the post:

Recently, thanks to a Freedom of Information request, Chris Whong received and made public a complete dump of historical trip and fare logs from NYC taxis. It’s pretty incredible: there are over 20GB of uncompressed data comprising more than 173 million individual trips. Each trip record includes the pickup and dropoff location and time, anonymized hack licence number and medallion number (i.e. the taxi’s unique id number, 3F38, in my photo above), and other metadata.

These data are a veritable trove for people who love cities, transit, and data visualization. But there’s a big problem: the personally identifiable information (the driver’s licence number and taxi number) hasn’t been anonymized properly — what’s worse, it’s trivial to undo, and with other publicly available data, one can even figure out which person drove each trip. In the rest of this post, I’ll describe the structure of the data, what the person/people who released the data did wrong, how easy it is to deanonymize, and the lessons other agencies should learn from this. (And yes, I’ll also explain how rainbows fit in).

I mention this because you may be interested in the data in large chunks or small chunks.

The other reason to mention this data set is the concern over “proper” anonymization of the data. As if failing to do that, resulted in a loss of privacy for the drivers.

I see no loss of privacy for the drivers.

I say that because the New York City Taxi and Limousine Commission already had the data. The question was: Will members of the public have access to the same data? Whatever privacy a taxi driver had was breached when the data went to the NYC Taxi and Limousine Commission.

That’s an important distinction. “Privacy” will be a regular stick the government trots out to defend its possessing data and not sharing it with you.

The government has no real interest in your privacy. Witness the rogue intelligence agencies in Washington if you have any doubts on that issue. The government wants to conceal your information, which it gained by fair and/or foul methods, from both you and the rest of us.

Why? I don’t know with any certainly. But based on my observations in both the “real world” and academia, most of it stems from “I know something you don’t,” and that makes them feel important.

I can’t imagine any sadder basis for feeling important. The NSA could print out a million pages of its most secret files and stack them outside my office. I doubt I would be curious enough to turn over the first page.

The history of speculation, petty office rivalries, snide remarks about foreign government officials, etc. are of no interest to me. I already assumed they were spying on everyone so having “proof” of that is hardly a big whoop.

But we should not be deterred by calls for privacy as we force government to disgorge data it has collected, including that of the NSA. Perhaps even licensing chunks of the NSA data for use in spy novels. That offers some potential for return on the investment in the NSA.
Friendly Fire: Death, Delay, and Dismay at the VA

Filed under: Government,Government Data — Patrick Durusau @ 9:11 am

Friendly Fire: Death, Delay, and Dismay at the VA by Sen. Tom Coburn, M.D.

From the introduction:

Too many men and women who bravely fought for our freedom are losing their lives, not at the hands of terrorists or enemy combatants, but from friendly fire in the form of medical malpractice and neglect by the Department of Veterans Affairs (VA).

Split-second medical decisions in a war zone or in an emergency room can mean the difference between life and death. Yet at the VA, the urgency of the battlefield is lost in the lethargy of the bureaucracy. Veterans wait months just to see a doctor and the Department has systemically covered up delays and deaths they have caused. For decades, the Department has struggled to deliver timely care to veterans.

The reason veterans care has suffered for so long is Congress has failed to hold the VA accountable. Despite years of warnings from government investigators about efforts to cook the books, it took the unnecessary deaths of veterans denied care from Atlanta to Phoenix to prompt Congress to finally take action. On June 11, 2014, the Senate recently approved a bipartisan bill to
allow veterans who cannot receive a timely doctor’s appointment to go to another doctor outside of the VA.1046

But the problems at the VA are far deeper than just scheduling. After all, just getting to see a doctor does not guarantee appropriate treatment. Veterans in Boston receive top-notch care, while those treated in Phoenix suffer from subpar treatment. Over the past decade, more than 1,000 veterans may have died as a result of VA malfeasance,1 and the VA has paid out nearly $1
billion to veterans and their families for its medical malpractice.2

The waiting list cover-ups and uneven care are reflective of a much larger culture within the VA, where administrators manipulate both data and employees to give an appearance that all is well.
….

I am digesting the full report but I’m not sure enabling veterans to see doctors outside the VA is the same thing as holding the VA “accountable.”

From the early reports in this growing tragedy, there appear to be any number of “dark places” where data failed to be collected, where data was altered, or where the VA simply refused to collect data that might have driven better oversight.

I don’t think the VA is unique in any of these practices so mapping what is known, what could have been known and dark places in the VA data flow, could be informative both for the VA and other agencies as well.

I first saw this at Full Text Reports, Beyond the Waiting Lists, New Senate Report Reveals a Culture of Crime, Cover-Up and Coercion within the VA.

June 24, 2014

DAMEWARE:…

Filed under: Astroinformatics,BigData,Data Mining — Patrick Durusau @ 6:16 pm

DAMEWARE: A web cyberinfrastructure for astrophysical data mining by Massimo Brescia, et al.

Abstract:

Astronomy is undergoing through a methodological revolution triggered by an unprecedented wealth of complex and accurate data. The new panchromatic, synoptic sky surveys require advanced tools for discovering patterns and trends hidden behind data which are both complex and of high dimensionality. We present DAMEWARE (DAta Mining & Exploration Web Application REsource): a general purpose, web-based, distributed data mining environment developed for the exploration of large datasets, and finely tuned for astronomical applications. By means of graphical user interfaces, it allows the user to perform classification, regression or clustering tasks with machine learning methods. Salient features of DAMEWARE include its capability to work on large datasets with minimal human intervention, and to deal with a wide variety of real problems such as the classification of globular clusters in the galaxy NGC1399, the evaluation of photometric redshifts and, finally, the identification of candidate Active Galactic Nuclei in multiband photometric surveys. In all these applications, DAMEWARE allowed to achieve better results than those attained with more traditional methods. With the aim of providing potential users with all needed information, in this paper we briefly describe the technological background of DAMEWARE, give a short introduction to some relevant aspects of data mining, followed by a summary of some science cases and, finally, we provide a detailed description of a template use case.

Despite the progress made in the creation of DAMEWARE, the authors conclude in part:

The harder problem for the future will be heterogeneity of platforms, data and applications, rather than simply the scale of the deployed resources. The goal should be to allow scientists to explore the data easily, with sufficient processing power for any desired algorithm to efficiently process it. Most existing ML methods scale badly with both increasing number of records and/or of dimensionality (i.e., input variables or features). In other words, the very richness of astronomical data sets makes them difficult to analyze….

The size of data sets is an issue, but heterogeneity issues with platforms, data and applications are several orders of magnitude more complex.

I remain curious when that is going to dawn on the the average “big data” advocate.

More Open-Source Clojure Systems, Please

Filed under: Clojure,Programming — Patrick Durusau @ 4:44 pm

More Open-Source Clojure Systems, Please by Paul Ingles and Thomas G. Kristensen.

From the post:

The threshold for learning and using Clojure has never been lower. A few years ago there were but a few books and only a handful of libraries from which to learn. We are now spoilt for choice when it comes to books and libraries, but new Clojure developers still find it difficult to get started with writing real-world applications.

The problem is that the pool of inspiration from which new developers can learn about Clojure is almost solely based on toy examples such as 4Clojure and open-source libraries; there are very few resources available for information on for building “real” applications.

At uSwitch, we’ve recently open-sourced two of the applications we use for running our data infrastructure. They both weigh in at around 400 lines of code, so they are fairly small and should be easy to read and understand. The applications are:

  • Blueshift. An application for monitoring folders in a S3 bucket and automatically load TSV-files into Redshift. For more details into the rationale of Blueshift, see its design document.
  • Bifrost. An application for consuming topics from Kafka (a message-broker system) and archiving them to S3. For more details into the rationale of Bifrost, see its README.

We’ve open-sourced Blueshift and Bifrost because they’re useful and Clojure systems. It is our hope that they will serve as inspiration for developers who are new to Clojure, who and want to see examples of applications running in the wild.

We also hope it serves as inspiration for battle-hardened Clojure developers looking for ideas when writing their next Clojure application.

The rest of this post will go through some of the common Clojure practices that we use here at uSwitch. We’ll give references to namespaces in Blueshift and Bifrost demonstrating these practices. Even if you’re not familiar with S3, Redshift or Kafka, the practices presented are general and context-independent.

….

A shortage of good open-source code hurts everyone: How Benjamin Franklin Would’ve Learned To Program.

‘A Perfect and Beautiful Machine’:…

Filed under: Artificial Intelligence,Evoluntionary — Patrick Durusau @ 4:28 pm

‘A Perfect and Beautiful Machine’: What Darwin’s Theory of Evolution Reveals About Artificial Intelligence by Daniel C. Dennett.

From the post:


All things in the universe, from the most exalted (“man”) to the most humble (the ant, the pebble, the raindrop) were creations of a still more exalted thing, God, an omnipotent and omniscient intelligent creator — who bore a striking resemblance to the second-most exalted thing. Call this the trickle-down theory of creation. Darwin replaced it with the bubble-up theory of creation. One of Darwin’s nineteenth-century critics, Robert Beverly MacKenzie, put it vividly:

In the theory with which we have to deal, Absolute Ignorance is the artificer; so that we may enunciate as the fundamental principle of the whole system, that, in order to make a perfect and beautiful machine, it is not requisite to know how to make it. This proposition will be found, on careful examination, to express, in condensed form, the essential purport of the Theory, and to express in a few words all Mr. Darwin’s meaning; who, by a strange inversion of reasoning, seems to think Absolute Ignorance fully qualified to take the place of Absolute Wisdom in all the achievements of creative skill.

It was, indeed, a strange inversion of reasoning. To this day many people cannot get their heads around the unsettling idea that a purposeless, mindless process can crank away through the eons, generating ever more subtle, efficient, and complex organisms without having the slightest whiff of understanding of what it is doing.

Turing’s idea was a similar — in fact remarkably similar — strange inversion of reasoning. The Pre-Turing world was one in which computers were people, who had to understand mathematics in order to do their jobs. Turing realized that this was just not necessary: you could take the tasks they performed and squeeze out the last tiny smidgens of understanding, leaving nothing but brute, mechanical actions. In order to be a perfect and beautiful computing machine, it is not requisite to know what arithmetic is.

What Darwin and Turing had both discovered, in their different ways, was the existence of competence without comprehension. This inverted the deeply plausible assumption that comprehension is in fact the source of all advanced competence. Why, after all, do we insist on sending our children to school, and why do we frown on the old-fashioned methods of rote learning? We expect our children’s growing competence to flow from their growing comprehension. The motto of modern education might be: “Comprehend in order to be competent.” For us members of H. sapiens, this is almost always the right way to look at, and strive for, competence. I suspect that this much-loved principle of education is one of the primary motivators of skepticism about both evolution and its cousin in Turing’s world, artificial intelligence. The very idea that mindless mechanicity can generate human-level — or divine level! — competence strikes many as philistine, repugnant, an insult to our minds, and the mind of God.
….

“…competence without comprehension….” I rather like that!

Is that what we are observing in crowd-sourcing?

The essay is well worth your time and consideration.

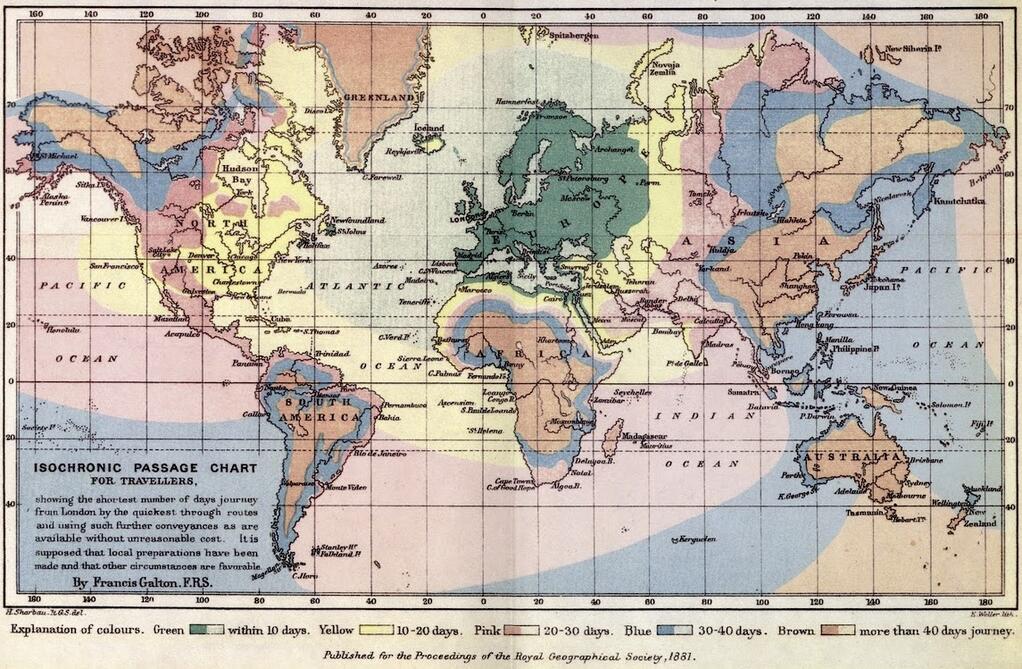
Isochronic Passage Chart for Travelers

Filed under: Mapping,MARC,Visualization — Patrick Durusau @ 4:10 pm

isochronic map

From the blog of Arthur Charpentier, Somewhere Else, part 142

(departing from London, ht http://mapsontheweb.zoom-maps.com/ ) by Francis Galton, 1881

A much larger image that is easier to read.

Although not on such a grand scale, an isochronic passage map for data could be interesting for your enterprise.

How much time does elapse from your request until a response from another department or team?

Presented visually, with this map as a reference for the technique, your evidence of data bottlenecks could be persuasive!

The Reemergence of Datalog

Filed under: Datalog,Query Language — Patrick Durusau @ 3:55 pm

The Reemergence of Datalog by Michael Fogus.

Not all “old” ideas in CS are out dated by any means. Michael gives a brief history of Datalog and then describes current usage in Datalog, Cascalog and the Bacwn Clojure library.

Notes from the presentation.

I first saw this in Nat Torkington’s Four short links: 24 June 2014.

UbiGraph WARNING: Out Dated Software

Filed under: Graphs,Neo4j — Patrick Durusau @ 3:45 pm

Rendering a Neo4j Database in UbiGraph by Michael Hunger.

Michael covers loading and visualizing data with UbiGraph.

The UbiGraph pages document UbiGraph alpha-0.2.4 and it dates from June 2008. That build is targeted at Ubuntu 8.04 x86_64.

Without the source code, I’m not sure you need to spend a lot of effort on UbiGraph.

The year 2008 was what, twenty web-years ago?

Congress.gov Adds New Features

Filed under: Government,Government Data — Patrick Durusau @ 3:26 pm

Congress.gov Adds New Features

From the post:

  • User Accounts & Saved Searches: Users have the option of creating a private account that lets them save their personal searches. The feature gives users a quick and easy index from which to re-run their searches for new and updated information.
  • Congressional Record Search-by-Speaker: New metadata has been added to the Congressional Record that enables searching the daily transcript of congressional floor action by member name from 2009 – present. The member profile pages now also feature a link that returns a list of all Congressional Record articles in which that member was speaking.
  • Nominations: Users can track presidential nominees from appointment to hearing to floor votes with the new nominations function. The data goes back to 1981 and features faceted search, like the rest of Congress.gov, so users can narrow their searches by congressional session, type of nomination and status.

Other updates include expanded “About” and “Frequently Asked Questions” sections and the addition of committee referral and committee reports to bill-search results.

The Congress.gov website describes itself as:

Congress.gov is the official source for federal legislative information. A collaboration among the Library of Congress, the U.S. Senate, the U.S. House of Representatives and the Government Printing Office, Congress.gov is a free resource that provides searchable access to bill status and summary, bill text, member profiles, the Congressional Record, committee reports, direct links from bills to cost estimates from the Congressional Budget Office, legislative process videos, committee profile pages and historic access reaching back to the 103rd Congress.

Before you get too excited, the 103rd Congress was in session 1993-1994. A considerable amount of material but far from complete.

The utility of topic maps is easy to demonstrate with the increased easy of tracking presidential nominations.

Rather than just tracking a bald nomination, wouldn’t it be handy to have all the political donations made by the nominee from the FEC? Or for that matter, their “friend” graph that shows their relationships with members of the president’s insider group?

All of that is easy enough to find, but then every searcher has to find the same information. If it were found and presented with the nominee, then other users would not have to work to re-find the information.

Yes?

http://www.congress.gov/

I first saw this in New Features Added to Congress.gov by Africa S. Hands.

Virtual Workshop and Challenge (NASA)

Open NASA Earth Exchange (NEX) Virtual Workshop and Challenge 2014

From the webpage:

President Obama has announced a series of executive actions to reduce carbon pollution and promote sound science to understand and manage climate impacts for the U.S.

Following the President’s call for developing tools for climate resilience, OpenNEX is hosting a workshop that will feature:

  1. Climate science through lectures by experts
  2. Computational tools through virtual labs, and
  3. A challenge inviting participants to compete for prizes by designing and implementing solutions for climate resilience.

Whether you win any of the $60K in prize money or not, this looks like a great way to learn about climate data, approaches to processing climate data and the Amazon cloud all at one time!

Processing in the virtual labs is on the OpenNEX (Open NASA Earth Exchange) nickel. You can experience cloud computing without fear of the bill for computing services. Gain valuable cloud experience and possibly make a contribution to climate science.

Enjoy!

Older Posts »

Powered by WordPress