Another Word For It Patrick Durusau on Topic Maps and Semantic Diversity

December 26, 2017

Geocomputation with R – Open Book in Progress – Contribute

Filed under: Geographic Data,Geography,Geospatial Data,R — Patrick Durusau @ 8:57 pm

Geocomputation with R by Robin Lovelace, Jakub Nowosad, Jannes Muenchow.

Welcome to the online home of Geocomputation with R, a forthcoming book with CRC Press.

Development

p>Inspired by bookdown and other open source projects we are developing this book in the open. Why? To encourage contributions, ensure reproducibility and provide access to the material as it evolves.

The book’s development can be divided into four main phases:

  1. Foundations
  2. Basic applications
  3. Geocomputation methods
  4. Advanced applications

Currently the focus is on Part 2, which we aim to be complete by December. New chapters will be added to this website as the project progresses, hosted at geocompr.robinlovelace.net and kept up-to-date thanks to Travis….

Speaking of R and geocomputation, I’ve been trying to remember to post about Geocomputation with R since I encountered it a week or more ago. Not what I expect from CRC Press. That got my attention right away!

Part II, Basic Applications has two chapters, 7 Location analysis and 8 Transport applications.

Layering display of data from different sources should be included under Basic Applications. For example, relying on but not displaying topographic data to calculate line of sight between positions. Perhaps the base display is a high-resolution image overlaid with GPS coordinates at intervals and structures have the line of site colored on their structures.

Other “basic applications” you would suggest?

Looking forward to progress on this volume!

All targets have spatial-temporal locations.

Filed under: Geographic Data,Geography,Geophysical,Geospatial Data,R,Spatial Data — Patrick Durusau @ 5:29 pm

r-spatial

From the about page:

r-spatial.org is a website and blog for those interested in using R to analyse spatial or spatio-temporal data.

Posts in the last six months to whet your appetite for this blog:

The budget of a government for spatial-temporal software is no indicator of skill with spatial and spatial-temporal data.

How are yours?

October 26, 2017

2nd International Electronic Conference on Remote Sensing – March 22 – April 5, 2018

2nd International Electronic Conference on Remote Sensing

From the webpage:

We are very pleased to announce that the 2nd International Electronic Conference on Remote Sensing (ECRS-2) will be held online, between 22 March and 5 April 2018.

Today, remote sensing is already recognised as an important tool for monitoring our planet and assessing the state of our environment. By providing a wealth of information that is used to make sound decisions on key issues for humanity such as climate change, natural resource monitoring and disaster management, it changes our world and affects the way we think.

Nevertheless, it is very inspirational that we continue to witness a constant growth of amazing new applications, products and services in different fields (e.g. archaeology, agriculture, forestry, environment, climate change, natural and anthropogenic hazards, weather, geology, biodiversity, coasts and oceans, topographic mapping, national security, humanitarian aid) which are based on the use of satellite and other remote sensing data. This growth can be attributed to the following: large number (larger than ever before) of available platforms for data acquisition, new sensors with improved characteristics, progress in computer technology (hardware, software), advanced data analysis techniques, and access to huge volumes of free and commercial remote sensing data and related products.

Following the success of the 1st International Electronic Conference on Remote Sensing (http://sciforum.net/conference/ecrs-1), ECRS-2 aims to cover all recent advances and developments related to this exciting and rapidly changing field, including innovative applications and uses.

We are confident that participants of this unique multidisciplinary event will have the opportunity to get involved in discussions on theoretical and applied aspects of remote sensing that will contribute to shaping the future of this discipline.

ECRS-2 (http://sciforum.net/conference/ecrs-2) is hosted on sciforum, the platform developed by MDPI for organising electronic conferences and discussion groups, and is supported by Section Chairs and a Scientific Committee comprised of highly reputable experts from academia.

It should be noted that there is no cost for active participation and attendance of this virtual conference. Experts from different parts of the world are encouraged to submit their work and take the exceptional opportunity to present it to the remote sensing community.

I have a less generous view of remote sensing, seeing it used to further exploit/degrade the environment, manipulate regulatory processes, and to generally disadvantage those not skilled in its use.

Being aware of the latest developments in remote sensing is a first step towards developing your ability to question, defend and even use remote sensing data for your own ends.

ECRS-2 (http://sciforum.net/conference/ecrs-2) is a great opportunity to educate yourself about remote sensing. Enjoy!

While electronic conferences lack the social immediacy of physical gatherings, one wonders why more data technologies aren’t holding electronic conferences? Thoughts?

September 26, 2017

MODIS Global Land Cover

Filed under: Geography,Geospatial Data,Maps — Patrick Durusau @ 1:11 pm

MODIS Global Land Cover is part of a collection I discovered at: 12 Sources to Download FREE Land Cover and Land Use Data. To use that collection you have to wade through pages of ads.

I am covering the sources separately and including their original descriptions.

From the webpage:

New NASA land cover maps are providing scientists with the most refined global picture ever produced of the distribution of Earth’s ecosystems and land use patterns. High-quality land cover maps aid scientists and policy makers involved in natural resource management and a range of research and global monitoring objectives.

The land cover maps were developed at Boston University in Boston, MA., using data from the Moderate Resolution Imaging Spectroradiometer (MODIS) instrument on NASA’s Terra satellite. The maps are based on a digital database of Earth images collected between November 2000 and October 2001.

“These maps, with spatial resolution of 1 kilometer (.6 mile), mark a significant step forward in global land cover mapping by providing a clearer, more detailed picture than previously available maps,” says Mark Friedl, one of the project’s investigators.

The MODIS sensor’s vantage point of a given location on Earth changes with each orbit of the satellite. An important breakthrough for these maps is the merging of those multiple looks into a single image. In addition, advances in remote sensing technology allow MODIS to collect higher-quality data than previous sensors. Improvements in data processing techniques have allowed the team to automate much of the classification, reducing the time to generate maps from months or years to about one week.

Each MODIS land cover map contains 17 different land cover types, including eleven natural vegetation types such as deciduous and evergreen forests, savannas, and wetlands. Agricultural land use and land surfaces with little or no plant cover—such as bare ground, urban areas and permanent snow and ice—are also depicted on the maps. Important uses include managing forest resources, improving estimates of the Earth’s water and energy cycles, and modeling climate and global carbon exchange among land, life, and the atmosphere.

Carbon cycle modeling is linked to greenhouse gas inventories—estimates of greenhouse emissions from human sources, and their removal by greenhouse gas sinks, such as plants that absorb and store carbon dioxide through photosynthesis. Many nations, including the United States, produce the inventories annually in an effort to understand and predict climate change.

“This product will have a major impact on our carbon budget work,” says Professor Steve Running of the University of Montana, Missoula, who uses the Boston University land cover maps in conjunction with other weekly observations from MODIS. “With the MODIS land cover product we can determine current vegetation in detail for each square kilometer; for example, whether there is mature vegetation, clear cutting, a new fire scar, or agricultural crops. This means we can produce annual estimates of net change in vegetation cover. This gets us one step closer to a global picture of carbon sources and sinks.”

This first map is an important milestone, but the land cover mapping group in Boston has other projects in progress. “With data collected over several years,” says Friedl, “we will be able to create maps that highlight global-scale changes in vegetation and land cover in response to climate change, such as drought. We’ll also be establishing the timing of seasonal changes in vegetation, defining when important transitions take place, such as the onset of the growing season.”

Launched December 18, 1999, Terra is the flagship of the Earth Observing System series of satellites and is a central part of NASA’s Earth Science Enterprise. The mission of the Earth Science Enterprise is to develop a scientific understanding of the Earth system and its response to natural and human-induced changes to enable improved prediction capability for climate, weather, and natural hazards.

Not recent data but depending upon your needs it is both a historical snapshot and a benchmark of then current technology.

Enjoy!

September 15, 2017

Landsat Viewer

Filed under: Geographic Data,Geophysical,Geospatial Data,Image Processing,Mapping,Maps — Patrick Durusau @ 10:32 am

Landsat Viewer by rcarmichael-esristaff.

From the post:

Landsat Viewer Demonstration

The lab has just completed an experimental viewer designed to sort, filter and extract individual Landsat scenes. The viewer is a web application developed using Esri‘s JavaScript API and a three.js-based external renderer.


Click here for the live application.

Click here for the source code.


The application has a wizard-like workflow. First, the user is prompted to sketch a bounding box representation the area of interest. The next step defines the imagery source and minimum selection criteria for the image scenes. For example, in the screenshot below the user is interested in any scene taken over the past 45+ years but those scenes must have 10% or less cloud cover.


Other Landsat resources:

Landsat homepage

Landsat FAQ

Landsat 7 Science Data Users Handbook

Landsat 8 Science Data Users Handbook

Enjoy!

I first saw this at: Landsat satellite imagery browser by Nathan Yau.

July 12, 2017

DigitalGlobe Platform

Filed under: Geospatial Data,GIS,Maps — Patrick Durusau @ 8:04 pm

DigitalGlobe Platform

The Maps API offers:

Recent Imagery

A curated satellite imagery layer of the entire globe. More than 80% of the Earth’s landmass is covered with high-resolution (30 cm-60 cm) imagery, supplemented with cloud-free LandSat 8 as a backdrop.

Street Map

An accurate, seamless street reference map. Based on contributions from the OpenStreetMap community, this layer combines global coverage with essential “locals only” perspectives.

Terrain Map

A seamless, visually appealing terrain perspective of the planet. Shaded terrain with contours guide you through the landscape, and OpenStreetMap reference vectors provide complete locational context.

Prices start at $5/month and go up. (5,000 map views for $5.)

BTW, 30 cm is 11.811 inches, just a little less than a foot.

For planning constructive or disruptive activities, that should be sufficient precision.

I haven’t tried the service personally but the resolution of the imagery compels me to mention it.

Enjoy!

August 26, 2016

Restricted U.S. Army Geospatial Intelligence Handbook

Restricted U.S. Army Geospatial Intelligence Handbook

From the webpage:

This training circular provides GEOINT guidance for commanders, staffs, trainers, engineers, and military intelligence personnel at all echelons. It forms the foundation for GEOINT doctrine development. It also serves as a reference for personnel who are developing doctrine; tactics, techniques, and procedures; materiel and force structure; and institutional and unit training for intelligence operations.

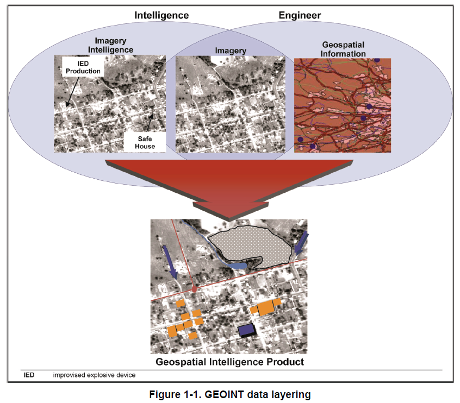
1-1. Geospatial intelligence is the exploitation and analysis of imagery and geospatial information to describe, assess, and visually depict physical features and geographically referenced activities on the Earth. Geospatial intelligence consists of imagery, imagery intelligence, and geospatial information (10 USC 467).

Note. TC 2-22.7 further implements that GEOINT consists of any one or any combination of the following components: imagery, IMINT, or GI&S.

1-2. Imagery is the likeness or presentation of any natural or manmade feature or related object or activity, and the positional data acquired at the same time the likeness or representation was acquired, including: products produced by space-based national intelligence reconnaissance systems; and likenesses and presentations produced by satellites, aircraft platforms, unmanned aircraft vehicles, or other similar means (except that such term does not include handheld or clandestine photography taken by or on behalf of human intelligence collection organizations) (10 USC 467).

1-3. Imagery intelligence is the technical, geographic, and intelligence information derived through the interpretation or analysis of imagery and collateral materials (10 USC 467).

1-4. Geospatial information and services refers to information that identifies the geographic location and characteristics of natural or constructed features and boundaries on the Earth, including: statistical data and information derived from, among other things, remote sensing, mapping, and surveying technologies; and mapping, charting, geodetic data, and related products (10 USC 467).

geospatial-intel-1-460

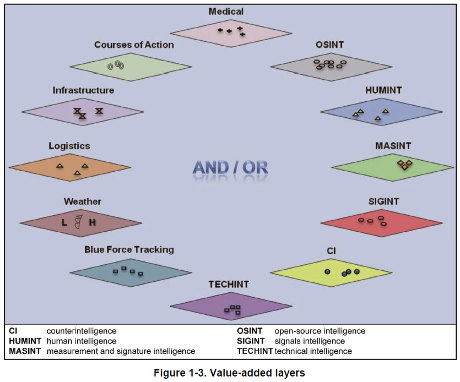
You may not have the large fixed-wing assets described in this handbook, the “value-added layers” are within your reach with open data.

geospatial-intel-2-460

In localized environments, your value-added layers may be more current and useful than those produced on longer time scales.

Topic maps can support geospatial collations of information along side other views of the same data.

A great opportunity to understand how a modern military force understands and uses geospatial intelligence.

Not to mention testing your ability to recreate that geospatial intelligence without dedicated tools.

August 23, 2016

Spatial Module in OrientDB 2.2

Filed under: Geographic Data,Geography,Geospatial Data,GIS,Mapping,Maps,OrientDB — Patrick Durusau @ 2:51 pm

Spatial Module in OrientDB 2.2

From the post:

In versions prior to 2.2, OrientDB had minimal support for storing and retrieving GeoSpatial data. The support was limited to a pair of coordinates (latitude, longitude) stored as double in an OrientDB class, with the possibility to create a spatial index against those 2 coordinates in order to speed up a geo spatial query. So the support was limited to Point.
In OrientDB v.2.2 we created a brand new Spatial Module with support for different types of Geometry objects stored as embedded objects in a user defined class

  • Point (OPoint)
  • Line (OLine)
  • Polygon (OPolygon)
  • MultiPoint (OMultiPoint)
  • MultiLine (OMultiline)
  • MultiPolygon (OMultiPlygon)
  • Geometry Collections

Along with those data types, the module extends OrientDB SQL with a subset of SQL-MM functions in order to support spatial data.The module only supports EPSG:4326 as Spatial Reference System. This blog post is an introduction to the OrientDB spatial Module, with some examples of its new capabilities. You can find the installation guide here.

Let’s start by loading some data into OrientDB. The dataset is about points of interest in Italy taken from here. Since the format is ShapeFile we used QGis to export the dataset in CSV format (geometry format in WKT) and import the CSV into OrientDB with the ETL in the class Points and the type geometry field is OPoint.

The enhanced spatial functions for OrientDB 2.2 reminded me of this passage in “Silences and Secrecy: The Hidden Agenda of Cartography in Early Modern Europe:”

Some of the most clear-cut cases of an increasing state concern with control and restriction of map knowledge are associated with military or strategic considerations. In Europe in the sixteenth and seventeenth centuries hardly a year passed without some war being fought. Maps were an object of military intelligence; statesmen and princes collected maps to plan, or, later, to commemorate battles; military textbooks advocated the use of maps. Strategic reasons for keeping map knowledge a secret included the need for confidentiality about the offensive and defensive operations of state armies, the wish to disguise the thrust of external colonization, and the need to stifle opposition within domestic populations when developing administrative and judicial systems as well as the more obvious need to conceal detailed knowledge about fortifications. (reprinted in: The New Nature of Maps: Essays in the History of Cartography, by J.B. Harley: Paul Laxton, John Hopkins, 2001. page 89)

I say “reminded me,” better to say increased my puzzling over the widespread access to geographic data that once upon a time had military value.

Is it the case that “ordinary maps,” maps of streets, restaurants, hotels, etc., aren’t normally imbued (merged?) with enough other information to make them “dangerous?”

If that’s true, the lack of commonly available “dangerous maps” is a disadvantage to emergency and security planners.

You can’t plan for the unknown.

Or to paraphrase Dibert: “Ignorance is not a reliable planning guide.”

How would you cure the ignorance of “ordinary” maps?

PS: While hunting for the quote, I ran across The Power of Maps by Denis Wood; with John Fels. Which has been up-dated: Rethinking the power of maps by Denis Wood; with John Fels and John Krygier. I am now re-reading the first edition and awaiting for the updated version to arrive.

Neither book is a guide to making “dangerous” maps but may awaken in you a sense of the power of maps and map making.

March 25, 2016

Dodging the Morality Police

Filed under: Geography,Georeferencing,Geospatial Data,Mapping — Patrick Durusau @ 7:54 am

This location-based app helps young Iranians avoid ‘morality police’ by Aleks Buczkowski.

From the post:

Many young Iranians are pretty liberated guys. They like to party and wear fancy clothes but they happened to live in a country where it’s prohibited. There is special police force dedicated to ensuring Iranians follow strict rules on clothing and conduct, called the Gasht-e-Ershad (or Guidance Patrol, commonly known as the “morality police”). Part of their activities include setting up checkpoints around cities and randomly inspecting vehicles driving by.

Now there is a way to avoid the Ershad controls. An anonymous team of Iranian developers have come up with a crowdsource app that allow users marking risky spots on the city map to help others avoid it. Something like Waze but for a much different purpose.

The Gershad app is pretty simple and easy to use. Users can mark where they encounter the “morality police”. The data is added to a database and visualised on a map. The more reports in one place, the bolder the warning on the map. When the number decreases, the alert will fade gradually from the map. Simple as it is.

Sounds quite adaptable to tracking police, FBI agents, narcs, etc. in modern urban environments.

Over time, with enough reports, patterns for police patrols would emerge from the data.

Enjoy!

October 16, 2015

Planet Platform Beta & Open California:…

Planet Platform Beta & Open California: Our Data, Your Creativity by Will Marshall.

From the post:

At Planet Labs, we believe that broad coverage frequent imagery of the Earth can be a significant tool to address some of the world’s challenges. But this can only happen if we democratise access to it. Put another way, we have to make data easy to access, use, and buy. That’s why I recently announced at the United Nations that Planet Labs will provide imagery in support of projects to advance the Sustainable Development Goals.

Today I am proud to announce that we’re releasing a beta version of the Planet Platform, along with our imagery of the state of California under an open license.

The Planet Platform Beta will enable a pioneering cohort of developers, image analysts, researchers, and humanitarian organizations to get access to our data, web-based tools and APIs. The goal is to provide a “sandbox” for people to start developing and testing their apps on a stack of openly available imagery, with the goal of jump-starting a developer community; and collecting data feedback on Planet’s data, tools, and platform.

Our Open California release includes two years of archival imagery of the whole state of California from our RapidEye satellites and 2 months of data from the Dove satellite archive; and will include new data collected from both constellations on an ongoing basis, with a two-week delay. The data will be under an open license, specifically CC BY-SA 4.0. The spirit of the license is to encourage R&D and experimentation in an “open data” context. Practically, this means you can do anything you want, but you must “open” your work, just as we are opening ours. It will enable the community to discuss their experiments and applications openly, and thus, we hope, establish the early foundation of a new geospatial ecosystem.

California is our first Open Region, but shall not be the last. We will open more of our data in the future. This initial release will inform how we deliver our data set to a global community of customers.

Resolution for the Dove satellites is 3-5 meters and the RapidEye satellites is 5 meters.

Not quite goldfish bowl or Venice Beach resolution but useful for other purposes.

Now would be a good time to become familiar with managing and annotating satellite imagery. Higher resolutions, public and private are only a matter of time.

August 31, 2015

Rendering big geodata on the fly with GeoJSON-VT

Filed under: Geospatial Data,MapBox,Topic Maps,Visualization — Patrick Durusau @ 8:33 pm

Rendering big geodata on the fly with GeoJSON-VT by Vladimir Agafonkin.

From the post:

Despite the amazing advancements of computing technologies in recent years, processing and displaying large amounts of data dynamically is still a daunting, complex task. However, a smart approach with a good algorithmic foundation can enable things that were considered impossible before.

Let’s see if Mapbox GL JS can handle loading a 106 MB GeoJSON dataset of US ZIP code areas with 33,000+ features shaped by 5.4+ million points directly in the browser (without server support):

An observation from the post:


It isn’t possible to render such a crazy amount of data in its entirety at 60 frames per second, but luckily, we don’t have to:

  • at lower zoom levels, shapes don’t need to be as detailed
  • at higher zoom levels, a lot of data is off-screen

The best way to optimize the data for all zoom levels and screens is to cut it into vector tiles. Traditionally, this is done on the server, using tools like Mapnik and PostGIS.

Could we create vector tiles on the fly, in the browser? Specifically for this purpose, I wrote a new JavaScript library — geojson-vt.

It turned out to be crazy fast, with its usefulness going way beyond the browser:

In addition to being a great demonstration of the visualization of geodata, I mention this post because it offers insights into the visualization of topic maps.

When you read:

  • at lower zoom levels, shapes don’t need to be as detailed
  • at higher zoom levels, a lot of data is off-screen

What do you think the equivalents would be for topic map navigation?

If we think of “shapes don’t need to be as detailed” for a crime topic map, could it be that all offenders, men, women, various ages, races and religions are lumped into an “offender” topic?

And if we think of “a lot of data is off-screen,” is that when we have narrowed a suspect pool down by gender, age, race, etc.?

Those dimensions would vary by the subject of the topic map and would require considering “merging” as a function of the “zoom” into a set of subjects.

Suggestions?

PS: BTW, do work through the post. For geodata this looks very good.

April 24, 2015

Animation of Gerrymandering?

Filed under: Geographic Data,Geospatial Data,Government,Mapping,Maps — Patrick Durusau @ 1:45 pm

United States Congressional District Shapefiles by Jeffrey B. Lewis, Brandon DeVine, and Lincoln Pritcher with Kenneth C. Martis.

From the description:

This site provides digital boundary definitions for every U.S. Congressional District in use between 1789 and 2012. These were produced as part of NSF grant SBE-SES-0241647 between 2009 and 2013.

The current release of these data is experimental. We have had done a good deal of work to validate all of the shapes. However, it is quite likely that some irregulaties remain. Please email jblewis@ucla.edu with questions or suggestions for improvement. We hope to have a ticketing system for bugs and a versioning system up soon. The district definitions currently available should be considered an initial-release version.

Many districts were formed by aggregragating complete county shapes obtained from the National Historical Geographic Information System (NHGIS) project and the Newberry Library’s Atlas of Historical County Boundaries. Where Congressional district boundaries did not coincide with county boundaries, district shapes were constructed district-by-district using a wide variety of legal and cartographic resources. Detailed descriptions of how particular districts were constructed and the authorities upon which we relied are available (at the moment) by request and described below.

Every state districting plan can be viewed quickly at https://github.com/JeffreyBLewis/congressional-district-boundaries (clicking on any of the listed file names will create a map window that can be paned and zoomed). GeoJSON definitions of the districts can also be downloaded from the same URL. Congress-by-Congress district maps in ERSI ShapefileA format can be downloaded below. Though providing somewhat lower resolution than the shapefiles, the GeoJSON files contain additional information about the members who served in each district that the shapefiles do not (Congress member information may be useful for creating web applications with, for example, Google Maps or Leaflet).

Project Team

The Principal Investigator on the project was Jeffrey B. Lewis. Brandon DeVine and Lincoln Pitcher researched district definitions and produced thousands of digital district boundaries. The project relied heavily on Kenneth C. Martis’ The Historical Atlas of United States Congressional Districts: 1789-1983. (New York: The Free Press, 1982). Martis also provided guidance, advice, and source materials used in the project.

How to cite

Jeffrey B. Lewis, Brandon DeVine, Lincoln Pitcher, and Kenneth C. Martis. (2013) Digital Boundary Definitions of United States Congressional Districts, 1789-2012. [Data file and code book]. Retrieved from http://cdmaps.polisci.ucla.edu on [date of
download].

An impressive resource for anyone interested in the history of United States Congressional Districts and their development. An animation of gerrymandering of congressional districts was the first use case that jumped to mind. 😉

Enjoy!

I first saw this in a tweet by Larry Mullen.

March 28, 2015

NewsStand: A New View on News (+ Underwear Down Under)

Filed under: Aggregation,Georeferencing,Geospatial Data,Mapping,Maps,News — Patrick Durusau @ 5:05 pm

NewsStand: A New View on News by Benjamin E. Teitler, et al.

Abstract:

News articles contain a wealth of implicit geographic content that if exposed to readers improves understanding of today’s news. However, most articles are not explicitly geotagged with their geographic content, and few news aggregation systems expose this content to users. A new system named NewsStand is presented that collects, analyzes, and displays news stories in a map interface, thus leveraging on their implicit geographic content. NewsStand monitors RSS feeds from thousands of online news sources and retrieves articles within minutes of publication. It then extracts geographic content from articles using a custom-built geotagger, and groups articles into story clusters using a fast online clustering algorithm. By panning and zooming in NewsStand’s map interface, users can retrieve stories based on both topical signifi cance and geographic region, and see substantially diff erent stories depending on position and zoom level.

Of particular interest to topic map fans:

NewsStand’s geotagger must deal with three problematic cases in disambiguating terms that could be interpreted as locations: geo/non-geo ambiguity, where a given phrase might refer to a geographic location, or some other kind of entity; aliasing, where multiple names refer to the same geographic location, such as “Los Angeles” and “LA”; and geographic name ambiguity or polysemy , where a given name might refer to any of several geographic locations. For example, “Springfield” is the name of many cities in the USA, and thus it is a challenge for disambiguation algorithms to associate with the correct location.

Unless you want to hand disambiguate all geographic references in your sources, this paper merits a close read!

BTW, the paper dates from 2008 and I saw it in a tweet by Kirk Borne, where Kirk pointed to a recent version of NewsStand. Well, sort of “recent.” The latest story I could find was 490 days ago, a tweet from CBS News about the 50th anniversary of the Kennedy assassination in Dallas.

Undaunted I checked out TwitterStand but it seems to suffer from the same staleness of content, albeit it is difficult to tell because links don’t lead to the tweets.

Finally I did try PhotoStand, which judging from the pop-up information on the images, is quite current.

I noticed for Perth, Australia, “A special section of the exhibition has been dedicated to famous dominatrix Madame Lash.”

Sadly this appears to be one the algorithm got incorrect, so members of Congress should not select purchase on their travel arrangements just yet.

Sarah Carty for Daily Mail Australia reports in From modest bloomers to racy corsets: New exhibition uncovers the secret history of women’s underwear… including a unique collection from dominatrix Madam Lash:

From the modesty of bloomers to the seductiveness of lacy corsets, a new exhibition gives us a rare glimpse into the most intimate and private parts of history.

The Powerhouse Museum in Sydney have unveiled their ‘Undressed: 350 Years of Underwear in Fashion’ collection, which features undergarments from the 17th-century to more modern garments worn by celebrities such as Emma Watson, Cindy Crawford and even Queen Victoria.

Apart from a brief stint in Bendigo and Perth, the collection has never been seen by any members of the public before and lead curator Edwina Ehrman believes people will be both shocked and intrigued by what’s on display.

So the collection was once shown in Perth, but for airline reservations you had best book for Sydney.

And no, I won’t leave you without the necessary details:

Undressed: 350 Years of Underwear in Fashion opens at the Powerhouse Museum on March 28 and runs until 12 July 2015. Tickets can be bought here.

Ticket prices do not include transportation expenses to Sydney.

Spoiler alert: The exhibition page says:

Please note that photography is not permitted in this exhibition.

Enjoy!

February 7, 2015

Geojournalism.org

Filed under: Geographic Data,Geography,Geospatial Data,Journalism,Mapping,Maps — Patrick Durusau @ 3:05 pm

Geojournalism.org

From the webpage:

Geojournalism.org provides online resources and training for journalists, designers and developers to dive into the world of data visualization using geographic data.

From the about page:

Geojournalism.org is made for:

Journalists

Reporters, editors and other professionals involved on the noble mission of producing relevant news for their audiences can use Geojournalism.org to produce multimedia stories or simple maps and data visualization to help creating context for complex environmental issues

Developers

Programmers and geeks using a wide variety of languages and tools can drink on the vast knowledge of our contributors. Some of our tutorials explore open source libraries to make maps, infographics or simply deal with large geographical datasets

Designers

Graphic designers and experts on data visualizations find in the Geojournalism.org platform a large amount of resources and tips. They can, for example, improve their knowledge on the right options for coloring maps or how to set up simple charts to depict issues such as deforestation and climate change

It is one thing to have an idea or even a story and quite another to communicate it effectively to a large audience. Geojournalism is designed as a community site that will help you communicate geophysical data to a non-technical audience.

I think it is clear that most governments are shy about accurate and timely communication with their citizens. Are you going to be one of those who fills in the gaps? Geojournalism.org is definitely a site you will be needing.

January 21, 2015

MrGeo (MapReduce Geo)

Filed under: Geo Analytics,Geographic Information Retrieval,Geography,Geospatial Data — Patrick Durusau @ 7:58 pm

MrGeo (MapReduce Geo)

From the webpage:

MrGeo was developed at the National Geospatial-Intelligence Agency (NGA) in collaboration with DigitalGlobe. The government has “unlimited rights” and is releasing this software to increase the impact of government investments by providing developers with the opportunity to take things in new directions. The software use, modification, and distribution rights are stipulated within the Apache 2.0 license.

MrGeo (MapReduce Geo) is a geospatial toolkit designed to provide raster-based geospatial capabilities that can be performed at scale. MrGeo is built upon the Hadoop ecosystem to leverage the storage and processing of hundreds of commodity computers. Functionally, MrGeo stores large raster datasets as a collection of individual tiles stored in Hadoop to enable large-scale data and analytic services. The co-location of data and analytics offers the advantage of minimizing the movement of data in favor of bringing the computation to the data; a more favorable compute method for Geospatial Big Data. This framework has enabled the servicing of terabyte scale raster databases and performed terrain analytics on databases exceeding hundreds of gigabytes in size.

The use cases sound interesting:

Exemplar MrGeo Use Cases:

  • Raster Storage and Provisioning: MrGeo has been used to store, index, tile, and pyramid multi-terabyte scale image databases. Once stored, this data is made available through simple Tiled Map Services (TMS) and or Web Mapping Services (WMS).
  • Large Scale Batch Processing and Serving: MrGeo has been used to pre-compute global 1 ArcSecond (nominally 30 meters) elevation data (300+ GB) into derivative raster products : slope, aspect, relative elevation, terrain shaded relief (collectively terabytes in size)
  • Global Computation of Cost Distance: Given all pub locations in OpenStreetMap, compute 2 hour drive times from each location. The full resolution is 1 ArcSecond (30 meters nominally)
  • I wonder if you started war gaming attacks on well known cities and posting maps on how the attacks could develop if that would be covered under free speech? Assuming your intent was to educate the general populace about areas that are more dangerous than others in case of a major incident.

    I first saw this in a tweet by Marin Dimitrov.

    November 20, 2014

    Geospatial Data in Python

    Filed under: Geographic Data,Geospatial Data,Python — Patrick Durusau @ 2:31 pm

    Geospatial Data in Python by Carson Farmer.

    Materials for the tutorial: Geospatial Data in Python: Database, Desktop, and the Web by Carson Farmer (Associate Director of CARSI lab).

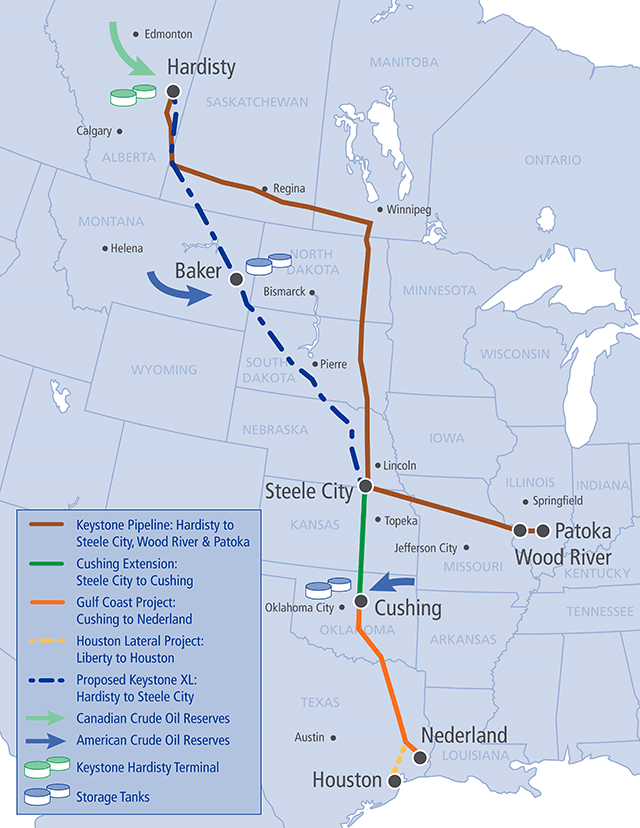
    Important skills if you are concerned about projects such as the Keystone XL Pipeline:

    keystone pipeline route

    This is an instance where having the skills to combine geospatial, archaeological, and other data together will empower local communities to minimize the damage they will suffer from this project.

    Having a background in the processing geophysical data is the first step in that process.

    Powered by WordPress