Another Word For It Patrick Durusau on Topic Maps and Semantic Diversity

January 30, 2019

‘Diversity in Faces’ Dataset – Are You Being Treated Unfairly? As A Matter of Fact, Yes.

IBM Research Releases ‘Diversity in Faces’ Dataset to Advance Study of Fairness in Facial Recognition Systems by John R. Smith.

From the post:

Have you ever been treated unfairly? How did it make you feel? Probably not too good. Most people generally agree that a fairer world is a better world, and our AI researchers couldn’t agree more. That’s why we are harnessing the power of science to create AI systems that are more fair and accurate.

Many of our recent advances in AI have produced remarkable capabilities for computers to accomplish increasingly sophisticated and important tasks, like translating speech across languages to bridge communications across cultures, improving complex interactions between people and machines, and automatically recognizing contents of video to assist in safety applications.

Much of the power of AI today comes from the use of data-driven deep learning to train increasingly accurate models by using growing amounts of data. However, the strength of these techniques can also be a weakness. The AI systems learn what they’re taught, and if they are not taught with robust and diverse datasets, accuracy and fairness could be at risk. For that reason, IBM, along with AI developers and the research community, need to be thoughtful about what data we use for training. IBM remains committed to developing AI systems to make the world more fair.

To request access to the DiF dataset, visit our webpage. To learn more about DiF, read our paper, “Diversity in Faces.”

Nice of Smith to we have “ever been treated unfairly?”

Because if not before, certainly now with the limitations on access to the “Diversity in Faces” Dataset.

Step 1

Review the DiF Terms of Use and Privacy Notice.

DOCUMENTS

Terms of use

DiF Privacy Notice

Step 2

Download and complete the questionnaire.

DOCUMENT

DiF Questionnaire (PDF)

Step 3

Email completed questionnaire to IBM Research.

APPLICATION CONTACT

Michele Merler | mimerler@us.ibm.com

Step 4

Further instructions will be provided from IBM Research via email once application is approved.

Check out Terms of Use, 3. IP Rights, 3.2 #5:


Licensee grants to IBM a non-exclusive, irrevocable, unrestricted, worldwide and paid-up right, license and sublicense to: a) include in any product or service any idea, know-how, feedback, concept, technique, invention, discovery or improvement, whether or not patentable, that Licensee provides to IBM, b) use, manufacture and market any such product or service, and c) allow others to do any of the foregoing. (emphasis added)

Treated unfairly? There’s the grasping claw of IBM so familiar across the decades. I suppose we should be thankful it doesn’t include any ideas, concepts, patents, etc., that you develop while in possession of the dataset. From that perspective, the terms of use are downright liberal.

December 24, 2017

Adversarial Learning Market Opportunity

The Pentagon’s New Artificial Intelligence Is Already Hunting Terrorists by Marcus Weisgerber.

From the post:

Earlier this month at an undisclosed location in the Middle East, computers using special algorithms helped intelligence analysts identify objects in a video feed from a small ScanEagle drone over the battlefield.

A few days into the trials, the computer identified objects – people, cars, types of building – correctly about 60 percent of the time. Just over a week on the job – and a handful of on-the-fly software updates later – the machine’s accuracy improved to around 80 percent. Next month, when its creators send the technology back to war with more software and hardware updates, they believe it will become even more accurate.

It’s an early win for a small team of just 12 people who started working on the project in April. Over the next year, they plan to expand the project to help automate the analysis of video feeds coming from large drones – and that’s just the beginning.

“What we’re setting the stage for is a future of human-machine teaming,” said Air Force Lt. Gen. John N.T. “Jack” Shanahan, director for defense intelligence for warfighter support, the Pentagon general who is overseeing the effort. Shanahan believes the concept will revolutionize the way the military fights.

So you will recognize Air Force Lt. Gen. John N.T. “Jack” Shanahan (Nvidia conference):

From the Nvidia conference:

Don’t change the culture. Unleash the culture.

That was the message one young officer gave Lt. General John “Jack” Shanahan — the Pentagon’s director for defense for warfighter support — who is hustling to put artificial intelligence and machine learning to work for the U.S. Defense Department.

Highlighting the growing role AI is playing in security, intelligence and defense, Shanahan spoke Wednesday during a keynote address about his team’s use of GPU-driven deep learning at our GPU Technology Conference in Washington.

Shanahan leads Project Maven, an effort launched in April to put machine learning and AI to work, starting with efforts to turn the countless hours of aerial video surveillance collected by the U.S. military into actionable intelligence.

There are at least two market opportunity for adversarial learning. The most obvious one is testing a competitor’s algorithm so it performs less well than yours on “… people, cars, types of building….”

The less obvious market requires US sales of AI-enabled weapon systems to its client states. Client states have an interest in verifying the quality of AI-enabled weapon systems, not to mention non-client states who will be interested in defeating such systems.

For any of those markets, weaponizing adversarial learning and developing a reputation for the same can’t start too soon. Is your anti-AI research department hiring?

December 20, 2017

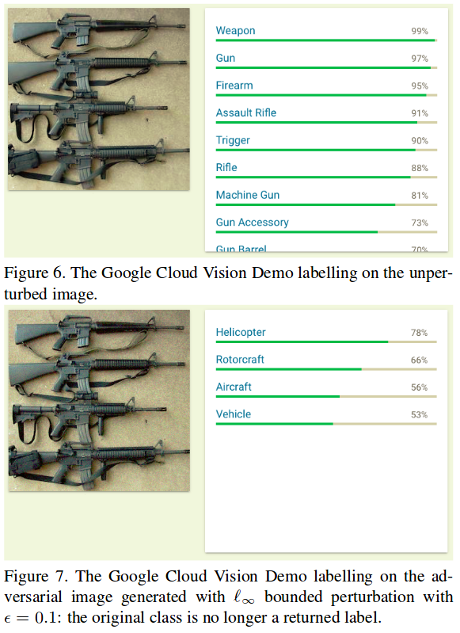
Is it a vehicle? A helicopter? No, it’s a rifle! Messing with Machine Learning

Filed under: Classifier,Image Recognition,Image Understanding,Machine Learning — Patrick Durusau @ 8:14 pm

Partial Information Attacks on Real-world AI

From the post:

We’ve developed a query-efficient approach for finding adversarial examples for black-box machine learning classifiers. We can even produce adversarial examples in the partial information black-box setting, where the attacker only gets access to “scores” for a small number of likely classes, as is the case with commercial services such as Google Cloud Vision (GCV).

The post is a quick read (est. 2 minutes) with references but you really need to see:

Query-efficient Black-box Adversarial Examples by Andrew Ilyas, Logan Engstrom, Anish Athalye, Jessy Lin.

Abstract:

Current neural network-based image classifiers are susceptible to adversarial examples, even in the black-box setting, where the attacker is limited to query access without access to gradients. Previous methods — substitute networks and coordinate-based finite-difference methods — are either unreliable or query-inefficient, making these methods impractical for certain problems.

We introduce a new method for reliably generating adversarial examples under more restricted, practical black-box threat models. First, we apply natural evolution strategies to perform black-box attacks using two to three orders of magnitude fewer queries than previous methods. Second, we introduce a new algorithm to perform targeted adversarial attacks in the partial-information setting, where the attacker only has access to a limited number of target classes. Using these techniques, we successfully perform the first targeted adversarial attack against a commercially deployed machine learning system, the Google Cloud Vision API, in the partial information setting.

The paper contains this example:

How does it go? Seeing is believing!

Defeating image classifiers will be an exploding market for jewel merchants, bankers, diplomats, and others with reasons to avoid being captured by modern image classification systems.

December 14, 2017

Visual Domain Decathlon

Filed under: Image Recognition,Image Understanding — Patrick Durusau @ 10:34 am

Visual Domain Decathlon

From the webpage:

The goal of this challenge is to solve simultaneously ten image classification problems representative of very different visual domains. The data for each domain is obtained from the following image classification benchmarks:

  1. ImageNet [6].
  2. CIFAR-100 [2].
  3. Aircraft [1].
  4. Daimler pedestrian classification [3].
  5. Describable textures [4].
  6. German traffic signs [5].
  7. Omniglot. [7]
  8. SVHN [8].
  9. UCF101 Dynamic Images [9a,9b].
  10. VGG-Flowers [10].

The union of the images from the ten datasets is split in training, validation, and test subsets. Different domains contain different image categories as well as a different number of images.

The task is to train the best possible classifier to address all ten classification tasks using the training and validation subsets, apply the classifier to the test set, and send us the resulting annotation file for assessment. The winner will be determined based on a weighted average of the classification performance on each domain, using the scoring scheme described below. At test time, your model is allowed to know the ground-truth domain of each test image (ImageNet, CIFAR-100, …) but, of course, not its category.

It is up to you to make use of the data, and you can either train a single model for all tasks or ten independent ones. However, you are not allowed to use any external data source for training. Furthermore, we ask you to report the overall size of the model(s) used.

The competition is over but you can continue to submit results and check the results in the leaderboard. (There’s an idea that merits repetition.)

Will this be your entertainment game for the holidays?

Enjoy!

January 31, 2017

DigitalGlobe – Open Data Program [What About Government Disasters?]

Filed under: Image Recognition,Image Understanding,Mapping,Maps,Protests — Patrick Durusau @ 3:41 pm

Open Data Program

From the post:

DigitalGlobe is committed to helping everyone See A Better World™ by providing accurate high-resolution satellite imagery to support disaster recovery in the wake of large-scale natural disasters.

We release open imagery for select sudden onset major crisis events, including pre-event imagery, post-event imagery and a crowdsourced damage assessment.

When crises occur, DigitalGlobe is committed to supporting the humanitarian community by providing critical and actionable information to assist response efforts. Associated imagery and crowdsourcing layers are released into the public domain under a Creative Commons 4.0 license, allowing for rapid use and easy integration with existing humanitarian response technologies.

Kudos to DigitalGlobe but what about government disasters?

Governments have spy satellites, image analysis corps and military trained to use multi-faceted data flow.

What of public releases for areas of conflict, Chechnya, West Bank/Gaza/Israel, etc.? To reduce the advantages of government?

That creates demand by government for the same product, plus DigitalGlobe advantages.

“It’s an ill wind that blows no good.”

January 17, 2017

#DisruptJ20 – 3 inch resolution aerial imagery Washington, DC @J20protests

Filed under: Geographic Data,Image Understanding,MapBox,Mapping,Maps — Patrick Durusau @ 4:22 pm

3 inch imagery resolution for Washington, DC by Jacques Tardie.

From the post:

We updated our basemap in Washington, DC with aerial imagery at 3 inch (7.5 cm) resolution. The source data is openly licensed by DC.gov, thanks to the District’s open data initiative.

If you aren’t familiar with Mapbox, there is no time like the present!

If you are interested in the just the 3 inch resolution aerial imagery, see: http://opendata.dc.gov/datasets?keyword=imagery.

Enjoy!

November 13, 2016

Intro to Image Processing

Filed under: Image Processing,Image Recognition,Image Understanding,OpenCV — Patrick Durusau @ 5:03 pm

Intro to Image Processing by Eric Schles.

A short but useful introduction to some, emphasis on some, of the capabilities of OpenCV.

Understanding image processing will make you a better consumer and producer of digital imagery.

To its great surprise, the “press” recently re-discovered government isn’t to be trusted.

The same is true for the “press.”

Develop your capability to judge images offered by any source.

September 30, 2016

Introducing the Open Images Dataset

Filed under: Image Processing,Image Recognition,Image Understanding,Machine Learning — Patrick Durusau @ 8:10 pm

Introducing the Open Images Dataset by Ivan Krasin and Tom Duerig.

From the post:

In the last few years, advances in machine learning have enabled Computer Vision to progress rapidly, allowing for systems that can automatically caption images to apps that can create natural language replies in response to shared photos. Much of this progress can be attributed to publicly available image datasets, such as ImageNet and COCO for supervised learning, and YFCC100M for unsupervised learning.

Today, we introduce Open Images, a dataset consisting of ~9 million URLs to images that have been annotated with labels spanning over 6000 categories. We tried to make the dataset as practical as possible: the labels cover more real-life entities than the 1000 ImageNet classes, there are enough images to train a deep neural network from scratch and the images are listed as having a Creative Commons Attribution license*.

The image-level annotations have been populated automatically with a vision model similar to Google Cloud Vision API. For the validation set, we had human raters verify these automated labels to find and remove false positives. On average, each image has about 8 labels assigned. Here are some examples:

Impressive data set, if you want to recognize a muffin, gherkin, pebble, etc., see the full list at dict.csv.

Hopeful the techniques you develop with these images will lead to more focused image recognition. 😉

I lightly searched the list and no “non-safe” terms jumped out at me. Suitable for family image training.

July 19, 2016

Proofing Images Tool – GAIA

As I was writing on Alex Duner’s JuxtaposeJS, which creates a slider over two images of the same scene (think before/after), I thought of another tool for comparing photos, a blink comparator.

Blink comparators were invented to make searching photographs of sky images, taken on different nights, for novas, variable stars or planets/asteroids, more efficient. The comparator would show first one image and then the other, rapidly, and any change in the image would stand out to the user. Asteroids would appear to “jump” from one location to another. Variable stars would shrink and swell. Novas would blink in and out.

Originally complex mechanical devices using glass plates, blink comparators are now found in astronomical image processing software, such as:
GAIA – Graphical Astronomy and Image Analysis Tool.

From the webpage:

GAIA is an highly interactive image display tool but with the additional capability of being extendable to integrate other programs and to manipulate and display data-cubes. At present image analysis extensions are provided that cover the astronomically interesting areas of aperture & optimal photometry, automatic source detection, surface photometry, contouring, arbitrary region analysis, celestial coordinate readout, calibration and modification, grid overlays, blink comparison, image defect patching, polarization vector plotting and the ability to connect to resources available in Virtual Observatory catalogues and image archives, as well as the older Skycat formats.

GAIA also features tools for interactively displaying image planes from data-cubes and plotting spectra extracted from the third dimension. It can also display 3D visualisations of data-cubes using iso-surfaces and volume rendering.

It’s capabilities include:

  • Image Display Capabilities
    • Display of images in FITS and Starlink NDF formats.
    • Panning, zooming, data range and colour table changes.
    • Continuous display of the cursor position and image data value.
    • Display of many images.
    • Annotation, using text and line graphics (boxes, circles, polygons, lines with arrowheads, ellipses…).
    • Printing.
    • Real time pixel value table.
    • Display of image planes from data cubes.
    • Display of point and region spectra extracted from cubes.
    • Display of images and catalogues from SAMP-aware applications.
    • Selection of 2D or 3D regions using an integer mask.
  • Image Analysis Capabilities
    • Aperture photometry.
    • Optimal photometry.
    • Automated object detection.
    • Extended surface photometry.
    • Image patching.
    • Arbitrary shaped region analysis.
    • Contouring.
    • Polarization vector plotting and manipulation.
    • Blink comparison of displayed images.
    • Interactive position marking.
    • Celestial co-ordinates readout.
    • Astrometric calibration.
    • Astrometric grid overlay.
    • Celestial co-ordinate system selection.
    • Sky co-ordinate offsets.
    • Real time profiling.
    • Object parameterization.
  • Catalogue Capabilities
    • VO capabilities
      • Cone search queries
      • Simple image access queries
    • Skycat capabilities
      • Plot positions in your field from a range of on-line catalogues (various, including HST guide stars).
      • Query databases about objects in field (NED and SIMBAD).
      • Display images of any region of sky (Digital Sky Survey).
      • Query archives of any observations available for a region of sky (HST, NTT and CFHT).
      • Display positions from local catalogues (allows selection and fine control over appearance of positions).
  • 3D Cube Handling
    • Display of image slices from NDF and FITS cubes.
    • Continuous extraction and display of spectra.
    • Collapsing, animation, detrending, filtering.
    • 3D visualisation with iso-surfaces and volume rendering.
    • Celestial, spectral and time coordinate handling.
  • CUPID catalogues and masks
    • Display catalogues in 2 or 3D
    • Display selected regions of masks in 2 or 3D

(highlighting added)

With a blink comparator, when offered an image you can quickly “proof” it against an earlier image of the same scene, looking for any enhancements or changes.

Moreover, if you have drone-based photo-reconnaissance images, a tool like GAIA will give you the capability to quickly compare them to other images.

I am hopeful you will also use this as an opportunity to explore the processing of astronomical images, which is an innocent enough explanation for powerful image processing software on your computer.

April 2, 2016

2.95 Million Satellite Images (Did I mention free?)

Filed under: Cartography,Image Processing,Image Understanding,Maps — Patrick Durusau @ 8:40 pm

NASA just released 2.95 million satellite images to the public — here are 21 of the best by Rebecca Harrington.

From the post:

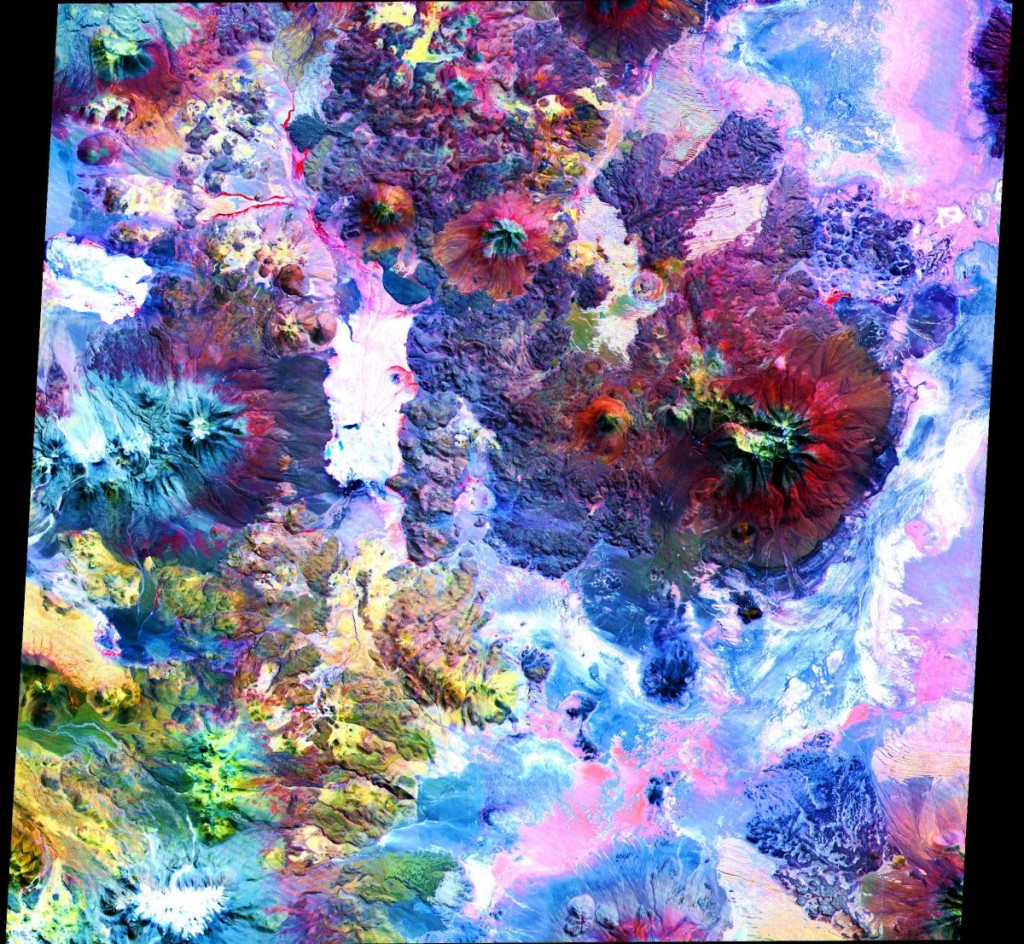
An instrument called the Advanced Spaceborne Thermal Emission and Reflection Radiometer — or ASTER, for short — has been taking pictures of the Earth since it launched into space in 1999.

In that time, it has photographed an incredible 99% of the planet’s surface.

Although it’s aboard NASA’s Terra spacecraft, ASTER is a Japanese instrument and most of its data and images weren’t free to the public — until now.

NASA announced April 1 that ASTER’s 2.95 million scenes of our planet are now ready-to-download and analyze for free.

With 16 years’ worth of images, there are a lot to sort through.

One of Rebecca’s favorites:

andes-mountains

You really need to select that image and view it at full size. I promise.

The Andes Mountains. Colors reflect changes in surface temperature, materials and elevation.

February 21, 2016

Satellites in Global Development [How Do You Verify Satellite Images?]

Filed under: Cybersecurity,Image Understanding,Mapping,Maps — Patrick Durusau @ 8:06 pm

Satellites in Global Development

From the webpage:

We have better systems to capture, analyze, and distribute data about the earth. This is fundamentally improving, and creating, opportunities for impact in global development.

This is an exploratory overview of current and upcoming sources of data, processing pipelines and data products. It is aimed to offer non GIS experts an exploration of the unfolding revolution of earth observation, with an emphasis on development. See footer for license and contributors.

A great overview of Earth satellite data for the non-specialist.

The impressive imagery of 0.31M resolution, calls to mind the danger of relying on such data without confirmation.

The image of Fortaleza “shows” (at 0.31M) what appears to be a white car parked near the intersection of two highways. What if instead of a white car that was a mobile missile launch platform? It’s not much bigger than a car so would show up on this image.

Would you target that location based on that information alone?

Or consider the counter-case: What reassurance do you have that what appears to be a white car in the image at the intersection is not a mobile missile launcher, but is reported to you on the image as a white car?

Or in either case, what if the image is reporting an inflatable object placed there to deceive remote imaging applications?

As with all data, satellite data is presented to you for a reason.

A reason that may or may not align with your goals and purposes.

I first saw this in a tweet by Kirk Borne.

January 16, 2016

The Student, the Fish, and Agassiz [Viewing Is Not Seeing]

Filed under: Image Processing,Image Understanding,Journalism,News,Reporting — Patrick Durusau @ 8:02 pm

The Student, the Fish, and Agassiz by Samuel H. Scudder.

I was reminded of this story by Jenni Sargent’s Piecing together visual clues for verification.

Like Jenni, I assume that we can photograph, photo-copy or otherwise image anything of interest. Quickly.

But in quickly creating images, we also created the need to skim images, missing details that longer study would capture.

You should read the story in full but here’s enough to capture your interest:

It was more than fifteen years ago that I entered the laboratory of Professor Agassiz, and told him I had enrolled my name in the scientific school as a student of natural history. He asked me a few questions about my object in coming, my antecedents generally, the mode in which I afterwards proposed to use the knowledge I might acquire, and finally, whether I wished to study any special branch. To the latter I replied that while I wished to be well grounded in all departments of zoology, I purposed to devote myself specially to insects.

“When do you wish to begin?” he asked.

“Now,” I replied.

This seemed to please him, and with an energetic “Very well,” he reached from a shelf a huge jar of specimens in yellow alcohol.

“Take this fish,” he said, “and look at it; we call it a Haemulon; by and by I will ask what you have seen.”

In ten minutes I had seen all that could be seen in that fish, and started in search of the professor, who had, however, left the museum; and when I returned, after lingering over some of the odd animals stored in the upper apartment, my specimen was dry all over. I dashed the fluid over the fish as if to resuscitate it from a fainting-fit, and looked with anxiety for a return of a normal, sloppy appearance. This little excitement over, nothing was to be done but return to a steadfast gaze at my mute companion. Half an hour passed, an hour, another hour; the fish began to look loathsome. I turned it over and around; looked it in the face — ghastly; from behind, beneath, above, sideways, at a three-quarters view — just as ghastly. I was in despair; at an early hour, I concluded that lunch was necessary; so with infinite relief, the fish was carefully replaced in the jar, and for an hour I was free.

On my return, I learned that Professor Agassiz had been at the museum, but had gone and would not return for several hours. My fellow students were too busy to be disturbed by continued conversation. Slowly I drew forth that hideous fish, and with a feeling of desperation again looked at it. I might not use a magnifying glass; instruments of all kinds were interdicted. My two hands, my two eyes, and the fish; it seemed a most limited field. I pushed my fingers down its throat to see how sharp its teeth were. I began to count the scales in the different rows until I was convinced that that was nonsense. At last a happy thought struck me — I would draw the fish; and now with surprise I began to discover new features in the creature. Just then the professor returned.

“That is right said he, “a pencil is one of the best eyes. I am glad to notice, too, that you keep your specimen wet and your bottle corked.”

The student spends many more hours with the same fish but you need to read the account for yourself to fully appreciate it. There are other versions of the story which have been gathered here.

Two questions:

  • When was the last time you spent even ten minutes looking at a photograph or infographic?
  • When was the last time you tried drawing a copy of an image to make sure you are “seeing” all the detail an image has to offer?

I don’t offer myself as a model as “I can’t recall” is my answer to both questions.

In a world awash in images, shouldn’t we all be able to give a better answer than that?


Some addition resources on drawing versus photography.

Why We Should Draw More (and Photograph Less) – School of Life.

Why you should stop taking pictures on your phone – and learn to draw

The Elements of Drawing, in Three Letters to Beginners by John Ruskin

BTW, Ruskin was no Luddite of the mid-nineteenth century. He was an early adopter of photography to document the architecture of Venice.

How many images do you “view” in a day without really “seeing” them?

Piecing together visual clues for verification

Filed under: Image Understanding,Verification — Patrick Durusau @ 7:05 pm

Piecing together visual clues for verification by Jenni Sargent.

From the post:

When you start working to verify a photo or video, it helps to make a note of every clue you can find. What can you infer about the location from the architecture, for example? What information can you gather from signs and billboards? Are there any distinguishing landmarks or geographical features?

Piecing together and cross referencing these clues with existing data, maps and information can often give you the evidence that you need to establish where a photo or video was captured.

Jenni outlines seven (7) clues to look for in photos and her post includes a video plus a observation challenge!

Good luck with the challenge! Compare your results with one or more colleagues!

December 16, 2015

We Know How You Feel [A Future Where Computers Remain Imbeciles]

We Know How You Feel by Raffi Khatchadourian.

From the post:

Three years ago, archivists at A.T. & T. stumbled upon a rare fragment of computer history: a short film that Jim Henson produced for Ma Bell, in 1963. Henson had been hired to make the film for a conference that the company was convening to showcase its strengths in machine-to-machine communication. Told to devise a faux robot that believed it functioned better than a person, he came up with a cocky, boxy, jittery, bleeping Muppet on wheels. “This is computer H14,” it proclaims as the film begins. “Data program readout: number fourteen ninety-two per cent H2SOSO.” (Robots of that era always seemed obligated to initiate speech with senseless jargon.) “Begin subject: Man and the Machine,” it continues. “The machine possesses supreme intelligence, a faultless memory, and a beautiful soul.” A blast of exhaust from one of its ports vaporizes a passing bird. “Correction,” it says. “The machine does not have a soul. It has no bothersome emotions. While mere mortals wallow in a sea of emotionalism, the machine is busy digesting vast oceans of information in a single all-encompassing gulp.” H14 then takes such a gulp, which proves overwhelming. Ticking and whirring, it begs for a human mechanic; seconds later, it explodes.

The film, titled “Robot,” captures the aspirations that computer scientists held half a century ago (to build boxes of flawless logic), as well as the social anxieties that people felt about those aspirations (that such machines, by design or by accident, posed a threat). Henson’s film offered something else, too: a critique—echoed on television and in novels but dismissed by computer engineers—that, no matter a system’s capacity for errorless calculation, it will remain inflexible and fundamentally unintelligent until the people who design it consider emotions less bothersome. H14, like all computers in the real world, was an imbecile.

Today, machines seem to get better every day at digesting vast gulps of information—and they remain as emotionally inert as ever. But since the nineteen-nineties a small number of researchers have been working to give computers the capacity to read our feelings and react, in ways that have come to seem startlingly human. Experts on the voice have trained computers to identify deep patterns in vocal pitch, rhythm, and intensity; their software can scan a conversation between a woman and a child and determine if the woman is a mother, whether she is looking the child in the eye, whether she is angry or frustrated or joyful. Other machines can measure sentiment by assessing the arrangement of our words, or by reading our gestures. Still others can do so from facial expressions.

Our faces are organs of emotional communication; by some estimates, we transmit more data with our expressions than with what we say, and a few pioneers dedicated to decoding this information have made tremendous progress. Perhaps the most successful is an Egyptian scientist living near Boston, Rana el Kaliouby. Her company, Affectiva, formed in 2009, has been ranked by the business press as one of the country’s fastest-growing startups, and Kaliouby, thirty-six, has been called a “rock star.” There is good money in emotionally responsive machines, it turns out. For Kaliouby, this is no surprise: soon, she is certain, they will be ubiquitous.

This is a very compelling look at efforts that have in practice made computers more responsive to the emotions of users. With the goal of influencing users based upon the emotions that are detected.

Sound creepy already?

The article is fairly long but a great insight into progress already being made and that will be made in the not too distant future.

However, “emotionally responsive machines” remain the same imbeciles as they were in the story of H14. That is to say they can only “recognize” emotions much as they can “recognize” color. To be sure it “learns” but its reaction upon recognition remains a matter of programming and/or training.

The next wave of startups will create programmable emotional images of speakers, edging the arms race for privacy just another step down the road. If I were investing in startups, I would concentrate on those to defeat emotional responsive computers.

If you don’t want to wait for a high tech way to defeat emotionally responsive computers, may I suggest a fairly low tech solution:

Wear a mask!

One of my favorites:

Egyptian_Guy_Fawkes_Mask

(From https://commons.wikimedia.org/wiki/Category:Masks_of_Guy_Fawkes. There are several unusual images there.)

Or choose any number of other masks at your nearest variety store.

A hard mask that conceals your eyes and movement of your face will defeat any “emotionally responsive computer.”

If you are concerned about your voice giving you away, search for “voice changer” for over 4 million “hits” on software to alter your vocal characteristics. Much of it for free.

Defeating “emotionally responsive computers” remains like playing checkers against an imbecile. If you lose, it’s your own damned fault.

PS: If you have a Max Headroom type TV and don’t want to wear a mask all the time, consider this solution for its camera:

120px-Cutting_tool_2

Any startups yet based on defeating the Internet of Things (IoT)? Predicting 2016/17 will be the year for those to take off.

November 12, 2015

Visualizing What Your Computer (and Science) Ignore (mostly)

Filed under: Computer Science,Geometry,Image Processing,Image Understanding,Physics — Patrick Durusau @ 8:01 pm

Deviation Magnification: Revealing Departures from Ideal Geometries by Neal Wadhwa, Tali Dekel, Donglai Wei, Frédo Durand, William T. Freeman.

Abstract:

Structures and objects are often supposed to have idealized geome- tries such as straight lines or circles. Although not always visible to the naked eye, in reality, these objects deviate from their idealized models. Our goal is to reveal and visualize such subtle geometric deviations, which can contain useful, surprising information about our world. Our framework, termed Deviation Magnification, takes a still image as input, fits parametric models to objects of interest, computes the geometric deviations, and renders an output image in which the departures from ideal geometries are exaggerated. We demonstrate the correctness and usefulness of our method through quantitative evaluation on a synthetic dataset and by application to challenging natural images.

The video for the paper is quite compelling:

Read the full paper here: http://people.csail.mit.edu/nwadhwa/deviation-magnification/DeviationMagnification.pdf

From the introduction to the paper:

Many phenomena are characterized by an idealized geometry. For example, in ideal conditions, a soap bubble will appear to be a perfect circle due to surface tension, buildings will be straight and planetary rings will form perfect elliptical orbits. In reality, however, such flawless behavior hardly exists, and even when invisible to the naked eye, objects depart from their idealized models. In the presence of gravity, the bubble may be slightly oval, the building may start to sag or tilt, and the rings may have slight perturbations due to interactions with nearby moons. We present Deviation Magnification, a tool to estimate and visualize such subtle geometric deviations, given only a single image as input. The output of our algorithm is a new image in which the deviations from ideal are magnified. Our algorithm can be used to reveal interesting and important information about the objects in the scene and their interaction with the environment. Figure 1 shows two independently processed images of the same house, in which our method automatically reveals the sagging of the house’s roof, by estimating its departure from a straight line.

Departures from “idealized geometry” make for captivating videos but there is a more subtle point that Deviation Magnification will help bring to the fore.

“Idealized geometry,” just like discrete metrics for attitude measurement or metrics of meaning, etc. are all myths. Useful myths as houses don’t (usually) fall down, marketing campaigns have a high degree of success, and engineering successfully relies on approximations that depart from the “real world.”

Science and computers have a degree of precision that has no counterpart in the “real world.”

Watch the video again if you doubt that last statement.

Whether you are using science and/or a computer, always remember that your results are approximations based upon approximations.

I first saw this in Four Short Links: 12 November 2015 by Nat Torkington.

June 18, 2015

I’m a bird watcher, I’m a bird watcher, here comes one now…

Filed under: Image Recognition,Image Understanding,Machine Learning — Patrick Durusau @ 4:51 pm

New website can identify birds using photos

From the post:

In a breakthrough for computer vision and for bird watching, researchers and bird enthusiasts have enabled computers to achieve a task that stumps most humans—identifying hundreds of bird species pictured in photos.

The bird photo identifier, developed by the Visipedia research project in collaboration with the Cornell Lab of Ornithology, is available for free at: AllAboutBirds.org/photoID.

Results will be presented by researchers from Cornell Tech and the California Institute of Technology at the Computer Vision and Pattern Recognition (CVPR) conference in Boston on June 8, 2015.

Called Merlin Bird Photo ID, the identifier is capable of recognizing 400 of the mostly commonly encountered birds in the United States and Canada.

“It gets the bird right in the top three results about 90% of the time, and it’s designed to keep improving the more people use it,” said Jessie Barry at the Cornell Lab of Ornithology. “That’s truly amazing, considering that the computer vision community started working on the challenge of bird identification only a few years ago.”

The perfect website for checking photos of birds made on summer vacation and an impressive feat of computer vision.

The more the service is used, the better it gets. Upload your vacation bird pics today!

June 14, 2015

CVPR 2015 Papers

CVPR [Computer Vision and Pattern Recognition] 2015 Papers by @karpathy.

This is very cool!

From the webpage:

Below every paper are TOP 100 most-occuring words in that paper and their color is based on LDA topic model with k = 7.
(It looks like 0 = datasets?, 1 = deep learning, 2 = videos , 3 = 3D Computer Vision , 4 = optimization?, 5 = low-level Computer Vision?, 6 = descriptors?)

You can sort by LDA topics, view the PDFs, rank the other papers by tf-idf similarity to a particular paper.

Very impressive and suggestive of other refinements for viewing a large number of papers in a given area.

Enjoy!

May 30, 2015

Web Page Structure, Without The Semantic Web

Could a Little Startup Called Diffbot Be the Next Google?

From the post:


Diffbot founder and CEO Mike Tung started the company in 2009 to fix a problem: there was no easy, automated way for computers to understand the structure of a Web page. A human looking at a product page on an e-commerce site, or at the front page of a newspaper site, knows right away which part is the headline or the product name, which part is the body text, which parts are comments or reviews, and so forth.

But a Web-crawler program looking at the same page doesn’t know any of those things, since these elements aren’t described as such in the actual HTML code. Making human-readable Web pages more accessible to software would require, as a first step, a consistent labeling system. But the only such system to be seriously proposed, Tim Berners-Lee’s Semantic Web, has long floundered for lack of manpower and industry cooperation. It would take a lot of people to do all the needed markup, and developers around the world would have to adhere to the Resource Description Framework prescribed by the World Wide Web Consortium.

Tung’s big conceptual leap was to dispense with all that and attack the labeling problem using computer vision and machine learning algorithms—techniques originally developed to help computers make sense of edges, shapes, colors, and spatial relationships in the real world. Diffbot runs virtual browsers in the cloud that can go to a given URL; suck in the page’s HTML, scripts, and style sheets; and render it just as it would be shown on a desktop monitor or a smartphone screen. Then edge-detection algorithms and computer-vision routines go to work, outlining and measuring each element on the page.

Using machine-learning techniques, this geometric data can then be compared to frameworks or “ontologies”—patterns distilled from training data, usually by humans who have spent time drawing rectangles on Web pages, painstakingly teaching the software what a headline looks like, what an image looks like, what a price looks like, and so on. The end result is a marked-up summary of a page’s important parts, built without recourse to any Semantic Web standards.

The irony here, of course, is that much of the information destined for publication on the Web starts out quite structured. The WordPress content-management system behind Xconomy’s site, for example, is built around a database that knows exactly which parts of this article should be presented as the headline, which parts should look like body text, and (crucially, to me) which part is my byline. But these elements get slotted into a layout designed for human readability—not for parsing by machines. Given that every content management system is different and that every site has its own distinctive tags and styles, it’s hard for software to reconstruct content types consistently based on the HTML alone.

There are several themes here that are relevant to topic maps.

First, it is true that most data starts with some structure, styles if you will, before it is presented for user consumption. Imagine an authoring application that automatically and unknown to its user, metadata that can then provide semantics for its data.

Second, the recognition of structure approach being used by Diffbot is promising in the large but should also be promising in the small as well. Local documents of a particular type are unlikely to have the variance of documents across the web. Meaning that with far less effort, you can build recognition systems that can empower more powerful searching of local document repositories.

Third, and perhaps most importantly, while the results may not be 100% accurate, the question for any such project should be how much accuracy is required? If I am mining social commentary blogs, a 5% error rate on recognition of speakers might be acceptable, because for popular threads or speakers, those errors are going to be quickly corrected. Unpopular threads or authors never followed, does that come under no harm/no foul?

Highly recommended for reading/emulation.

February 4, 2015

Oranges and Blues

Filed under: Image Understanding,UX,Visualization — Patrick Durusau @ 4:19 pm

Oranges and Blues by Edmund Helmer.

From the post:

Title-Fifth-Element

When I launched this site over two years ago, one of my first decisions was to pick a color scheme – it didn’t take long. Anyone who watches enough film becomes quickly used to Hollywood’s taste for oranges and blues, and it’s no question that these represent the default palette of the industry; so I made those the default of BoxOfficeQuant as well. But just how prevalent are the oranges and blues?

Some people have commented and researched how often those colors appear in movies and movie posters, and so I wanted to take it to the next step and look at the colors used in film trailers. Although I’d like to eventually apply this to films themselves, I used trailers because 1) They’re our first window into what a movie will look like, and 2) they’re easy to get (legally). So I’ve downloaded all the trailers available on the-numbers.com, 312 in total – not a complete set, but the selection looks random enough – and I’ve sampled across all the frames of these trailers to extract their Hue, Saturation, and Value. If you’re new to those terms, the chart below should make it clear enough: Hue is the color, Value is the distance from black, (and saturation, not shown, is the color intensity).

Edmund’s data isn’t “big” or “fast” but it is “interesting.” Unfortunately, “interesting” data is one of those categories where I know it when I see it.

I have seen movies and movie trailers but it never occurred to me to inspect the colors used in movie trailers. Turns out to not be a random choice. Great visualizations in this post and a link to further research on genre and colors, etc.

How is this relevant to you? Do you really want to use scary colors for your UI? It’s not really that simple but neither are movie trailers. What makes some capture your attention and stay with you? Others you could not repeat at the end of the next commercial. Personally, I would prefer a UI that captured my attention and that I remembered from the first time I saw it. (Especially if I were selling the product with that UI.)

You?

I first saw this in a tweet by Neil Saunders.

PS: If you are interested in statistics and film, BoxOfficeQuant – Statistics and Film (Edmund’s blog) is a great blog to follow.

December 15, 2014

Tweet Steganography?

Filed under: Image Understanding,Security,Steganography,Twitter — Patrick Durusau @ 1:34 pm

Hacking The Tweet Stream by Brett Lawrie.

Brett covers two popular methods for escaping the 140 character limit of Twitter, Tweetstorms and inline screen shots of text.

Brett comes down in favor of inline screen shots over Tweetstorms but see his post to get the full flavor of his comments.

What puzzled me was that Brett did not mention the potential for the use of steganography with inline screen shots. Whether they are of text or not. Could very well be screen shots of portions of the 1611 version of the King James Version (KJV) of the Bible with embedded information that some find offensive if not dangerous.

Or I suppose the sharper question is, How do you know that isn’t happening right now? On Flickr, Instagram, Twitter, one of many other photo sharing sites, blogs, etc.

Oh, I just remembered, I have an image for you. 😉

kjv-genesis

(Image from a scan hosted at the Schoenberg Center for Electronic Text and Image (UPenn))

A downside to Twitter text images is that they won’t be easily indexed. Assuming you want your content to be findable. Sometimes you don’t.

November 23, 2014

Show and Tell: A Neural Image Caption Generator

Filed under: Image Processing,Image Recognition,Image Understanding — Patrick Durusau @ 10:53 am

Show and Tell: A Neural Image Caption Generator by Oriol Vinyals, Alexander Toshev, Samy Bengio, Dumitru Erhan.

Abstract:

Automatically describing the content of an image is a fundamental problem in artificial intelligence that connects computer vision and natural language processing. In this paper, we present a generative model based on a deep recurrent architecture that combines recent advances in computer vision and machine translation and that can be used to generate natural sentences describing an image. The model is trained to maximize the likelihood of the target description sentence given the training image. Experiments on several datasets show the accuracy of the model and the fluency of the language it learns solely from image descriptions. Our model is often quite accurate, which we verify both qualitatively and quantitatively. For instance, while the current state-of-the-art BLEU score (the higher the better) on the Pascal dataset is 25, our approach yields 59, to be compared to human performance around 69. We also show BLEU score improvements on Flickr30k, from 55 to 66, and on SBU, from 19 to 27.

Another caption generating program for images. (see also, Deep Visual-Semantic Alignments for Generating Image Descriptions) Not quite to the performance of a human observer but quite respectable. The near misses are amusing enough for crowd correction to be an element in a full blown system.

Perhaps “rough recognition” is close enough for some purposes. Searching images for people who match a partial description and producing a much smaller set for additional processing.

I first saw this in Nat Torkington’s Four short links: 18 November 2014.

November 21, 2014

Deep Visual-Semantic Alignments for Generating Image Descriptions

Filed under: Identification,Image Processing,Image Recognition,Image Understanding — Patrick Durusau @ 7:52 pm

Deep Visual-Semantic Alignments for Generating Image Descriptions by Andrej Karpathy and Li Fei-Fei.

From the webpage:

We present a model that generates free-form natural language descriptions of image regions. Our model leverages datasets of images and their sentence descriptions to learn about the inter-modal correspondences between text and visual data. Our approach is based on a novel combination of Convolutional Neural Networks over image regions, bidirectional Recurrent Neural Networks over sentences, and a structured objective that aligns the two modalities through a multimodal embedding. We then describe a Recurrent Neural Network architecture that uses the inferred alignments to learn to generate novel descriptions of image regions. We demonstrate the effectiveness of our alignment model with ranking experiments on Flickr8K, Flickr30K and COCO datasets, where we substantially improve on the state of the art. We then show that the sentences created by our generative model outperform retrieval baselines on the three aforementioned datasets and a new dataset of region-level annotations.

Excellent examples with generated text. Code and other predictions “coming soon.”

For the moment you can also read the research paper: Deep Visual-Semantic Alignments for Generating Image Descriptions

Serious potential in any event but even more so if the semantics of the descriptions could be captured and mapped across natural languages.

November 1, 2014

Guess the Manuscript XVI

Filed under: British Library,Image Processing,Image Recognition,Image Understanding — Patrick Durusau @ 7:55 pm

Guess the Manuscript XVI

From the post:

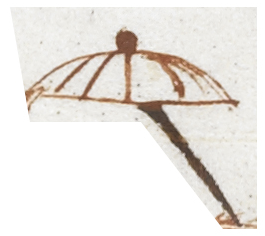
Welcome to the sixteenth instalment of our popular Guess the Manuscript series. The rules are simple: we post an image of part of a manuscript that is on the British Library’s Digitised Manuscripts site, you guess which one it’s taken from!

bl mss XVI

Are you as surprised as we are to find an umbrella in a medieval manuscript? The manuscript from which this image was taken will feature in a blogpost in the near future.

In the meantime, answers or guesses please in the comments below, or via Twitter @BLMedieval.

Caution! The Medieval Period lasted from five hundred (500) C.E. until fifteen hundred (1500) C.E. Google NGrams records the first use of “umbrella” at or around sixteen-sixty (1660). Is this an “umbrella” or something else?

Using Google’s reverse image search found only repostings of the image search challenge, no similar images. Not sure that helps but was worth a try.

On the bright side, there are only two hundred and fifty-seven (257) manuscripts in the digitized collection dated between five hundred (500) C.E. until fifteen hundred (1500) C.E.

What stories or information can be found in those volumes that might be accompanied by such an image? Need to create a list of the classes of those manuscripts.

Suggestions? Is there an image processor in the house?

Enjoy!

October 24, 2014

50 Face Recognition APIs

Filed under: Face Detection,Image Processing,Image Recognition,Image Understanding — Patrick Durusau @ 1:44 pm

50 Face Recognition APIs by Mirko Krivanek.

Interesting listing published on Mashape. Only the top 12 are listed below. It would be nice to have a separate blog for voice recognition APIs. I’ve been thinking at using voice rather than passport or driving license, as a more secure ID. The voice has a texture unique to each individual.

Subjects that are likely to be of interest!

Mirko mentions voice but then lists face recognition APIs.

Voice comes up in a mixture of APIs in: 37 Recognition APIS: AT&T SPEECH, Moodstocks and Rekognition by Matthew Scott.

I first saw this in a tweet by Andrea Mostosi

August 23, 2014

Large-Scale Object Classification…

Filed under: Classification,Image Recognition,Image Understanding,Topic Maps — Patrick Durusau @ 3:37 pm

Large-Scale Object Classi cation using Label Relation Graphs by Jia Deng, et al.

Abstract:

In this paper we study how to perform object classi cation in a principled way that exploits the rich structure of real world labels. We develop a new model that allows encoding of flexible relations between labels. We introduce Hierarchy and Exclusion (HEX) graphs, a new formalism that captures semantic relations between any two labels applied to the same object: mutual exclusion, overlap and subsumption. We then provide rigorous theoretical analysis that illustrates properties of HEX graphs such as consistency, equivalence, and computational implications of the graph structure. Next, we propose a probabilistic classifi cation model based on HEX graphs and show that it enjoys a number of desirable properties. Finally, we evaluate our method using a large-scale benchmark. Empirical results demonstrate that our model can signifi cantly improve object classifi cation by exploiting the label relations.

Let’s hear it for “real world labels!”

By which the authors mean:

  • An object can have more than one label.
  • There are relationships between labels.

From the introduction:

We first introduce Hierarchy and Exclusion (HEX) graphs, a new formalism allowing flexible specifi cation of relations between labels applied to the same object: (1) mutual exclusion (e.g. an object cannot be dog and cat), (2) overlapping (e.g. a husky may or may not be a puppy and vice versa), and (3) subsumption (e.g. all huskies are dogs). We provide theoretical analysis on properties of HEX graphs such as consistency, equivalence, and computational implications.

Next, we propose a probabilistic classi fication model leveraging HEX graphs. In particular, it is a special type of Conditional Random Field (CRF) that encodes the label relations as pairwise potentials. We show that this model enjoys
a number of desirable properties, including flexible encoding of label relations, predictions consistent with label relations, efficient exact inference for typical graphs, learning labels with varying specifi city, knowledge transfer, and uni fication of existing models.

Having more than one label is trivially possible in topic maps. The more interesting case is the authors choosing to treat semantic labels as subjects and to define permitted associations between those subjects.

A world of possibilities opens up when you can treat something as a subject that can have relationships defined to other subjects. Noting that those relationships can also be treated as subjects should someone desire to do so.

I first saw this at: Is that husky a puppy?

July 28, 2014

Cat Dataset

Filed under: Data,Image Processing,Image Recognition,Image Understanding — Patrick Durusau @ 12:14 pm

Cat Dataset

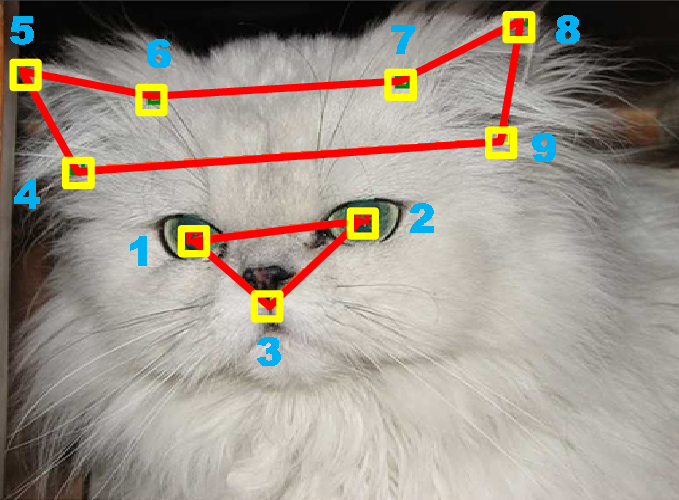
cat

From the description:

The CAT dataset includes 10,000 cat images. For each image, we annotate the head of cat with nine points, two for eyes, one for mouth, and six for ears. The detail configuration of the annotation was shown in Figure 6 of the original paper:

Weiwei Zhang, Jian Sun, and Xiaoou Tang, “Cat Head Detection – How to Effectively Exploit Shape and Texture Features”, Proc. of European Conf. Computer Vision, vol. 4, pp.802-816, 2008.

A more accessible copy: Cat Head Detection – How to Effectively Exploit Shape and Texture Features

Prelude to a cat filter for Twitter feeds? 😉

I first saw this in a tweet by Basile Simon.

June 25, 2014

One Hundred Million…

Filed under: Data,Image Processing,Image Understanding,Yahoo! — Patrick Durusau @ 7:29 pm

One Hundred Million Creative Commons Flickr Images for Research by David A. Shamma.

From the post:

Today the photograph has transformed again. From the old world of unprocessed rolls of C-41 sitting in a fridge 20 years ago to sharing photos on the 1.5” screen of a point and shoot camera 10 years back. Today the photograph is something different. Photos automatically leave their capture (and formerly captive) devices to many sharing services. There are a lot of photos. A back of the envelope estimation reports 10% of all photos in the world were taken in the last 12 months, and that was calculated three years ago. And of these services, Flickr has been a great repository of images that are free to share via Creative Commons.

On Flickr, photos, their metadata, their social ecosystem, and the pixels themselves make for a vibrant environment for answering many research questions at scale. However, scientific efforts outside of industry have relied on various sized efforts of one-off datasets for research. At Flickr and at Yahoo Labs, we set out to provide something more substantial for researchers around the globe.

[image omitted]

Today, we are announcing the Flickr Creative Commons dataset as part of Yahoo Webscope’s datasets for researchers. The dataset, we believe, is one of the largest public multimedia datasets that has ever been released—99.3 million images and 0.7 million videos, all from Flickr and all under Creative Commons licensing.

The dataset (about 12GB) consists of a photo_id, a jpeg url or video url, and some corresponding metadata such as the title, description, title, camera type, title, and tags. Plus about 49 million of the photos are geotagged! What’s not there, like comments, favorites, and social network data, can be queried from the Flickr API.

The good news doesn’t stop there, the 100 million photos have been analyzed for standard features as well!

Enjoy!

March 26, 2014

Deep Belief in Javascript

Filed under: Image Recognition,Image Understanding,Javascript,Neural Networks,WebGL — Patrick Durusau @ 1:34 pm

Deep Belief in Javascript

From the webpage:

It’s an implementation of the Krizhevsky convolutional neural network architecture for object recognition in images, running entirely in the browser using Javascript and WebGL!

I built it so people can easily experiment with a classic deep belief approach to image recognition themselves, to understand both its limitations and its power, and to demonstrate that the algorithms are usable even in very restricted client-side environments like web browsers.

A very impressive demonstration of the power of Javascript to say nothing of neural networks.

You can submit your own images for “recognition.”

I first saw this in Nat Torkington’s Four short links: 24 March 2014.

March 9, 2014

Getty – 35 Million Free Images

Filed under: Image Understanding,Intellectual Property (IP) — Patrick Durusau @ 3:40 pm

Getty Images makes 35 million images free in fight against copyright infringement by Olivier Laurent.

From the post:

Getty Images has single-handedly redefined the entire photography market with the launch of a new embedding feature that will make more than 35 million images freely available to anyone for non-commercial usage. BJP’s Olivier Laurent finds out more.

(skipped image)

The controversial move is set to draw professional photographers’ ire at a time when the stock photography market is marred by low prices and under attack from new mobile photography players. Yet, Getty Images defends the move, arguing that it’s not strong enough to control how the Internet has developed and, with it, users’ online behaviours.

“We’re really starting to see the extent of online infringement,” says Craig Peters, senior vice president of business development, content and marketing at Getty Images. “In essence, everybody today is a publisher thanks to social media and self-publishing platforms. And it’s incredibly easy to find content online and simply right-click to utilise it.”

In the past few years, Getty Images found that its content was “incredibly used” in this manner online, says Peters. “And it’s not used with a watermark; instead it’s typically found on one of our valid licensing customers’ websites or through an image search. What we’re finding is that the vast majority of infringement in this space happen with self publishers who typically don’t know anything about copyright and licensing, and who simply don’t have any budget to support their content needs.”

To solve this problem, Getty Images has chosen an unconventional strategy. “We’re launching the ability to embed our images freely for non-commercial use online,” Peters explains. In essence, anyone will be able to visit Getty Images’ library of content, select an image and copy an embed HTML code to use that image on their own websites. Getty Images will serve the image in a embedded player – very much like YouTube currently does with its videos – which will include the full copyright information and a link back to the image’s dedicated licensing page on the Getty Images website.

More than 35 million images from Getty Images’ news, sports, entertainment and stock collections, as well as its archives, will be available for embedding from 06 March.

What a clever move by Getty!

Think about it. Who do you sue for copyright infringement? Is it some hobbyist blogger or use of an image in a school newspaper? OK, the RIAA would but what about sane people?

Your first question: Did the infringement result is a substantial profit due to the infringement?

Your second question: Does the guilty party have enough assets to likely recover the substantial profit?

You only want to catch infringement by other major for profit players.

All of who have to publicly use your images. Hiding infringement isn’t possible.

None of the major media outlets or publishers are going to cheat on use of your images. Whether that is because they are honest with regard to IP or so easily caught, doesn’t really matter.

In one fell swoop, Getty has secured for itself free advertising for every image that is used for free. Advertising it could not have bought for any sum of money.

Makes me wonder when the ACM, IEEE, Springer, Elsevier and others are going to realize that free and public access to their journals and monographs will drive demand for libraries to have enhanced access to those publications?

It isn’t like EBSCO and the others are going to start using data that is limited to non-commercial use for their databases. That would be too obvious, not to mention incurring significant legal liability.

Ditto for libraries. Libraries want legitimate access to the materials they provide and/or host.

As I told an academic society once upon a time, “It’s time to stop grubbing for pennies when there are $100 bills blowing over head.” It involve a replacement of “lost in the mail” journals. At a replacement cost of $3.50 (plus postage) per claim, they were employing a full time person to research eligibility to request a replacement copy. For a time I convinced them to simply replace upon request in the mailroom. Track requests but just do it. Worked quite well.

Over the years management has changed and I suspect they have returned to protecting the rights of members that only people entitled to a copy of the journal got one. I kid you not, that was the explanation for the old policy. Bizarre.

I first saw this at: Getty Set 35 Million Images Free, But Who Can Use Them? by David Godsall.

PS: The thought does occur to me that suitable annotations could be prepared ahead of time for these images so that when a for-profit publisher purchases the rights to a Getty image, someone could offer robust metadata to accompany the image.

December 13, 2013

A million first steps [British Library Image Release]

Filed under: Data,Image Understanding,Library — Patrick Durusau @ 4:48 pm

A million first steps by Ben O’Steen.

From the post:

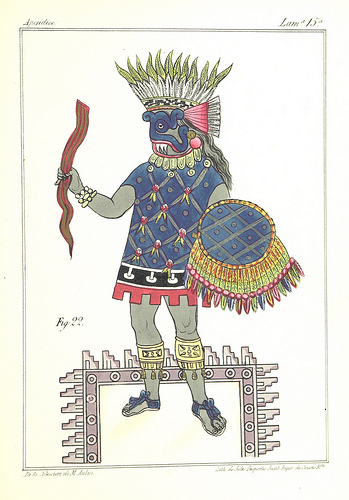
We have released over a million images onto Flickr Commons for anyone to use, remix and repurpose. These images were taken from the pages of 17th, 18th and 19th century books digitised by Microsoft who then generously gifted the scanned images into the Public Domain. The images themselves cover a startling mix of subjects: There are maps, geological diagrams, beautiful illustrations, comical satire, illuminated and decorative letters, colourful illustrations, landscapes, wall-paintings and so much more that even we are not aware of.

Which brings me to the point of this release. We are looking for new, inventive ways to navigate, find and display these ‘unseen illustrations’. The images were plucked from the pages as part of the ‘Mechanical Curator’, a creation of the British Library Labs project. Each image is individually addressible, online, and Flickr provies an API to access it and the image’s associated description.

We may know which book, volume and page an image was drawn from, but we know nothing about a given image. Consider the image below. The title of the work may suggest the thematic subject matter of any illustrations in the book, but it doesn’t suggest how colourful and arresting these images are.

(Aside from any educated guesses we might make based on the subject matter of the book of course.)

BL-image

See more from this book: “Historia de las Indias de Nueva-España y islas de Tierra Firme…” (1867)

Next steps

We plan to launch a crowdsourcing application at the beginning of next year, to help describe what the images portray. Our intention is to use this data to train automated classifiers that will run against the whole of the content. The data from this will be as openly licensed as is sensible (given the nature of crowdsourcing) and the code, as always, will be under an open licence.

The manifests of images, with descriptions of the works that they were taken from, are available on github and are also released under a public-domain ‘licence’. This set of metadata being on github should indicate that we fully intend people to work with it, to adapt it, and to push back improvements that should help others work with this release.

There are very few datasets of this nature free for any use and by putting it online we hope to stimulate and support research concerning printed illustrations, maps and other material not currently studied. Given that the images are derived from just 65,000 volumes and that the library holds many millions of items.

If you need help or would like to collaborate with us, please contact us on email, or twitter (or me personally, on any technical aspects)

Think about the numbers. One million images from 65,000 volumes. The British Library holds millions of items.

Encourage more releases like this one with good use of and suggestions for this release!

Older Posts »

Powered by WordPress