Another Word For It Patrick Durusau on Topic Maps and Semantic Diversity

February 28, 2013

From President Obama, The Opaque

Filed under: Government,Government Data,Open Data,Open Government,Transparency — Patrick Durusau @ 5:26 pm

Leaked BLM Draft May Hinder Public Access to Chemical Information

From the post:

On Feb. 8, EnergyWire released a leaked draft proposal from the U.S. Department of the Interior’s Bureau of Land Management on natural gas drilling and extraction on federal public lands. If finalized, the proposal could greatly reduce the public’s ability to protect our resources and communities. The new draft indicates a disappointing capitulation to industry recommendations.

The draft rule affects oil and natural gas drilling operations on the 700 million acres of public land administered by BLM, plus 56 million acres of Indian lands. This includes national forests, which are the sources of drinking water for tens of millions of Americans, national wildlife refuges, and national parks, which are widely used for recreation.

The Department of the Interior estimates that 90 percent of the 3,400 wells drilled each year on public and Indian lands use natural gas fracking, a process that pumps large amounts of water, sand, and toxic chemicals into gas wells at very high pressure to cause fissures in shale rock that contains methane gas. Fracking fluid is known to contain benzene (which causes cancer), toluene, and other harmful chemicals. Studies link fracking-related activities to contaminated groundwater, air pollution, and health problems in animals and humans.

If the leaked draft is finalized, the changes in chemical disclosure requirements would represent a major concession to the oil and gas industry. The rule would allow drilling companies to report the chemicals used in fracking to an industry-funded website, called FracFocus.org. Though the move by the federal government to require online disclosure is encouraging, the choice of FracFocus as the vehicle is problematic for many reasons.

First, the site is not subject to federal laws or oversight. The site is managed by the Ground Water Protection Council (GWPC) and the Interstate Oil and Gas Compact Commission (IOGCC), nonprofit intergovernmental organizations comprised of state agencies that promote oil and gas development. However, the site is paid for by the American Petroleum Institute and America’s Natural Gas Alliance, industry associations that represent the interests of member companies.

BLM would have little to no authority to ensure the quality and accuracy of the data reported directly to such a third-party website. Additionally, the data will not be accessible through the Freedom of Information Act since BLM is not collecting the information. The IOGCC has already declared that it is not subject to federal or state open records laws, despite its role in collecting government-mandated data.

Second, FracFocus.org makes it difficult for the public to use the data on wells and chemicals. The leaked BLM proposal fails to include any provisions to ensure minimum functionality on searching, sorting, downloading, or other mechanisms to make complex data more usable. Currently, the site only allows users to download PDF files of reports on fracked wells, which makes it very difficult to analyze data in a region or track chemical use. Despite some plans to improve searching on FracFocus.org, the oil and gas industry opposes making chemical data easier to download or evaluate for fear that the public “might misinterpret it or use it for political purposes.”

Don’t you feel safer? Knowing the oil and gas industry is working so hard to protect you from misinterpreting data?

Why the government is helping the oil and gas industry protect us from data I cannot say.

I mention this an example of testing for “transparency.”

Anything the government freely makes available with spreadsheet capabilities, isn’t transparency. It’s distraction.

Any data that the government tries to hide, that data has potential value.

The Center for Effective Government points out these are draft rules and when published, you need to comment.

Not a bad plan but not very reassuring given the current record of President Obama, the Opaque.

Alternatives? Suggestions for how data mining could expose those who own floors of the BLM, who drill the wells, etc?
Public Preview of Data Explorer

Filed under: Data Explorer,Data Mining,Microsoft — Patrick Durusau @ 5:26 pm

Public Preview of Data Explorer by Chris Webb.

From the post:

In a nutshell, Data Explorer is self-service ETL for the Excel power user – it is to SSIS what PowerPivot is to SSAS. In my opinion it is just as important as PowerPivot for Microsoft’s self-service BI strategy.

I’ll be blogging about it in detail over the coming days (and also giving a quick demo in my PASS Business Analytics Virtual Chapter session tomorrow), but for now here’s a brief list of things it gives you over Excel’s native functionality for importing data:

  • It supports a much wider range of data sources, including Active Directory, Facebook, Wikipedia, Hive, and tables already in Excel
  • It has better functionality for data sources that are currently supported, such as the Azure Marketplace and web pages
  • It can merge data from multiple files that have the same structure in the same folder
  • It supports different types of authentication and the storing of credentials
  • It has a user-friendly, step-by-step approach to transforming, aggregating and filtering data until it’s in the form you want
  • It can load data into the worksheet or direct into the Excel model

There’s a lot to it, so download it and have a play! It’s supported on Excel 2013 and Excel 2010 SP1.

Download: Microsoft “Data Explorer” Preview for Excel

Chris has collected a number of links to Data Explorer resources so look to his post for more details.

It looks like a local install is required for the preview. I have been meaning to add Windows 7 to a VM and MS Office with that.

Guess it may be time to take the plunge. 😉 (I have XP/Office on a separate box that uses the same monitors/keyboard but sharing data is problematic.)

Voyeur Tools: See Through Your Texts

Filed under: Text Mining,Texts,Visualization,Voyeur — Patrick Durusau @ 5:26 pm

Voyeur Tools: See Through Your Texts

From the website:

Voyeur is a web-based text analysis environment. It is designed to be user-friendly, flexible and powerful. Voyeur is part of the Hermeneuti.ca, a collaborative project to develop and theorize text analysis tools and text analysis rhetoric. This section of the Hermeneuti.ca web site provides information and documentation for users and developers of Voyeur.

What you can do with Voyeur:

  • use texts in a variety of formats including plain text, HTML, XML, PDF, RTF and MS Word
  • use texts from different locations, including URLs and uploaded files
  • perform lexical analysis including the study of frequency and distribution data; in particular
  • export data into other tools (as XML, tab separated values, etc.)
  • embed live tools into remote web sites that can accompany or complement your own content

One of the tools used in the Lincoln Logarithms project.

Developing a Framework To Improve Critical Infrastructure Cybersecurity

Filed under: Cybersecurity,Security — Patrick Durusau @ 5:26 pm

Developing a Framework To Improve Critical Infrastructure Cybersecurity

Request for Information:

Summary:

The National Institute of Standards and Technology (NIST) is conducting a comprehensive review to develop a framework to reduce cyber risks to critical infrastructure1 (the “Cybersecurity Framework” or “Framework”). The Framework will consist of standards, methodologies, procedures, and processes that align policy, business, and technological approaches to address cyber risks.

1For the purposes of this RFI the term “critical infrastructure” has the meaning given the term in 42 U.S.C. 5195c(e), “systems and assets, whether physical or virtual, so vital to the United States that the incapacity or destruction of such systems and assets would have a debilitating impact on security, national economic security, national public health or safety, or any combination of those matters.”

This RFI requests information to help identify, refine, and guide the many interrelated considerations, challenges, and efforts needed to develop the Framework. In developing the Cybersecurity Framework, NIST will consult with the Secretary of Homeland Security, the National Security Agency, Sector-Specific Agencies and other interested agencies including the Office of Management and Budget, owners and operators of critical infrastructure, and other stakeholders including other relevant agencies, independent regulatory agencies, State, local, territorial and tribal governments. The Framework will be developed through an open public review and comment process that will include workshops and other opportunities to provide input.

Read the RFI and consider submitting comments (deadline 5:00 p.m. Eastern time on Monday, April 8, 2013) on how topic maps could play a role in the proposed framework.

Cybersecurity will be a “hot” property for several years so a fruitful area for marketing topic maps.*


* I commented earlier today on the possible use of topic maps with 14th century cooking texts. That is also a market for topic maps but less than a baker’s dozen of potential customers. Most of who are poor.

The cybersecurity market is much larger, has many customers who are not poor, and who are on both sides of the question. Always nice to have an arms race type market.

Big Data Wisdom Courtesy of Monty Python

Filed under: BigData,Project Management — Patrick Durusau @ 1:32 pm

Big Data Wisdom Courtesy of Monty Python by Rik Tamm-Daniels.

From the post:

One of our favorite parts of the hilarious 1975 King Arthur parody, Monty Python and the Holy Grail, is the “Bridge of Death” scene: If a knight answered the bridge keeper’s three questions, he could safely cross the bridge; if not, he would be catapulted into… the Gorge of Eternal Peril!

Unfortunately, that’s exactly what happened to most of King Arthur’s knights, who were either stumped by a surprise trivia question like, “What is the capital of Assyria?” – or responded too indecisively when asked, “What is your favorite color?”

Fortunately when King Arthur was asked, “What is the airspeed velocity of an unladen swallow?” he wisely sought further details: “What do you mean – an African or European swallow?” The stunned bridge keeper said, “I don’t know… AAAGH!” Breaking his own rule, the bridge keeper was thrown over the edge, freeing King Arthur to continue his quest for the Holy Grail.

Many organizations are on “Big Data Holy Grail” quests of their own, looking to deliver game-changing business analytics, only to find themselves in a “boil-the-ocean” Big Data project that “after 24 months of building… has no real value.” Unfortunately, many CIOs and BI Directors have rushed into hasty Hadoop implementations, fueled by a need to ‘respond’ to Big Data and ‘not fall behind.’

That’s just one of the troublesome findings from a recent InformationWeek article by Doug Henschen, Vague Goals Seed Big Data Failures. Henschen’s article cited a recent Infochimps Big Data survey that revealed 55% of big data projects don’t get completed and that many others fall short of their objectives. The top reason for failed Big Data projects was “inaccurate scope”:

I don’t disagree with the need to define “success” and anticipated ROI before the project starts.

But if it makes you feel any better, a 45% rate of success isn’t all that bad, considering the average experience: Facts and Figures, a summary of project failure data.

A summary of nine (9) studies, 2005 until 2011.

One of the worst comments being:

A truly stunning 78% of respondents reported that the “Business is usually or always out of sync with project requirements”

Semantic technologies are not well served by projects that get funded but produce no tangible benefits.

Project officers may like that sort of thing but the average consumer and business leaders know better.

Promoting semantic technologies in general and topic maps in particular mean successful results in the eyes of users, not ours.

Lincoln Logarithms: Finding Meaning in Sermons

Filed under: MALLET,Natural Language Processing,Text Corpus,Text Mining — Patrick Durusau @ 1:31 pm

Lincoln Logarithms: Finding Meaning in Sermons

From the webpage:

Just after his death, Abraham Lincoln was hailed as a luminary, martyr, and divine messenger. We wondered if using digital tools to analyze a digitized collection of elegiac sermons might uncover patterns or new insights about his memorialization.

We explored the power and possibility of four digital tools—MALLET, Voyant, Paper Machines, and Viewshare. MALLET, Paper Machines, and Voyant all examine text. They show how words are arranged in texts, their frequency, and their proximity. Voyant and Paper Machines also allow users to make visualizations of word patterns. Viewshare allows users to create timelines, maps, and charts of bodies of material. In this project, we wanted to experiment with understanding what these tools, which are in part created to reveal, could and could not show us in a small, but rich corpus. What we have produced is an exploration of the possibilities and the constraints of these tools as applied to this collection.

The resulting digital collection: The Martyred President: Sermons Given on the Assassination of President Lincoln.

Let’s say this is not an “ahistorical” view. 😉

Good example of exploring “unstructured” data.

A first step before authoring a topic map.

ICDM 2013: IEEE International Conference on Data Mining

Filed under: Conferences,Data Mining — Patrick Durusau @ 1:31 pm

ICDM 2013: IEEE International Conference on Data Mining December 8-11, 2013, Dallas, Texas.

Dates:

  • Workshop proposals: April 2
  • Workshop notification: April 30
  • ICDM contest proposals: April 30
  • Full paper submissions: June 21
  • Demo and tutorial proposals: August 3
  • Workshop paper submissions: August 3
  • Conference paper, tutorial, demo notifications: September 20
  • Workshop paper notifications: September 24
  • Conference dates: December 8-11 (Sunday-Wednesday)

From the call for papers:

The IEEE International Conference on Data Mining (ICDM) has established itself as the world's premier research conference in data mining. The 13th ICDM conference (ICDM '13) provides a premier forum for the dissemination of innovative, practical development experiences as well as original research results in data mining, spanning applications, algorithms, software and systems. The conference draws researchers and application developers from a wide range of data mining related areas such as statistics, machine learning, pattern recognition, databases and data warehousing, data visualization, knowledge-based systems and high performance computing. By promoting high quality and novel research findings, and innovative solutions to challenging data mining problems, the conference seeks to continuously advance the state of the art in data mining. As an important part of the conference, the workshops program will focus on new research challenges and initiatives, and the tutorials program will cover emerging data mining technologies and the latest developments in data mining.

Topics of Interest

Topics related to the design, analysis and implementation of data mining theory, systems and applications are of interest. These include, but are not limited to the following areas:

  • Foundations of data mining
  • Data mining and machine learning algorithms and methods in traditional areas (such as classification, regression, clustering, probabilistic modeling, and association analysis), and in new areas
  • Mining text and semi-structured data, and mining temporal, spatial and multimedia data
  • Mining data streams
  • Mining spatio-temporal data
  • Mining with data clouds and Big Data
  • Link and graph mining
  • Pattern recognition and trend analysis
  • Collaborative filtering/personalization
  • Data and knowledge representation for data mining
  • Query languages and user interfaces for mining
  • Complexity, efficiency, and scalability issues in data mining
  • Data pre-processing, data reduction, feature selection and feature transformation
  • Post-processing of data mining results
  • Statistics and probability in large-scale data mining
  • Soft computing (including neural networks, fuzzy logic, evolutionary computation, and rough sets) and uncertainty management for data mining
  • Integration of data warehousing, OLAP and data mining
  • Human-machine interaction and visual data mining
  • High performance and parallel/distributed data mining
  • Quality assessment and interestingness metrics of data mining results
  • Visual Analytics
  • Security, privacy and social impact of data mining
  • Data mining applications in bioinformatics, electronic commerce, Web, intrusion detection, finance, marketing, healthcare, telecommunications and other fields

I saw a post recently that made the case for data mining being the next “hot” topic in cybersecurity.

As in data mining that can track you across multiple social media sites, old email posts, etc.

Curious that it is always phrased in terms of government or big corporations spying on little people.

Since there are a lot more “little people,” shouldn’t crowd sourcing data mining of governments and big corporations work the other way too?

And for that matter, like the BLM (Bureau of Land Management), there really isn’t any “government,” or “government agency” that is responsible for harm to the public’s welfare.

There are specific people with relationships to the oil and gas industry, meetings, etc.

Let’s use data mining to pierce the government veil!

VFR MAP

Filed under: Mapping,Maps — Patrick Durusau @ 1:31 pm

VFR MAP

From the about:

Here you will find

  • Seamlessly stitched VFR and IFR aeronautical charts
  • A searchable Airport / Facility Directory
  • Terminal Procedure Publications
  • Real-time weather

VFR MAP is optimized for mobile devices. Try us on your Android phone, iPhone, or iPad (or click here to see some screenshots).

Plus Google maps for terrain, satellite and roads.

Quite a remarkable site.

What would you want to combine with these maps?

Named entity extraction

Filed under: Entity Extraction,Named Entity Mining,Natural Language Processing — Patrick Durusau @ 1:31 pm

Named entity extraction

From the webpage:

The techniques we discussed in the Cleanup and Reconciliation parts come in very handy when your data is already in a structured format. However, many fields (notoriously description) contain unstructured text, yet they usually convey a high amount of interesting information. To capture this in machine-processable format, named entity recognition can be used.

A Google Refine / OpenRefine extension developed by Multimedia Lab (ELIS — Ghent University / iMinds) and MasTIC (Université Libre de Bruxelles.

Described in: Named-Entity Recognition: A Gateway Drug for Cultural Heritage Collections to the Linked Data Cloud?

Abstract:

Unstructured metadata fields such as ‘description’ offer tremendous value for users to understand cultural heritage objects. However, this type of narrative information is of little direct use within a machine-readable context due to its unstructured nature. This paper explores the possibilities and limitations of Named-Entity Recognition (NER) to mine such unstructured metadata for meaningful concepts. These concepts can be used to leverage otherwise limited searching and browsing operations, but they can also play an important role to foster Digital Humanities research. In order to catalyze experimentation with NER, the paper proposes an evaluation of the performance of three thirdparty NER APIs through a comprehensive case study, based on the descriptive fields of the Smithsonian Cooper-Hewitt National Design Museum in New York. A manual analysis is performed of the precision, recall, and F-score of the concepts identified by the third party NER APIs. Based on the outcomes of the analysis, the conclusions present the added value of NER services, but also point out to the dangers of uncritically using NER, and by extension Linked Data principles, within the Digital Humanities. All metadata and tools used within the paper are freely available, making it possible for researchers and practitioners to repeat the methodology. By doing so, the paper offers a significant contribution towards understanding the value of NER for the Digital Humanities.

I commend the paper to you for a very close reading, particularly those of you in the humanities.

To conclude, the Digital Humanities need to launch a broader debate on how we can incorporate within our work the probabilistic character of tools such as NER services. Drucker eloquently states that ‘we use tools from disciplines whose epistemological foundations are at odds with, or even hostile to, the humanities. Positivistic, quantitative and reductive, these techniques preclude humanistic methods because of the very assumptions on which they are designed: that objects of knowledge can be understood as ahistorical and autonomous.’

Drucker, J. (2012), Debates in the Digital Humanities, Minesota Press, chapter Humanistic Theory and Digital Scholarship, pp. 85–95.

…that objects of knowledge can be understood as ahistorical and autonomous.

Certainly possible, but lossy, very lossy, in my view.

You?

February 27, 2013

URL Homonym Problem: A Topic Map Solution

Filed under: Homonymous,HTML5,W3C — Patrick Durusau @ 5:34 pm

You may have heard about the URL homonym problem.

The term “URL” is spelled and pronounced the same way but can mean:

URL as defined by Uniform Resource Identifier (URI): Generic Syntax, RFC 3986, or

URL as defined by HTML5 (Draft, December 17, 2012)

To refresh your memory:

URL in RFC 3986 is defined as:

The term “Uniform Resource Locator” (URL) refers to the subset of URIs that, in addition to identifying a resource, provide a means of locating the resource by describing its primary access mechanism (e.g., its network “location”).

A URL in RFC 3986 is a subtype of URI.

URL in HTML5 is defined as:

A URL is a string used to identify a resource.

A URL in HTML5 is a supertype of URI and IRI.

I would say that going from being a subtype of URI to being a supertype of URI + IRI is a “…willful violation of RFC 3986….”

In LTM syntax, I would solve the URL homonym problem as follows:

#VERSION "1.3"

/* association types */

[supertype-subtype = "Supertype-subtype";
@"http://psi.topicmaps.org/iso13250/model/supertype-subtype"]

[supertype = "Supertype";
@"http://psi.topicmaps.org/iso13250/model/supertype"]

[subtype = "Subtype";
@"http://psi.topicmaps.org/iso13250/model/subtype"]

/* topics */

[uri = "URI";
@"http://tools.ietf.org/html/rfc3986#1.1"]

[url-rfc3986 = "URL";;"URL-RFC 3986"
@"http://tools.ietf.org/html/rfc3986#1.1.3"]

supertype-subtype(uri : supertype,url-rfc3986 : subtype)

[url-html5 = "URL";;"URL-HTML5"
@"http://www.w3.org/TR/2012/CR-html5-20121217/infrastructure.html#urls"]

supertype-subtype(url-html5 : supertype,uri : subtype)

A solution to the URL homonym problem only in the sense of distinguishing which definition is in use.

R and Hadoop Data Analysis – RHadoop

Filed under: Hadoop,R,RHadoop — Patrick Durusau @ 5:34 pm

R and Hadoop Data Analysis – RHadoop by Istvan Szegedi.

From the post:

R is a programming language and a software suite used for data analysis, statistical computing and data visualization. It is highly extensible and has object oriented features and strong graphical capabilities. At its heart R is an interpreted language and comes with a command line interpreter – available for Linux, Windows and Mac machines – but there are IDEs as well to support development like RStudio or JGR.

R and Hadoop can complement each other very well, they are a natural match in big data analytics and visualization. One of the most well-known R packages to support Hadoop functionalities is RHadoop that was developed by RevolutionAnalytics.

Nice introduction that walks you through installation and illustrates the use of RHadoop for analysis.

The ability to analyze “big data” is becoming commonplace.

The more that becomes a reality, the greater the burden on the user to critically evaluate the analysis that produced the “answers.”

Yes, repeatable analysis yielded answer X, but that just means applying the same assumptions to the same data gave the same result.

The same could be said about division by zero, although no one would write home about it.

Big Data Central

Filed under: BigData,Hadoop,MapReduce — Patrick Durusau @ 5:34 pm

Big Data Central by LucidWorks™

From LucidWorks™ Launches Big Data Central:

The new website, Big Data Central, is meant to become the primary source of educational materials, case studies, trends, and insights that help companies navigate the changing data management landscape. At Big Data Central, visitors can find, and contribute to, a wide variety of information including:

  • Use cases and best practices that highlight lessons learned from peers
  • Industry and analyst reports that track trends and hot topics
  • Q&As that answer some of the most common questions plaguing firms today about Big Data implementations

Definitely one for the news feed!

Did EMC Just Say Fork You To The Hadoop Community? [No,…]

Filed under: Hadoop,Open Source — Patrick Durusau @ 5:34 pm

Did EMC Just Say Fork You To The Hadoop Community? by Shaun Connolly.

I need to quote Shaun for context before I explain why my answer is no.

All in on Hadoop?

Glancing at the Pivotal HD diagram in the GigaOM article, they’ve made it easy to distinguish the EMC proprietary components in Blue from the Apache Hadoop-related components in Green. And based on what Scott Yara says “We literally have over 300 engineers working on our Hadoop platform”.

Wow, that’s a lot of engineers focusing on Hadoop! Since Scott Yara admitted that “We’re all in on Hadoop, period.”, a large number of those engineers must be working on the open source Apache Hadoop-related projects labeled in Green in the diagram, right?

So a simple question is worth asking: How many of those 300 engineers are actually committers* to the open source projects Apache Hadoop, Apache Hive, Apache Pig, and Apache HBase?

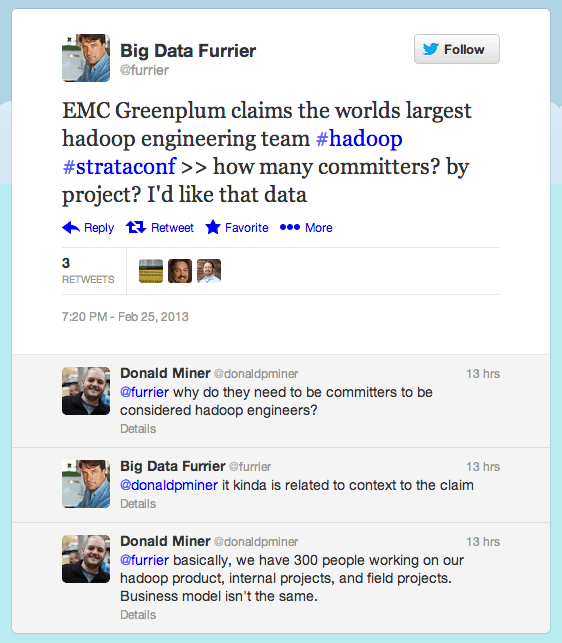
John Furrier actually asked this question on Twitter and got a reply from Donald Miner from the Greenplum team. The thread is as follows:

tweet thread

Since I agree with John Furrier that understanding the number of committers is kinda related to the context of Scott Yara’s claim, I did a quick scan through the committers pages for Hadoop, Hive, Pig and HBase to seek out the large number of EMC engineers spending their time improving these open source projects. Hmmm….my quick scan yielded a curious absence of EMC engineers directly contributing to these Apache projects. Oh well, I guess the vast majority of those 300 engineers are working on the EMC proprietary technology in the blue boxes.

Why Do Committers Matter?

Simply put: Just because you can read Moby-Dick doesn’t make you talented enough to have authored it.

Committers matter because they are the talented authors who devote their time and energy on working within the Apache Software Foundation community adding features, fixing bugs, and reviewing and approving changes submitted by the other committers. At Hortonworks, we have over 50 committers, across the various Hadoop-related projects, authoring code and working with the community to make their projects better.

This is simply how the community-driven open source model works. And believe it or not, you actually have to be in the community before you can claim you are leading the community and authoring the code!

So when EMC says they are “all-in on Hadoop” but have nary a committer in sight, then that must mean they are “all-in for harvesting the work done by others in the Hadoop community”. Kind of a neat marketing trick, don’t you think?

Scott Yara effectively says that it would take about $50 to $100 million dollars and 300 engineers to do what they’ve done. Sounds expensive, hard, and untouchable doesn’t it? Well, let’s take a close look at the Apache Hadoop community in comparison. Over the lifetime of just the Apache Hadoop project, there have been over 1200 people across more than 80 different companies or entities who have contributed code to Hadoop. Mr. Yara, I’ll see your 300 and raise you a community!

I say no because I remember another Apache project, the Apache webserver.

At last count, the Apache webserver has 63% of the market. The nearest competitor is Microsoft-IIS with 16.6%. Microsoft is in the Hadoop fold thanks to Hortonworks. Assuming Nginx to be the equivalent of Cloudera, there is another 15% of the market. (From Usage of web servers for websites)

If my math is right, that’s approximately 95% of the market.*

The longer EMC remains in self-imposed exile, the more its “Hadoop improvements” will drift from the mainstream releases.

So, my answer is: No, EMC has announced they are forking themselves.

That will carry reward enough without the Hadoop community fretting over much about it.


* Yes, the market share is speculation on my part but has more basis in reality than Mandiant’s claims about Chinese hackers.

Apache Pig: It goes to 0.11

Filed under: Hadoop,MapReduce,Pig — Patrick Durusau @ 5:33 pm

Apache Pig: It goes to 0.11

From the post:

After months of work, we are happy to announce the 0.11 release of Apache Pig. In this blog post, we highlight some of the major new features and performance improvements that were contributed to this release. A large chunk of the new features was created by Google Summer of Code (GSoC) students with supervision from the Apache Pig PMC, while the core Pig team focused on performance improvements, usability issues, and bug fixes. We encourage CS students to consider applying for GSOC in 2013 — it’s a great way to contribute to open source software.

This blog post hits some of the highlights of the release. Pig users may also find a presentation by Daniel Dai, which includes code and output samples for the new operators, helpful.

And from Hortonworks’ post on the release:

  • A DateTime datatype, documentation here.
  • A RANK function, documentation here.
  • A CUBE operator, documentation here.
  • Groovy UDFs, documentation here.

If you remember Robert Barta’s Cartesian expansion of tuples, you will find it in the CUBE operator.

Microsoft and Hadoop, Sitting in a Tree…*

Filed under: Hadoop,Hortonworks,MapReduce,Microsoft — Patrick Durusau @ 2:55 pm

Putting the Elephant in the Window by John Kreisa.

From the post:

For several years now Apache Hadoop has been fueling the fast growing big data market and has become the defacto platform for Big Data deployments and the technology foundation for an explosion of new analytic applications. Many organizations turn to Hadoop to help tame the vast amounts of new data they are collecting but in order to do so with Hadoop they have had to use servers running the Linux operating system. That left a large number of organizations who standardize on Windows (According to IDC, Windows Server owned 73 percent of the market in 2012 – IDC, Worldwide and Regional Server 2012–2016 Forecast, Doc # 234339, May 2012) without the ability to run Hadoop natively, until today.

We are very pleased to announce the availability of Hortonworks Data Platform for Windows providing organizations with an enterprise-grade, production-tested platform for big data deployments on Windows. HDP is the first and only Hadoop-based platform available on both Windows and Linux and provides interoperability across Windows, Linux and Windows Azure. With this release we are enabling a massive expansion of the Hadoop ecosystem. New participants in the community of developers, data scientist, data management professionals and Hadoop fans to build and run applications for Apache Hadoop natively on Windows. This is great news for Windows focused enterprises, service provides, software vendors and developers and in particular they can get going today with Hadoop simply by visiting our download page.

This release would not be possible without a strong partnership and close collaboration with Microsoft. Through the process of creating this release, we have remained true to our approach of community-driven enterprise Apache Hadoop by collecting enterprise requirements, developing them in open source and applying enterprise rigor to produce a 100-precent open source enterprise-grade Hadoop platform.

Now there is a very smart marketing move!

A smaller share of a larger market is always better than a large share of a small market.

(You need to be writing down these quips.) 😉

Seriously, take note of how Hortonworks used the open source model.

They did not build Hadoop in their image and try to sell it to the world.

Hortonworks gathered requirements from others and built Hadoop to meet their needs.

Open source model in both cases, very different outcomes.

* I didn’t remember the rhyme beyond the opening line. Consulting the oracle (Wikipedia), I discovered Playground song. 😉

School of Data

Filed under: Data,Education,Marketing,Topic Maps — Patrick Durusau @ 2:55 pm

School of Data

From their “about:”

School of Data is an online community of people who are passionate about using data to improve our understanding of the world, in particular journalists, researchers and analysts.

Our mission

Our aim is to spread data literacy through the world by offering online and offline learning opportunities. With School of Data you’ll learn how to:

  • scout out the best data sources
  • speed up and hone your data handling and analysis
  • visualise and present data creatively

Readers of this blog are very unlikely to find something they don’t know at this site.

However, readers of this blog know a great deal that doesn’t appear on this site.

Such as information on topic maps? Yes?

Something to think about.

I can’t really imagine data literacy without some awareness of subject identity issues.

Once you get to subject identity issues, semantic diversity, topic maps are just an idle thought away!

I first saw this at Nat Torkington’s Four Short Links: 26 Feb 2013.

Graphic presentation by Willard Cope Brinton

Filed under: Graphics,Visualization — Patrick Durusau @ 2:54 pm

Graphic presentation by Willard Cope Brinton by Prof. Michael Stoll.

From the post:

Prof. Michael Stoll has scanned and uploaded a great amount of pages from Willard Cope Brinton’s second book “Graphic Presentation“. The set features some excellent vintage visualizations all dated before 1939.

Yes, Virginia, there were visualizations before computer graphics. 😉

An Interactive Analysis of Tolkien’s Works

Filed under: Graphics,Literature,Text Analytics,Text Mining,Visualization — Patrick Durusau @ 2:54 pm

An Interactive Analysis of Tolkien’s Works by Emil Johansson.

Description:

Being passionate about both Tolkien and data visualization creating an interactive analysis of Tolkien’s books seemed like a wonderful idea. To the left you will be able to explore character mentions and keyword frequency as well as sentiment analysis of the Silmarillion, the Hobbit and the Lord of the Rings. Information on editions of the books and methods used can be found in the about section.

There you will find:

WORD COUNT AND DENSITY
CHARACTER MENTIONS
KEYWORD FREQUENCY
COMMON WORDS
SENTIMENT ANALYSIS
CHARACTER CO-OCCURENCE
CHAPTER LENGTHS
WORD APPEARANCE
POSTERS

Truly remarkable analysis and visualization!

I suspect users of this portal don’t wonder so much about “how” is it done, but concentrate on the benefits it brings.

Does that sound like a marketing idea for topic maps?

I first saw this in the DashingD3js.com Weekly Newsletter.

D3.js Gallery – A Filterable Gallery of D3.js Examples

Filed under: D3,Graphics,Visualization — Patrick Durusau @ 2:54 pm

D3.js Gallery – A Filterable Gallery of D3.js Examples

Description:

This filterable gallery of examples for D3.js is an alternative to the official wiki gallery. Filtering makes it easier to search by author, visualization type and so on. You can also share the url to a filtered result gallery. (From the DashingD3js.com Weekly Newsletter.)

Don’t be discouraged on the author filter, not all the visualizations are from Mike Bostock. 😉

It is a real visual treat. Take the time to visit even if you aren’t looking for that “special” visualization.

February 26, 2013

Simple Web Semantics: Multiple Dictionaries

Filed under: Semantic Web,Semantics,Simple Web Semantics — Patrick Durusau @ 2:06 pm

When I last posted about Simple Web Semantics, my suggested syntax was:

Simple Web Semantics (SWS) – Syntax Refinement

While you can use any one of multiple dictionaries for the URI in an <a> element, that requires manual editing of the source HTML.

Here is an improvement on that idea:

The content of the content attribute on a meta element with a name attribute with the value “dictionary” is one or more “URLs” (in the HTML 5 sense), if more than one, the “URLs” are separated by whitespace.

The content of the dictionary attribute on an a element is one or more “URLs” (in the HTML 5 sense), if more than one, the “URLs” are separated by whitespace.

Thinking that enables authors of content to give users choices as to which dictionaries to use with particular “URLs.”

For example, a popular account of a science experiment could use the term, H2O and have a dictionary entry pointing to: http://upload.wikimedia.org/wikipedia/commons/thumb/c/c2/SnowflakesWilsonBentley.jpg/220px-SnowflakesWilsonBentley.jpg, which produces this image:

snowflakes

Which would be a great illustration for a primary school class about a form of H2O.

On the other hand, another dictionary entry for the same URL might point to: http://upload.wikimedia.org/wikipedia/commons/thumb/0/03/Liquid-water-and-ice.png/220px-Liquid-water-and-ice.png, which produces this image:

ice structure

Which would be more appropriate for a secondary school class.

Writing this for an inline <a> element, I would write:

<a href="http://en.wikipedia.org/wiki/Water" dictionary="http://upload.wikimedia.org/wikipedia/commons/
thumb/c/c2/SnowflakesWilsonBentley.jpg/220px-SnowflakesWilsonBentley.jpg http://upload.wikimedia.org/wikipedia/commons/
thumb/0/03/Liquid-water-and-ice.png/220px-Liquid-water-and-ice.png">H2O</a>

The use of a “URL” and images all from Wikipedia is just convenience for this example. Dictionary entries are not tied to the “URL” in the href attribute.

That presumes some ability on the part of the dictionary server to respond with meaningful information to display to a user who must choose between two dictionaries.

Enabling users to have multiple sources of additional information at their command versus the simplicity of a single dictionary, seems like a good choice.

Nothing prohibits a script writer from enabling users to insert their own dictionary preferences either for the document as a whole or for individual <a> elements.

If you missed my series on Simple Web Semantics, see: Simple Web Semantics — Index Post.


Apologies for quoting “URL/s” throughout the post but after reading:

Note: The term “URL” in this specification is used in a manner distinct from the precise technical meaning it is given in RFC 3986. Readers familiar with that RFC will find it easier to read this specification if they pretend the term “URL” as used herein is really called something else altogether. This is a willful violation of RFC 3986. [RFC3986]

in the latest HTML5 draft, it seemed like the right thing to do.

Would it have been too much trouble to invent “something else altogether” for this new meaning of “URL?”

Ocean Data Interoperability Platform (ODIP)

Filed under: Interoperability,Open Data — Patrick Durusau @ 1:53 pm

Ocean Data Interoperability Platform (ODIP)

From the post:

The Ocean Data Interoperability Platform (ODIP) is a 3-year initiative (2013-2015) funded by the European Commission under the Seventh Framework Programme. It aims to contribute to the removal of barriers hindering the effective sharing of data across scientific domains and international boundaries.

ODIP brings together 11 organizations from United Kingdom, Italy, Belgium, The Netherlands, Greece and France with the objective to provide a forum to harmonise the diverse regional systems.

The First Workshop will take place from Monday 25 February 2013 to and including Thursday 28 February 2013. More information about the workshop at 1st ODIP Workshop.

From the workshop page, a listing of topics with links to further materials:

Gathering a snapshot of our present day semantic diversity is an extremely useful exercise. Whatever your ultimate choice for a “solution.”

WikiSynonyms: Find synonyms using Wikipedia redirects

Filed under: Synonymy,Wikipedia — Patrick Durusau @ 1:53 pm

WikiSynonyms: Find synonyms using Wikipedia redirects by Panos Ipeirotis.

Many many years back, I worked with Wisam Dakka on a paper to create faceted interfaced for text collections. One of the requirements for that project was to discover synonyms for named entities. While we explored a variety of directions, the one that I liked most was Wisam’s idea to use the Wikipedia redirects to discover terms that are mostly synonymous.

Did you know, for example, that ISO/IEC 14882:2003 and X3J16 are synonyms of C++? Yes, me neither. However, Wikipedia reveals that through its redirect structure.

This rocks!

Talk about an easy path to populating variant names for a topic map!

Complete with examples, code, suggestions on hacking Wikipedia data sets (downloaded).

AstroML: data mining and machine learning for Astronomy

Filed under: Astroinformatics,Data Mining,Machine Learning — Patrick Durusau @ 1:53 pm

AstroML: data mining and machine learning for Astronomy by Jake Vanderplas, Alex Gray, Andrew Connolly and Zeljko Ivezic.

Description:

Python is currently being adopted as the language of choice by many astronomical researchers. A prominent example is in the Large Synoptic Survey Telescope (LSST), a project which will repeatedly observe the southern sky 1000 times over the course of 10 years. The 30,000 GB of raw data created each night will pass through a processing pipeline consisting of C++ and legacy code, stitched together with a python interface. This example underscores the need for astronomers to be well-versed in large-scale statistical analysis techniques in python. We seek to address this need with the AstroML package, which is designed to be a repository for well-tested data mining and machine learning routines, with a focus on applications in astronomy and astrophysics. It will be released in late 2012 with an associated graduate-level textbook, ‘Statistics, Data Mining and Machine Learning in Astronomy’ (Princeton University Press). AstroML leverages many computational tools already available available in the python universe, including numpy, scipy, scikit- learn, pymc, healpy, and others, and adds efficient implementations of several routines more specific to astronomy. A main feature of the package is the extensive set of practical examples of astronomical data analysis, all written in python. In this talk, we will explore the statistical analysis of several interesting astrophysical datasets using python and astroML.

AstroML at Github:

AstroML is a Python module for machine learning and data mining built on numpy, scipy, scikit-learn, and matplotlib, and distributed under the 3-clause BSD license. It contains a growing library of statistical and machine learning routines for analyzing astronomical data in python, loaders for several open astronomical datasets, and a large suite of examples of analyzing and visualizing astronomical datasets.

The goal of astroML is to provide a community repository for fast Python implementations of common tools and routines used for statistical data analysis in astronomy and astrophysics, to provide a uniform and easy-to-use interface to freely available astronomical datasets. We hope this package will be useful to researchers and students of astronomy. The astroML project was started in 2012 to accompany the book Statistics, Data Mining, and Machine Learning in Astronomy by Zeljko Ivezic, Andrew Connolly, Jacob VanderPlas, and Alex Gray, to be published in early 2013.

The book, Statistics, Data Mining, and Machine Learning in Astronomy by Zeljko Ivezic, Andrew Connolly, Jacob VanderPlas, and Alex Gray, is not yet listed by Princeton University Press. 🙁

I have subscribed to their notice service and will post a note when it appears.

EU Commission – Open Data Portal Open

Filed under: EU,Government,Government Data,Transparency — Patrick Durusau @ 1:53 pm

EU Commission – Open Data Portal Open

From the post:

The European Union Commission has unveiled a new Open Data Portal, with over 5,580 data sets – the majority of which comes from the Eurostat (the statistical office of the European Union). The portal is the result of the Commission’s ‘Open Data Strategy for Europe’, and will publish data from the European Commission and other bodies of the European Union; it already holds data from the European Environment Agency.

The portal has a SPARQL endpoint to provide linked data, and will also feature applications that use this data. The published data can be downloaded by everyone interested to facilitate reuse, linking and the creation of innovative services. This shows the commitment of the Commission to the principles of openness and transparency.

For more information https://ec.europa.eu/digital-agenda/en/blog/eu-open-data-portal-here.

If the Commission is committed to “principles of openness and transparency, when can we expect to see:

  1. Rosters of the institutions and individual participants in EU funded research from 1980 to present?
  2. Economic analysis of the results of EU funded projects, on a project by project basis, from 1980 to present?

Noting from 1984 – 2013, the total research funding exceeds EUR 118 billion.

To be fair, CORDIS: Community Research and Development Information Service has report summaries and project reports for FP5, FP6 and FP7. And CORDIS Search Service provides coverage back to the early 1980’s.

About Projects on Cordis has a wealth of information to guide searching into EU funded research.

While a valuable resource, CORDIS requires the extraction of detailed information on a project by project basis, making large scale analysis difficult if not prohibitively expensive.

PS: Of the 5855 datasets, some 5680 datasets, were previously published by EuroStat. European Environmental Agency, 106 datasets. Perhaps a net increase of 59 datasets over those previously available.

PyData Videos

Filed under: Data,Python — Patrick Durusau @ 1:53 pm

PyData Videos

All great but here are five (5) to illustrate the range of what awaits:

Connecting Data Science to business value, Josh Hemann.

GPU and Python, Andreas Klöckner, Ph.D.

Network X and Gephi, Gilad Lotan.

NLTK and Text Processing, Andrew Montalenti.

Wikipedia Indexing And Analysis, Didier Deshommes.

Forty-seven (47) videos in all so my list is missing forty-two (42) other great ones!

Which ones are your favorites?

Naming U.S. Statues

Filed under: Government,Law,Law - Sources,Legal Informatics — Patrick Durusau @ 1:53 pm

Strause et al.: How Federal Statutes Are Named, and the Yale Database of Federal Statute Names

Centers on How Federal Statutes Are Named, by Renata E.B. Strause, Allyson R. Bennett, Caitlin B. Tully, M. Douglass Bellis, and Eugene R. Fidell
Law Library Journal, 105, 7-30 (2013), but includes references to a other U.S. statute name resources.

Quite useful if you are developing any indexing/topic map service that involves U.S. statutes.

There is mention of a popular name for French statues resource.

I assume there are similar resources for other legal jurisdictions. If you know of such resources, I am sure the Legal Informatics Blog would be interested.

Wikipedia and Legislative Data Workshop

Filed under: Law,Law - Sources,Wikipedia — Patrick Durusau @ 1:52 pm

Wikipedia and Legislative Data Workshop

From the post:

Interested in the bills making their way through Congress?

Think they should be covered well in Wikipedia?

Well, let’s do something about it!

On Thursday and Friday, March 14th and 15th, we are hosting a conference here at the Cato Institute to explore ways of using legislative data to enhance Wikipedia.

Our project to produce enhanced XML markup of federal legislation is well under way, and we hope to use this data to make more information available to the public about how bills affect existing law, federal agencies, and spending, for example.

What better way to spread knowledge about federal public policy than by supporting the growth of Wikipedia content?

Thursday’s session is for all comers. Starting at 2:30 p.m., we will familiarize ourselves with Wikipedia editing and policy, and at 5:30 p.m. we’ll have a Sunshine Week reception. (You don’t need to attend in the afternoon to come to the reception. Register now!)

On Friday, we’ll convene experts in government transparency, in Wikipedia editorial processes and decisions, and in MediaWiki technology to think things through and plot a course.

I remain unconvinced about greater transparency into the “apparent” legislative process.

On the other hand, it may provide the “hook” or binding point to make who wins and who loses more evident.

If the Cato representatives mention their ideals being founded in the 18th century, you might want to remember that infant mortality was greater than 40% in foundling hospitals of the time.

People who speak glowingly of the 18th century didn’t live in the 18th century. And imagine themselves as landed gentry of the time.

I first saw this at the Legal Informatics Blog.

neo4j/cypher: Combining COUNT and COLLECT in one query

Filed under: Cypher,Neo4j — Patrick Durusau @ 1:52 pm

neo4j/cypher: Combining COUNT and COLLECT in one query by Mark Needham.

From the post:

In my continued playing around with football data I wanted to write a cypher query against neo4j which would show me which teams had missed the most penalties this season and who missed them.

Mark discovers queries with two aggregation expressions have problems but goes on to solve it as well.

Redis Data Structure Cheatsheet

Filed under: Data Types,Redis — Patrick Durusau @ 1:52 pm

Redis Data Cheatsheet by Brian P O’Rourke.

From the post:

Redis data structures are simple – none of them are likely to be a perfect match for the problem you’re trying to solve. But if you pick the right initial structure for your data, Redis commands can guide you toward efficient ways to get what you need.

Here’s our standard reference table for Redis datatypes, their most common uses, and their most common misuses. We’ll have follow-up posts with more details, specific use-cases (and code), but this is a handy reference:

I created a PDF version of the Redis Datatypes — Uses and Misuses.

Thinking it would be easier to reference than bookmarking a post. Any errors introduced are solely my responsibility.

I first saw this at: Alex Popescu’s Redis – Pick the Right Data Structure.

February 25, 2013

Are Googly Eyes Spying (on you)?

Filed under: Cybersecurity,Searching,Security — Patrick Durusau @ 2:59 pm

Felix Salmon’s The long arm of the Google raises serious privacy issues.

A bond king recovering $10 million in stolen art warms everyone’s heart, but what other law enforcement searches are being done Google’s assistance?

Are they collecting data on searches for:

  • “Root kit”
  • Bomb making
  • Cybersecurity
  • Sources of guns or ammunition
  • Partners with sexual preferences
  • Your searches correlated with those of others

Hard to say and I would not trust any answer from Google or law enforcement on the subject.

Avoiding script kiddie spying by search engines requires the use of proxy servers or services such as Tor (anonymity network).

But none of those methods is immune from attack and all require technical skill and vigilance on the part of a user.

Let me sketch out a possible solution, at least for web searching.

What if you had:

  1. A human search service to do a curated search
  2. The search results are packaged for HTTP pickup
  3. A web server running in no-log mode. Never logs any data. Can pass the ID of your search for retrieval but that is all that it knows.

Thinking of a curated search because you don’t have the full interactivity of a live search.

Having a person curate the results would get you higher quality results. Like using a librarian.

Would not be free but you would not have Google, local, state and federal law enforcement looking over your shoulder.

What is it they say?

Freedom is never free.

Older Posts »

Powered by WordPress