Another Word For It Patrick Durusau on Topic Maps and Semantic Diversity

December 14, 2017

Spatial Microsimulation with R – Public Policy Advocates Take Note

Filed under: Environment,R,Simulations — Patrick Durusau @ 11:28 am

Spatial Microsimulation with R by Robin Lovelace and Morgane Dumont.

Apologies for the long quote below but spatial microsimulation is unfamiliar enough that it merited an introduction in the authors’ own prose.

We have all attended public meetings where developers, polluters, landfill operators, etc., had charts, studies, etc., and the public was armed with, well, its opinions.

Spatial Microsimulation with R can put you in a position to offer alternative analysis, meaningfully ask for data used in other studies, in short, arm yourself with weapons long abused in public policy discussions.

From Chapter 1, 1.2 Motivations:


Imagine a world in which data on companies, households and governments were widely available. Imagine, further, that researchers and decision-makers acting in the public interest had tools enabling them to test and model such data to explore different scenarios of the future. People would be able to make more informed decisions, based on the best available evidence. In this technocratic dreamland pressing problems such as climate change, inequality and poor human health could be solved.

These are the types of real-world issues that we hope the methods in this book will help to address. Spatial microsimulation can provide new insights into complex problems and, ultimately, lead to better decision-making. By shedding new light on existing information, the methods can help shift decision-making processes away from ideological bias and towards evidence-based policy.

The ‘open data’ movement has made many datasets more widely available. However, the dream sketched in the opening paragraph is still far from reality. Researchers typically must work with data that is incomplete or inaccessible. Available datasets often lack the spatial or temporal resolution required to understand complex processes. Publicly available datasets frequently miss key attributes, such as income. Even when high quality data is made available, it can be very difficult for others to check or reproduce results based on them. Strict conditions inhibiting data access and use are aimed at protecting citizen privacy but can also serve to block democratic and enlightened decision making.

The empowering potential of new information is encapsulated in the saying that ‘knowledge is power’. This helps explain why methods such as spatial microsimulation, that help represent the full complexity of reality, are in high demand.

Spatial microsimulation is a growing approach to studying complex issues in the social sciences. It has been used extensively in fields as diverse as transport, health and education (see Chapter ), and many more applications are possible. Fundamental to the approach are approximations of individual level data at high spatial resolution: people allocated to places. This spatial microdata, in one form or another, provides the basis for all spatial microsimulation research.

The purpose of this book is to teach methods for doing (not reading about!) spatial microsimulation. This involves techniques for generating and analysing spatial microdata to get the ‘best of both worlds’ from real individual and geographically-aggregated data. Population synthesis is therefore a key stage in spatial microsimulation: generally real spatial microdata are unavailable due to concerns over data privacy. Typically, synthetic spatial microdatasets are generated by combining aggregated outputs from Census results with individual level data (with little or no geographical information) from surveys that are representative of the population of interest.

The resulting spatial microdata are useful in many situations where individual level and geographically specific processes are in operation. Spatial microsimulation enables modelling and analysis on multiple levels. Spatial microsimulation also overlaps with (and provides useful initial conditions for) agent-based models (see Chapter 12).

Despite its utility, spatial microsimulation is little known outside the fields of human geography and regional science. The methods taught in this book have the potential to be useful in a wide range of applications. Spatial microsimulation has great potential to be applied to new areas for informing public policy. Work of great potential social benefit is already being done using spatial microsimulation in housing, transport and sustainable urban planning. Detailed modelling will clearly be of use for planning for a post-carbon future, one in which we stop burning fossil fuels.

For these reasons there is growing interest in spatial microsimulation. This is due largely to its practical utility in an era of ‘evidence-based policy’ but is also driven by changes in the wider research environment inside and outside of academia. Continued improvements in computers, software and data availability mean the methods are more accessible than ever. It is now possible to simulate the populations of small administrative areas at the individual level almost anywhere in the world. This opens new possibilities for a range of applications, not least policy evaluation.

Still, the meaning of spatial microsimulation is ambiguous for many. This book also aims to clarify what the method entails in practice. Ambiguity surrounding the term seems to arise partly because the methods are inherently complex, operating at multiple levels, and partly due to researchers themselves. Some uses of the term ‘spatial microsimulation’ in the academic literature are unclear as to its meaning; there is much inconsistency about what it means. Worse is work that treats spatial microsimulation as a magical black box that just ‘works’ without any need to describe, or more importantly make reproducible, the methods underlying the black box. This book is therefore also about demystifying spatial microsimulation.

If that wasn’t impressive enough, the authors:


We’ve put Spatial Microsimulation with R on-line because we want to reduce barriers to learning. We’ve made it open source via a GitHub repository because we believe in reproducibility and collaboration. Comments and suggests are most welcome there. If the content of the book helps your research, please cite it (Lovelace and Dumont, 2016).

How awesome is that!

Definitely a model for all of us to emulate!
February 16, 2017

Aerial Informatics and Robotics Platform [simulator]

Filed under: Machine Learning,Simulations — Patrick Durusau @ 8:35 pm

Aerial Informatics and Robotics Platform (Microsoft)

From the webpage:

Machine learning is becoming an increasingly important artificial intelligence approach to building autonomous and robotic systems. One of the key challenges with machine learning is the need for many samples — the amount of data needed to learn useful behaviors is prohibitively high. In addition, the robotic system is often non-operational during the training phase. This requires debugging to occur in real-world experiments with an unpredictable robot.

The Aerial Informatics and Robotics platform solves for these two problems: the large data needs for training, and the ability to debug in a simulator. It will provide realistic simulation tools for designers and developers to seamlessly generate the copious amounts of training data they need. In addition, the platform leverages recent advances in physics and perception computation to create accurate, real-world simulations. Together, this realism, based on efficiently generated ground truth data, enables the study and execution of complex missions that might be time-consuming and/or risky in the real-world. For example, collisions in a simulator cost virtually nothing, yet provide actionable information for improving the design.

Open source simulator from Microsoft for drones.

How very cool!

Imagine training your drone to search for breaches of the Dakota Access pipeline.

Or how to react when it encounters hostile drones.

Enjoy!

August 14, 2016

Simit: A Language for Physical Simulation

Filed under: Graphs,Hypergraphs,Simulations — Patrick Durusau @ 9:28 pm

Simit: A Language for Physical Simulation by Fredrik Kjolstad, et al.

Abstract:

With existing programming tools, writing high-performance simulation code is labor intensive and requires sacrificing readability and portability. The alternative is to prototype simulations in a high-level language like Matlab, thereby sacrificing performance. The Matlab programming model naturally describes the behavior of an entire physical system using the language of linear algebra. However, simulations also manipulate individual geometric elements, which are best represented using linked data structures like meshes. Translating between the linked data structures and linear algebra comes at significant cost, both to the programmer and to the machine. High-performance implementations avoid the cost by rephrasing the computation in terms of linked or index data structures, leaving the code complicated and monolithic, often increasing its size by an order of magnitude.

In this article, we present Simit, a new language for physical simulations that lets the programmer view the system both as a linked data structure in the form of a hypergraph and as a set of global vectors, matrices, and tensors depending on what is convenient at any given time. Simit provides a novel assembly construct that makes it conceptually easy and computationally efficient to move between the two abstractions. Using the information provided by the assembly construct, the compiler generates efficient in-place computation on the graph. We demonstrate that Simit is easy to use: a Simit program is typically shorter than a Matlab program; that it is high performance: a Simit program running sequentially on a CPU performs comparably to hand-optimized simulations; and that it is portable: Simit programs can be compiled for GPUs with no change to the program, delivering 4 to 20× speedups over our optimized CPU code.

Very deep sledding ahead but consider the contributions:


Simit is the first system that allows the development of physics code that is simultaneously:

Concise. The Simit language has Matlab-like syntax that lets algorithms be implemented in a compact, readable form that closely mirrors their mathematical expression. In addition, Simit matrices assembled from hypergraphs are indexed by hypergraph elements like vertices and edges rather than by raw integers, significantly simplifying indexing code and eliminating bugs.

Expressive. The Simit language consists of linear algebra operations augmented with control flow that let developers implement a wide range of algorithms ranging from finite elements for deformable bodies to cloth simulations and more. Moreover, the powerful hypergraph abstraction allows easy specification of complex geometric data structures.

Fast. The Simit compiler produces high-performance executable code comparable to that of hand-optimized end-to-end libraries and tools, as validated against the state-of-the-art SOFA [Faure et al. 2007] and Vega [Sin et al. 2013] real-time simulation frameworks. Simulations can now be written as easily as a traditional prototype and yet run as fast as a high-performance implementation without manual optimization.

Performance Portable. A Simit program can be compiled to both CPUs and GPUs with no additional programmer effort, while generating efficient code for each architecture. Where Simit delivers performance comparable to hand-optimized CPU code on the same processor, the same simple Simit program delivers roughly an order of magnitude higher performance on a modern GPU in our benchmarks, with no changes to the program.

Interoperable. Simit hypergraphs and program execution are exposed as C++ APIs, so developers can seamlessly integrate with existing C++ programs, algorithms, and libraries.
(emphasis in original)

Additional resources:

http://simit-lang.org/

Getting Started

Simit mailing list

Source code (MIT license)

Enjoy!

July 28, 2016

What That Election Probability Means
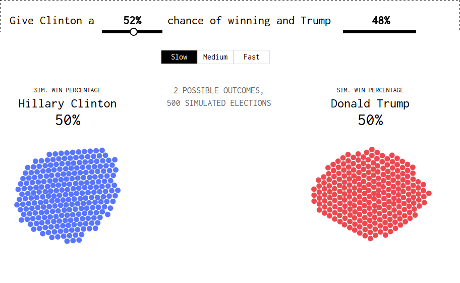
[500 Simulated Clinton-Trump Elections]

Filed under: Politics,Probability,Simulations,Visualization — Patrick Durusau @ 2:05 pm

What That Election Probability Means by Nathan Yau.

From the post:

We now have our presidential candidates, and for the next few months you get to hear about the changing probability of Hillary Clinton and Donald Trump winning the election. As of this writing, the Upshot estimates a 68% probability for Clinton and 32% for Donald Trump. FiveThirtyEight estimates 52% and 48% for Clinton and Trump, respectively. Forecasts are kind of all over the place this far out from November. Plus, the numbers aren’t especially accurate post-convention.

But the probabilities will start to converge and grow more significant.

So what does it mean when Clinton has a 68% chance of becoming president? What if there were a 90% chance that Trump wins?

Some interpret a high percentage as a landslide, which often isn’t the case with these election forecasts, and it certainly doesn’t mean the candidate with a low chance will lose. If this were the case, the Cleveland Cavaliers would not have beaten the Golden State Warriors, and I would not be sitting here hating basketball.

Fiddle with the probabilities in the graphic below to see what I mean.

As always, visualizations from Nathan are a joy to view and valuable in practice.

You need to run it several times but here’s the result I got with “FiveThirtyEight estimates 52% and 48% for Clinton and Trump, respectively.”

yau-simulation-460

You have to wonder what a similar simulation for breach/no-breach would look like for your enterprise?

Would that be an effective marketing tool for cybersecurity?

Perhaps not if you are putting insecure code on top of insecure code but there are other solutions.

For example, having state legislatures prohibit the operation of escape from liability clauses in EULAs.

Assuming someone who has read one in sufficient detail to draft legislation. 😉

That could be an interesting data project. Anyone have a pointer to a collection of EULAs?

December 9, 2014

Parable of the Polygons

Filed under: Politics,Simulations,Social Networks,Socioeconomic Data — Patrick Durusau @ 7:26 pm

Parable of the Polygons – A Playable Post on the Shape of Society by VI Hart and Nicky Case.

From the post:

This is a story of how harmless choices can make a harmful world.

A must play post!

Deeply impressive simulation of how segregation comes into being. Moreover, how small choices may not create the society you are trying to achieve.

Bear in mind that these simulations, despite being very instructive, are orders of magnitudes less complex than the social aspects of de jure segregation I grew up under as a child.

That complexity is one of the reasons the ham-handed social engineering projects of government, be they domestic or foreign rarely reach happy results. Some people profit, mostly the architects of such programs and the people they intended to help, well, decades later things haven’t changed all that much.

If you think you have the magic touch to engineer a group, locality, nation or the world, please try your hand at these simulations first. Bearing in mind that we have no working simulations of society that supports social engineering on the scale attempted by various nation states that come to mind.

Highly recommended!

PS: Creating alternatives to show the impacts of variations in data analysis would be quite instructive as well.

January 27, 2013

…[D]emocratization of modeling, simulations, and predictions

Filed under: Modeling,Prediction,Simulations — Patrick Durusau @ 5:43 pm

Technical engine for democratization of modeling, simulations, and predictions by Justyna Zander and Pieter J. Mosterman. (Justyna Zander and Pieter J. Mosterman. 2012. Technical engine for democratization of modeling, simulations, and predictions. In Proceedings of the Winter Simulation Conference (WSC ’12). Winter Simulation Conference , Article 228 , 14 pages.)

Abstract:

Computational science and engineering play a critical role in advancing both research and daily-life challenges across almost every discipline. As a society, we apply search engines, social media, and selected aspects of engineering to improve personal and professional growth. Recently, leveraging such aspects as behavioral model analysis, simulation, big data extraction, and human computation is gaining momentum. The nexus of the above facilitates mass-scale users in receiving awareness about the surrounding and themselves. In this paper, an online platform for modeling and simulation (M&S) on demand is proposed. It allows an average technologist to capitalize on any acquired information and its analysis based on scientifically-founded predictions and extrapolations. The overall objective is achieved by leveraging open innovation in the form of crowd-sourcing along with clearly defined technical methodologies and social-network-based processes. The platform aims at connecting users, developers, researchers, passionate citizens, and scientists in a professional network and opens the door to collaborative and multidisciplinary innovations. An example of a domain-specific model of a pick and place machine illustrates how to employ the platform for technical innovation and collaboration.

It is an interesting paper but when speaking of integration of models the authors say:

The integration is performed in multiple manners. Multi-domain tools that become accessible from one common environment using the cloud-computing paradigm serve as a starting point. The next step of integration happens when various M&S execution semantics (and models of computation (cf., Lee and Sangiovanni-Vincentelli 1998; Lee 2010) are merged and model transformations are performed.

That went by too quickly for me. You?

The question of effective semantic integration is an important one.

The U.S. federal government publishes enough data to map where some of the dark data is waiting to be found.

The good, bad or irrelevant data churned out every week, makes the amount of effort required an ever increasing barrier to its use by the public.

Perhaps that is by design?

What do you think?

January 23, 2013

Adaptive-network simulation library

Filed under: Adaptive Networks,Complex Networks,Networks,Simulations — Patrick Durusau @ 7:42 pm

Adaptive-network simulation library by Gerd Zschaler.

From the webpage:

The largenet2 library is a collection of C++ classes providing a framework for the simulation of large discrete adaptive networks. It provides data structures for an in-memory representation of directed or undirected networks, in which every node and link can have an integer-valued state.

Efficient access to (random) nodes and links as well as (random) nodes and links with a given state value is provided. A limited number of graph-theoretical measures is implemented, such as the (state-resolved) in- and out-degree distributions and the degree correlations (same-node and nearest-neighbor).

Read the tutorial here. Source code is available here.

A static topic map would not qualify as an adaptive network, but a dynamic, real time topic map system might have the characteristics of complex adaptive systems:

  • The number of elements is sufficiently large that conventional descriptions (e.g. a system of differential equations) are not only impractical, but cease to assist in understanding the system, the elements also have to interact and the interaction must be dynamic. Interactions can be physical or involve the exchange of information.
  • Such interactions are rich, i.e. any element in the system is affected by and affects several other systems.
  • The interactions are non-linear which means that small causes can have large results.
  • Interactions are primarily but not exclusively with immediate neighbours and the nature of the influence is modulated.
  • Any interaction can feed back onto itself directly or after a number of intervening stages, such feedback can vary in quality. This is known as recurrency.
  • Such systems are open and it may be difficult or impossible to define system boundaries
  • Complex systems operate under far from equilibrium conditions, there has to be a constant flow of energy to maintain the organization of the system
  • All complex systems have a history, they evolve and their past is co-responsible for their present behaviour
  • Elements in the system are ignorant of the behaviour of the system as a whole, responding only to what is available to it locally

The more dynamic the connections between networks, the closer we will move towards networks with the potential for adaptation.

That isn’t to say all networks will adapt at all or that those that do, will do it well.

Suspect adaption, like integration, is going to depend upon the amount of semantic information on hand.

You may also want to review: Largenet2: an object-oriented programming library for simulating large adaptive networks by Gerd Zschaler, and Thilo Gross. Bioinformatics (2013) 29 (2): 277-278. doi: 10.1093/bioinformatics/bts663

November 23, 2012

First Light for the Millennium Run Observatory

Filed under: Astroinformatics,Data Mining,Simulations — Patrick Durusau @ 11:29 am

First Light for the Millennium Run Observatory by Cmarchesin.

From the post:

The famous Millennium Run (MR) simulations now appear in a completely new light – literally. The project, led by Gerard Lemson of the MPA and Roderik Overzier of the University of Texas, combines detailed predictions from cosmological simulations with a virtual observatory in order to produce synthetic astronomical observations. In analogy to the moment when newly constructed astronomical observatories receive their “first light”, the Millennium Run Observatory (MRObs) has produced its first images of the simulated universe. These virtual observations allow theorists and observers to analyse the purely theoretical data in exactly the same way as they would purely observational data. Building on the success of the Millennium Run Database, the simulated observations are now being made available to the wider astronomical community for further study. The MRObs browser – a new online tool – allows users to explore the simulated images and interact with the underlying physical universe as stored in the database. The team expects that the advantages offered by this approach will lead to a richer collaboration between theoretical and observational astronomers.

At least with simulated observations, there is no need to worry about cloudy nights. 😉

Interesting in its own right but also as an example of yet another tool for data mining, that of simulation.

Not in the sense of generating “test” data but of deliberating altering data and then measuring the impact of the alterations on data mining tools.

Quite possibly in a double blind context where only some third party knows which data sets were “altered” until all tests have been performed.

Millennium Run Observatory Web Portal and access to the MRObs browser

Powered by WordPress