Another Word For It Patrick Durusau on Topic Maps and Semantic Diversity

January 4, 2017

Q&A Cathy O’Neil…

Filed under: BigData,Ethics,Mathematics,Modeling,Statistics — Patrick Durusau @ 2:30 pm

Q&A Cathy O’Neil, author of ‘Weapons of Math Destruction,’ on the dark side of big data by Christine Zhang.

From the post:

Cathy O’Neil calls herself a data skeptic. A former hedge fund analyst with a PhD in mathematics from Harvard University, the Occupy Wall Street activist left finance after witnessing the damage wrought by faulty math in the wake of the housing crash.

In her latest book, “Weapons of Math Destruction,” O’Neil warns that the statistical models hailed by big data evangelists as the solution to today’s societal problems, like which teachers to fire or which criminals to give longer prison terms, can codify biases and exacerbate inequalities. “Models are opinions embedded in mathematics,” she writes.

Great interview that hits enough high points to leave you wanting to learn more about Cathy and her analysis.

On that score, try:

Read her mathbabe blog.

Follow @mathbabedotorg.

Read Weapons of math destruction : how big data increases inequality and threatens democracy.

Try her new business: ORCAA [O’Neil Risk Consulting and Algorithmic Auditing].

From the ORCAA homepage:


ORCAA’s mission is two-fold. First, it is to help companies and organizations that rely on time and cost-saving algorithms to get ahead of this wave, to understand and plan for their litigation and reputation risk, and most importantly to use algorithms fairly.

The second half of ORCAA’s mission is this: to develop rigorous methodology and tools, and to set rigorous standards for the new field of algorithmic auditing.

There are bright line cases, sentencing, housing, hiring discrimination where “fair” has a binding legal meaning. And legal liability for not being “fair.”

Outside such areas, the search for “fairness” seems quixotic. Clients are entitled to their definitions of “fair” in those areas.

September 10, 2016

Weapons of Math Destruction:… [Constructive Knowledge of Discriminatory Impact?]

Filed under: Bias,Mathematics,Modeling — Patrick Durusau @ 8:03 pm

Weapons of Math Destruction: invisible, ubiquitous algorithms are ruining millions of lives by Cory Doctorow.

From the post:

I’ve been writing about the work of Cathy “Mathbabe” O’Neil for years: she’s a radical data-scientist with a Harvard PhD in mathematics, who coined the term “Weapons of Math Destruction” to describe the ways that sloppy statistical modeling is punishing millions of people every day, and in more and more cases, destroying lives. Today, O’Neil brings her argument to print, with a fantastic, plainspoken, call to arms called (what else?) Weapons of Math Destruction.

weapons-math-destruction-460

I’ve followed Cathy’s posts long enough to recommend Weapons of Math Destruction sight unseen. (Publication date September 6, 2016.)

Warning: If you read Weapons of Math Destruction, unlike executives who choose models based on their “gut,” or “instinct,” you may be charged with constructive knowledge of how you model discriminates against group X or Y.

If, like a typical Excel user, you can honestly say “I type in the numbers here and the output comes out there,” it’s going to be hard to prove any intent to discriminate.

You are no more responsible for a result than a pump handle is responsible for cholera.

Doctorow’s conclusion:


O’Neil’s book is a vital crash-course in the specialized kind of statistical knowledge we all need to interrogate the systems around us and demand better.

depends upon your definition of “better.”

“Better” depends on your goals or those of a client.

Yes?

PS: It is important to understand models/statistics/data so you can shape results to be your definition of “better.” But acknowledging all results are shaped. The critical question is “What shape do you want?”

April 10, 2016

Climate Change: Earth Surface Temperature Data

Filed under: Climate Data,Modeling — Patrick Durusau @ 4:17 pm

Climate Change: Earth Surface Temperature Data by Berkeley Earth.

From the webpage:

Some say climate change is the biggest threat of our age while others say it’s a myth based on dodgy science. We are turning some of the data over to you so you can form your own view.

Even more than with other data sets that Kaggle has featured, there’s a huge amount of data cleaning and preparation that goes into putting together a long-time study of climate trends. Early data was collected by technicians using mercury thermometers, where any variation in the visit time impacted measurements. In the 1940s, the construction of airports caused many weather stations to be moved. In the 1980s, there was a move to electronic thermometers that are said to have a cooling bias.

Given this complexity, there are a range of organizations that collate climate trends data. The three most cited land and ocean temperature data sets are NOAA’s MLOST, NASA’s GISTEMP and the UK’s HadCrut.

We have repackaged the data from a newer compilation put together by the Berkeley Earth, which is affiliated with Lawrence Berkeley National Laboratory. The Berkeley Earth Surface Temperature Study combines 1.6 billion temperature reports from 16 pre-existing archives. It is nicely packaged and allows for slicing into interesting subsets (for example by country). They publish the source data and the code for the transformations they applied. They also use methods that allow weather observations from shorter time series to be included, meaning fewer observations need to be thrown away.

All the computation on climate change is ironic in the face of a meteorologist, Edward R. Lorenz, publishing in 1963, Deterministic Nonperiodic Flow.

You may know that better as the “butterfly effect.” That very small changes in starting conditions can result in very large final states, which are not subject to prediction.

If you find Lorenz’s original paper tough sledding, you may enjoy When the Butterfly Effect Took Flight by Peter Dizikes. (Be aware the links to Lorenz papers in that post are broken, or at least appear to be today.)

In debates about limiting the increase in global temperature, recall that no one knows where any “tipping points” may lie along the way. That is the recognition of “tipping points” is always post tipping.

Given the multitude of uncertainties in modeling climate and the money to be made by solutions chosen or avoided, what do you think will be driving climate research? National interests and priorities or some other criteria?

PS: Full disclosure. Humanity has had, is having an impact on the climate and not for the better, at least in terms of human survival. Whether we are capable of changing human behavior enough to alter results that won’t be seen for fifty or more years remains to be seen.

February 19, 2016

OMOP Common Data Model V5.0

Filed under: Data Models,Medical Informatics,Modeling — Patrick Durusau @ 9:02 pm

OMOP Common Data Model V5.0

From the webpage:

The Observational Medical Outcomes Partnership (OMOP) was a public-private partnership established to inform the appropriate use of observational healthcare databases for studying the effects of medical products. Over the course of the 5-year project and through its community of researchers from industry, government, and academia, OMOP successfully achieved its aims to:

  1. Conduct methodological research to empirically evaluate the performance of various analytical methods on their ability to identify true associations and avoid false findings
  2. Develop tools and capabilities for transforming, characterizing, and analyzing disparate data sources across the health care delivery spectrum, and
  3. Establish a shared resource so that the broader research community can collaboratively advance the science.

The results of OMOP's research has been widely published and presented at scientific conferences, including annual symposia.

The OMOP Legacy continues…

The community is actively using the OMOP Common Data Model for their various research purposes. Those tools will continue to be maintained and supported, and information about this work is available in the public domain.

The OMOP Research Lab, a central computing resource developed to facilitate methodological research, has been transitioned to the Reagan-Udall Foundation for the FDA under the Innovation in Medical Evidence Development and Surveillance (IMEDS) Program, and has been re-branded as the IMEDS Lab. Learn more at imeds.reaganudall.org.

Observational Health Data Sciences and Informatics (OHDSI) has been established as a multi-stakeholder, interdisciplinary collaborative to create open-source solutions that bring out the value of observational health data through large-scale analytics. The OHDSI collaborative includes all of the original OMOP research investigators, and will develop its tools using the OMOP Common Data Model. Learn more at ohdsi.org.

The OMOP Common Data Model will continue to be an open-source, community standard for observational healthcare data. The model specifications and associated work products will be placed in the public domain, and the entire research community is encouraged to use these tools to support everybody's own research activities.

One of the many data models that will no doubt be in play as work begins on searching for a common cancer research language.

Every data model has a constituency, the trick is to find two or more where cross-mapping has semantic and hopefully financial ROI.

I first saw this in a tweet by Christophe Lalanne.

December 12, 2015

Data scientists: Question the integrity of your data [Relevance/Fitness – Not “Integrity”]

Filed under: Data Mining,Modeling — Patrick Durusau @ 3:19 pm

Data scientists: Question the integrity of your data by Rebecca Merrett.

From the post:

If there’s one lesson website traffic data can teach you, it’s that information is not always genuine. Yet, companies still base major decisions on this type of data without questioning its integrity.

At ADMA’s Advancing Analytics in Sydney this week, Claudia Perlich, chief scientist of Dstillery, a marketing technology company, spoke about the importance of filtering out noisy or artificial data that can skew an analysis.

“Big data is killing your metrics,” she said, pointing to the large portion of bot traffic on websites.

“If the metrics are not really well aligned with what you are truly interested in, they can find you a lot of clicking and a lot of homepage visits, but these are not the people who will buy the product afterwards because they saw the ad.”

Predictive models that look at which users go to some brands’ home pages, for example, are open to being completely flawed if data integrity is not called into question, she said.

“It turns out it is much easier to predict bots than real people. People write apps that skim advertising, so a model can very quickly pick up what that traffic pattern of bots was; it can predict very, very well who would go to these brands’ homepages as long as there was bot traffic there.”

The predictive model in this case will deliver accurate results when testing its predictions. However, that doesn’t bring marketers or the business closer to reaching its objective of real human ad conversions, Perlich said.

The on-line Merriam-Webster’s defined “integrity” as:

  1. firm adherence to a code of especially moral or artistic values : incorruptibility
  2. an unimpaired condition : soundness
  3. the quality or state of being complete or undivided : completeness

None of those definitions of “integrity” apply to the data Perlich describes.

What Perlich criticizes is measuring data with no relationship to the goal of the analysis, “…human ad conversions.”

That’s not “integrity” of data. Perhaps appropriate/fitness for use or relevance but not “integrity.”

Avoid vague and moralizing terminology when discussing data and data science.

Discussions of ethics are difficult enough without introducing confusion with unrelated issues.

I first saw this in a tweet by Data Science Renee.

October 29, 2015

Is It Foolish To Model Nature’s Complexity With Equations?

Filed under: Chaos,Complexity,Modeling — Patrick Durusau @ 10:18 am

Is It Foolish To Model Nature’s Complexity With Equations? by Gabriel Popkin.

From the post:

Sometimes ecological data just don’t make sense. The sockeye salmon that spawn in British Columbia’s Fraser River offer a prime example. Scientists have tracked the fishery there since 1948, through numerous upswings and downswings. At first, population numbers seemed inversely correlated with ocean temperatures: The northern Pacific Ocean surface warms and then cools again every few decades, and in the early years of tracking, fish numbers seemed to rise when sea surface temperature fell. To biologists this seemed reasonable, since salmon thrive in cold waters. Represented as an equation, the population-temperature relationship also gave fishery managers a basis for setting catch limits so the salmon population did not crash.

But in the mid-1970s something strange happened: Ocean temperatures and fish numbers went out of sync. The tight correlation that scientists thought they had found between the two variables now seemed illusory, and the salmon population appeared to fluctuate randomly.

Trying to manage a major fishery with such a primitive understanding of its biology seems like folly to George Sugihara, an ecologist at the Scripps Institution of Oceanography in San Diego. But he and his colleagues now think they have solved the mystery of the Fraser River salmon. Their crucial insight? Throw out the equations.

Sugihara’s team has developed an approach based on chaos theory that they call “empirical dynamic modeling,” which makes no assumptions about salmon biology and uses only raw data as input. In designing it, the scientists found that sea surface temperature can in fact help predict population fluctuations, even though the two are not correlated in a simple way. Empirical dynamic modeling, Sugihara said, can reveal hidden causal relationships that lurk in the complex systems that abound in nature.

Sugihara and others are now starting to apply his methods not just in ecology but in finance, neuroscience and even genetics. These fields all involve complex, constantly changing phenomena that are difficult or impossible to predict using the equation-based models that have dominated science for the past 300 years. For such systems, DeAngelis said, empirical dynamic modeling “may very well be the future.”

If you like success stories with threads of chaos, strange attractors, and fractals running through them, you will enjoy Gabriel’s account of empirical dynamic modeling.

I have been a fan of chaos and fractals since reading Computer Recreations: A computer microscope zooms in for a look at the most complex object in mathematics in 1985 (Scientific American). That article was reposted as part of: DIY Fractals: Exploring the Mandelbrot Set on a Personal Computer by A. K. Dewdney.

Despite that long association with and appreciation of chaos theory, I would answer the title question with a firm maybe.

The answer depends upon whether equations or empirical dynamic modeling provide the amount of precision needed for some articulated purpose.

Both methods ignore any number of dimensions of data, each of which are as chaotic as any of the others. Which ones are taken into account and which ones are ignored is a design question.

Recitation of the uncertainty of data and analysis would be boring as a preface to every publication, but those factors should be upper most in the minds of every editor or reviewer.

Our choice of data or equations or some combination of both to simplify the world for reporting to others shapes the view we report.

What is foolish is to confuse those views with the world. They are not the same.

October 28, 2015

Model-Based Machine Learning

Filed under: Machine Learning,Modeling — Patrick Durusau @ 8:36 pm

Model-Based Machine Learning by John Winn and Christopher Bishop with Thomas Diethe.

From How can machine learning solve my problem? (first chapter):

In this book we look at machine learning from a fresh perspective which we call model-based machine learning. This viewpoint helps to address all of these challenges, and makes the process of creating effective machine learning solutions much more systematic. It is applicable to the full spectrum of machine learning techniques and application domains, and will help guide you towards building successful machine learning solutions without requiring that you master the huge literature on machine learning.

The core idea at the heart of model-based machine learning is that all the assumptions about the problem domain are made explicit in the form of a model. In fact a model is just made up of this set of assumptions, expressed in a precise mathematical form. These assumptions include the number and types of variables in the problem domain, which variables affect each other, and what the effect of changing one variable is on another variable. For example, in the next chapter we build a model to help us solve a simple murder mystery. The assumptions of the model include the list of suspected culprits, the possible murder weapons, and the tendency for particular weapons to be preferred by different suspects. This model is then used to create a model-specific algorithm to solve the specific machine learning problem. Model-based machine learning can be applied to pretty much any problem, and its general-purpose approach means you don’t need to learn a huge number of machine learning algorithms and techniques.

So why do the assumptions of the model play such a key role? Well it turns out that machine learning cannot generate solutions purely from data alone. There are always assumptions built into any algorithm, although usually these assumptions are far from explicit. Different algorithms correspond to different sets of assumptions, and when the assumptions are implicit the only way to decide which algorithm is likely to give the best results is to compare them empirically. This is time-consuming and inefficient, and it requires software implementations of all of the algorithms being compared. And if none of the algorithms tried gives good results it is even harder to work out how to create a better algorithm.

Four chapters are complete now and four more are coming.

Not a fast read but has a great deal of promise, particularly if readers are honest about their assumptions when modeling problems.

It is an opportunity to examine your assumptions about data in your organization and assumptions about your organization. Those assumptions will have as much if not more impact on your project than assumptions cooked into your machine learning.

September 15, 2015

Graphs in the world: Modeling systems as networks

Filed under: Graphs,Modeling — Patrick Durusau @ 7:39 pm

Graphs in the world: Modeling systems as networks by Russel Jurney.

From the post:

Networks of all kinds drive the modern world. You can build a network from nearly any kind of data set, which is probably why network structures characterize some aspects of most phenomenon. And yet, many people can’t see the networks underlying different systems. In this post, we’re going to survey a series of networks that model different systems in order to understand different ways networks help us understand the world around us.

We’ll explore how to see, extract, and create value with networks. We’ll look at four examples where I used networks to model different phenomenon, starting with startup ecosystems and ending in network-driven marketing.

Loaded with successful graph modeling stories Russel’s post will make you anxious to find a data set to model as a graph.

Which is a good thing.

Combining two inboxes (Russel’s and his brother’s) works because you can presume that identical email addresses belong to the same user. But what about different email addresses that belong to the same user?

For data points that will become nodes in your graph, what “properties” do you see in them that make them separate nodes? Have you captured those properties on those nodes? Ditto for relationships that will become arcs in your graph.

How easy is it for someone other than yourself to combine a graph you make with a graph made by a third person?

Data, whether represented as a graph or not, is nearly always “transparent” to its creator. Beyond modeling, the question for graphs is have you enabled transparency for others?

I first saw this in a tweet by Kirk Borne.

August 15, 2015

Modeling and Analysis of Complex Systems

Filed under: Analytics,Complexity,Modeling,Python — Patrick Durusau @ 8:07 pm

Introduction to the Modeling and Analysis of Complex Systems by Hiroki Sayama.

From the webpage:

Introduction to the Modeling and Analysis of Complex Systems introduces students to mathematical/computational modeling and analysis developed in the emerging interdisciplinary field of Complex Systems Science. Complex systems are systems made of a large number of microscopic components interacting with each other in nontrivial ways. Many real-world systems can be understood as complex systems, where critically important information resides in the relationships between the parts and not necessarily within the parts themselves. This textbook offers an accessible yet technically-oriented introduction to the modeling and analysis of complex systems. The topics covered include: fundamentals of modeling, basics of dynamical systems, discrete-time models, continuous-time models, bifurcations, chaos, cellular automata, continuous field models, static networks, dynamic networks, and agent-based models. Most of these topics are discussed in two chapters, one focusing on computational modeling and the other on mathematical analysis. This unique approach provides a comprehensive view of related concepts and techniques, and allows readers and instructors to flexibly choose relevant materials based on their objectives and needs. Python sample codes are provided for each modeling example.

This textbook is available for purchase in both grayscale and color via Amazon.com and CreateSpace.com.

Do us all a favor and pass along the purchase options for classroom hard copies. This style of publishing will last only so long as a majority of us support it. Thanks!

From the introduction:

This is an introductory textbook about the concepts and techniques of mathematical/computational modeling and analysis developed in the emerging interdisciplinary field of complex systems science. Complex systems can be informally defined as networks of many interacting components that may arise and evolve through self-organization. Many real-world systems can be modeled and understood as complex systems, such as political organizations, human cultures/languages, national and international economies, stock markets, the Internet, social networks, the global climate, food webs, brains, physiological systems, and even gene regulatory networks within a single cell; essentially, they are everywhere. In all of these systems, a massive amount of microscopic components are interacting with each other in nontrivial ways, where important information resides in the relationships between the parts and not necessarily within the parts themselves. It is therefore imperative to model and analyze how such interactions form and operate in order to understand what will emerge at a macroscopic scale in the system.

Complex systems science has gained an increasing amount of attention from both inside and outside of academia over the last few decades. There are many excellent books already published, which can introduce you to the big ideas and key take-home messages about complex systems. In the meantime, one persistent challenge I have been having in teaching complex systems over the last several years is the apparent lack of accessible, easy-to-follow, introductory-level technical textbooks. What I mean by technical textbooks are the ones that get down to the “wet and dirty” details of how to build mathematical or
computational models of complex systems and how to simulate and analyze them. Other books that go into such levels of detail are typically written for advanced students who are already doing some kind of research in physics, mathematics, or computer science. What I needed, instead, was a technical textbook that would be more appropriate for a broader audience—college freshmen and sophomores in any science, technology, engineering, and mathematics (STEM) areas, undergraduate/graduate students in other majors, such as the social sciences, management/organizational sciences, health sciences and the humanities, and even advanced high school students looking for research projects who are interested in complex systems modeling.

Can you imagine that? A technical textbook appropriate for a broad audience?

Perish the thought!

I could name several W3C standards that could have used that editorial stance as opposed to: “…we know what we meant….”

I should consider that as a market opportunity, to translate insider jargon (and deliberately so) into more generally accessible language. Might even help with uptake of the standards.

While I think about that, enjoy this introduction to complex systems, with Python none the less.

April 13, 2015

Selection bias and bombers

Filed under: Modeling,Statistics — Patrick Durusau @ 2:50 pm

Selection bias and bombers

John D. Cook didn’t just recently start having interesting opinions! This is a post from 2008 that starts:

During WWII, statistician Abraham Wald was asked to help the British decide where to add armor to their bombers. After analyzing the records, he recommended adding more armor to the places where there was no damage!

A great story of how the best evidence may not be right in front of us.

Enjoy!

March 16, 2015

Max Kuhn’s Talk on Predictive Modeling

Filed under: Modeling,Prediction,Predictive Analytics — Patrick Durusau @ 3:53 pm

Max Kuhn’s Talk on Predictive Modeling

From the post:

Max Kuhn, Director of Nonclinical Statistics of Pfizer and also the author of Applied Predictive Modeling joined us on February 17, 2015 and shared his experience with Data Mining with R.

Max is a nonclinical statistician who has been applying predictive models in the diagnostic and pharmaceutical industries for over 15 years. He is the author and maintainer for a number of predictive modeling packages, including: caret, C50, Cubist and AppliedPredictiveModeling. He blogs about the practice of modeling on his website at http://appliedpredictivemodeling.com/blog

Excellent! (You may need to adjust the sound on the video.)

Support your local user group, particularly those generous enough to post videos and slides for their speakers. It makes a real difference to those unable to travel for one reason or another.

I first saw this in a tweet by NYC Data Science.

March 3, 2015

Principles of Model Checking

Filed under: Design,Modeling,Software,Software Engineering — Patrick Durusau @ 5:15 pm

Principles of Model Checking by Christel Baier and Joost-Pieter Katoen. Foreword by Kim Guldstrand Larsen.

From the webpage:

Our growing dependence on increasingly complex computer and software systems necessitates the development of formalisms, techniques, and tools for assessing functional properties of these systems. One such technique that has emerged in the last twenty years is model checking, which systematically (and automatically) checks whether a model of a given system satisfies a desired property such as deadlock freedom, invariants, or request-response properties. This automated technique for verification and debugging has developed into a mature and widely used approach with many applications. Principles of Model Checking offers a comprehensive introduction to model checking that is not only a text suitable for classroom use but also a valuable reference for researchers and practitioners in the field.

The book begins with the basic principles for modeling concurrent and communicating systems, introduces different classes of properties (including safety and liveness), presents the notion of fairness, and provides automata-based algorithms for these properties. It introduces the temporal logics LTL and CTL, compares them, and covers algorithms for verifying these logics, discussing real-time systems as well as systems subject to random phenomena. Separate chapters treat such efficiency-improving techniques as abstraction and symbolic manipulation. The book includes an extensive set of examples (most of which run through several chapters) and a complete set of basic results accompanied by detailed proofs. Each chapter concludes with a summary, bibliographic notes, and an extensive list of exercises of both practical and theoretical nature.

The present IT structure has shown itself to be as secure as a sieve. Do you expect the “Internet of Things” to be any more secure?

If you are interested in secure or at least less buggy software, more formal analysis is going to be a necessity. This title will give you an introduction to the field.

It dates from 2008 so some updating will be required.

I first saw this in a tweet by Reid Draper.

January 27, 2015

LDAvis: Interactive Visualization of Topic Models

Filed under: Latent Dirichlet Allocation (LDA),Modeling,R,Topic Models (LDA) — Patrick Durusau @ 3:33 pm

LDAvis: Interactive Visualization of Topic Models by Carson Sievert and Kenny Shirley.

From the webpage:

Tools to create an interactive web-based visualization of a topic model that has been fit to a corpus of text data using Latent Dirichlet Allocation (LDA). Given the estimated parameters of the topic model, it computes various summary statistics as input to an interactive visualization built with D3.js that is accessed via a browser. The goal is to help users interpret the topics in their LDA topic model.

From the description:

This video (recorded September 2014) shows how interactive visualization is used to help interpret a topic model using LDAvis. LDAvis is an R package which extracts information from a topic model and creates a web-based visualization where users can interactively explore the model. More details, examples, and instructions for using LDAvis can be found here — https://github.com/cpsievert/LDAvis

Excellent exploration of a data set using LDAvis.

Will all due respect to “agile” programming, modeling before you understand a data set isn’t a winning proposition.

Coding is not the new literacy

Filed under: Modeling,Programming — Patrick Durusau @ 2:28 pm

Coding is not the new literacy by Chris Granger.

From the post:

Despite the good intentions behind the movement to get people to code, both the basic premise and approach are flawed. The movement sits on the idea that "coding is the new literacy," but that takes a narrow view of what literacy really is.

If you ask google to define literacy it gives a mechanical definition:

the ability to read and write.

This is certainly accurate, but defining literacy as interpreting and making marks on a sheet of paper is grossly inadequate. Reading and writing are the physical actions we use to employ something far more important: external, distributable storage for the mind. Being literate isn't simply a matter of being able to put words on the page, it's solidifying our thoughts such that they can be written. Interpreting and applying someone else's thoughts is the equivalent for reading. We call these composition and comprehension. And they are what literacy really is.

Before you assume that Chris is going to diss programming, go read his post.

Chris is arguing for a skill set that will make anyone a much better programmer as well as spill over into other analytical tasks as well.

Take the title as a provocation to read the post. By the end of the post, you will have learned something valuable or have been reminded of something valuable that you already knew.

Enjoy!

November 22, 2014

The structural virality of online diffusion

Filed under: Advertising,Marketing,Modeling — Patrick Durusau @ 4:34 pm

The structural virality of online di ffusion by Sharad Goel, Ashton Anderson, Jake Hofman, and Duncan J. Watts.

Viral products and ideas are intuitively understood to grow through a person-to-person di ffusion process analogous to the spread of an infectious disease; however, until recently it has been prohibitively difficult to directly observe purportedly viral events, and thus to rigorously quantify or characterize their structural properties. Here we propose a formal measure of what we label “structural virality” that interpolates between two conceptual extremes: content that gains its popularity through a single, large broadcast, and that which grows through multiple generations with any one individual directly responsible for only a fraction of the total adoption. We use this notion of structural virality to analyze a unique dataset of a billion di ffusion events on Twitter, including the propagation of news stories, videos, images, and petitions. We find that across all domains and all sizes of events, online di ffusion is characterized by surprising structural diversity. Popular events, that is, regularly grow via both broadcast and viral mechanisms, as well as essentially all conceivable combinations of the two. Correspondingly, we find that the correlation between the size of an event and its structural virality is surprisingly low, meaning that knowing how popular a piece of content is tells one little about how it spread. Finally, we attempt to replicate these fi ndings with a model of contagion characterized by a low infection rate spreading on a scale-free network. We fi nd that while several of our empirical fi ndings are consistent with such a model, it does not replicate the observed diversity of structural virality.

Before you get too excited, the authors do not provide a how-to-go-viral manual.

In part because:

Large and potentially viral cascades are therefore necessarily very rare events; hence one must observe a correspondingly large number of events in order to fi nd just one popular example, and many times that number to observe many such events. As we will describe later, in fact, even moderately popular events occur in our data at a rate of only about one in a thousand, while “viral hits” appear at a rate closer to one in a million. Consequently, in order to obtain a representative sample of a few hundred viral hits arguably just large enough to estimate statistical patterns reliably one requires an initial sample on the order of a billion events, an extraordinary data requirement that is difficult to satisfy even with contemporary data sources.

The authors clearly advance the state of research on “viral hits” and conclude with suggestions for future modeling work.

You can imagine the reaction of marketing departments should anyone get closer to designing successful viral advertising.

A good illustration that something we can observe, “viral hits,” in an environment where the spread can be tracked (Twitter), can still resist our best efforts to model and/or explain how to repeat the “viral hit” on command.

A good story to remember when a client claims that some action is transparent. It may well be, but that doesn’t mean there are enough instances to draw any useful conclusions.

I first saw this in a tweet by Steven Strogatz.

October 1, 2014

The Missing Piece in Complex Analytics: Low Latency, Scalable Model Management and Serving with Velox

Filed under: HPC,Interface Research/Design,Machine Learning,Modeling,Velox — Patrick Durusau @ 8:25 pm

The Missing Piece in Complex Analytics: Low Latency, Scalable Model Management and Serving with Velox by Daniel Crankshaw, et al.

Abstract:

To support complex data-intensive applications such as personalized recommendations, targeted advertising, and intelligent services, the data management community has focused heavily on the design of systems to support training complex models on large datasets. Unfortunately, the design of these systems largely ignores a critical component of the overall analytics process: the deployment and serving of models at scale. In this work, we present Velox, a new component of the Berkeley Data Analytics Stack. Velox is a data management system for facilitating the next steps in real-world, large-scale analytics pipelines: online model management, maintenance, and serving. Velox provides end-user applications and services with a low-latency, intuitive interface to models, transforming the raw statistical models currently trained using existing offline large-scale compute frameworks into full-blown, end-to-end data products capable of recommending products, targeting advertisements, and personalizing web content. To provide up-to-date results for these complex models, Velox also facilitates lightweight online model maintenance and selection (i.e., dynamic weighting). In this paper, we describe the challenges and architectural considerations required to achieve this functionality, including the abilities to span online and offline systems, to adaptively adjust model materialization strategies, and to exploit inherent statistical properties such as model error tolerance, all while operating at “Big Data” scale.

Early Warning: Alpha code drop expected December 2014.

If you want to get ahead of the curve I suggest you start reading this paper soon. Very soon.

Written from the perspective of end-user facing applications but applicable to author-facing applications for real time interaction with subject identification.

August 26, 2014

Improving sparse word similarity models…

Filed under: Algorithms,Linguistics,Modeling,Similarity — Patrick Durusau @ 6:02 pm

Improving sparse word similarity models with asymmetric measures by Jean Mark Gawron.

Abstract:

We show that asymmetric models based on Tversky (1977) improve correlations with human similarity judgments and nearest neighbor discovery for both frequent and middle-rank words. In accord with Tversky’s discovery that asymmetric similarity judgments arise when comparing sparse and rich representations, improvement on our two tasks can be traced to heavily weighting the feature bias toward the rarer word when comparing high- and mid- frequency words.

From the introduction:

A key assumption of most models of similarity is that a similarity relation is symmetric. This assumption is foundational for some conceptions, such as the idea of a similarity space, in which similarity is the inverse of distance; and it is deeply embedded into many of the algorithms that build on a similarity relation among objects, such as clustering algorithms. The symmetry assumption is not, however, universal, and it is not essential to all applications of similarity, especially when it comes to modeling human similarity judgments.

What assumptions underlie your “similarity” measures?

Not that we can get away from “assumptions” but are your assumptions based on evidence or are they unexamined assumptions?

Do you know of any general techniques for discovering assumptions in algorithms?

June 6, 2014

Myth Busting Doubts About Formal Methods

Filed under: Formal Methods,Modeling,Programming — Patrick Durusau @ 6:38 pm

Use of Formal Methods at Amazon Web Services by Chris Newcombe, Tim Rath, Fan Zhang, Bogdan Munteanu, Marc Brooker, and, Michael Deardeuff. (PDF)

From the paper:

Since 2011, engineers at Amazon Web Services (AWS) have been using formal specification and model-checking to help solve difficult design problems in critical systems. This paper describes our motivation and experience, what has worked well in our problem domain, and what has not. When discussing personal experiences we refer to authors by their initials.

At AWS we strive to build services that are simple for customers to use. That external simplicity is built on a hidden substrate of complex distributed systems. Such complex internals are required to achieve high-availability while running on cost-efficient infrastructure, and also to cope with relentless rapid business-growth. As an example of this growth; in 2006 we launched S3, our Simple Storage Service. In the 6 years after launch, S3 grew to store 1 trillion objects [1]. Less than a year later it had grown to 2 trillion objects, and was regularly handling 1.1 million requests per second [2].

S3 is just one of tens of AWS services that store and process data that our customers have entrusted to us. To safeguard that data, the core of each service relies on fault-tolerant distributed algorithms for replication, consistency, concurrency control, auto-scaling, load-balancing, and other coordination tasks. There are many such algorithms in the literature, but combining them into a cohesive system is a major challenge, as the algorithms must usually be modified in order to interact properly in a real-world system. In addition, we have found it necessary to invent
algorithms of our own. We work hard to avoid unnecessary complexity, but the essential complexity of the task remains high.

The authors are not shy about arguing for the value of formal methods for complex systems:

In industry, formal methods have a reputation of requiring a huge amount of training and effort to verify a tiny piece of relatively straightforward code, so the return on investment is only justified in safety-critical domains such as medical systems and avionics. Our experience with TLA+ has shown that perception to be quite wrong. So far we have used TLA+ on 6 large complex real-world systems. In every case TLA+ has added significant value, either finding subtle bugs that we are sure we would not have found by other means, or giving us enough understanding and confidence to make aggressive performance optimizations without sacrificing correctness. We now have 7 teams using TLA+, with encouragement from senior management and technical leadership. (emphasis added)

Hard to argue with “real-world” success. Yes?

Well, or if you want your system to be successful. Say compare Amazon’s S3 with the ill-fated healthcare site.

The paper also covers what formal methods cannot do and recounts how this was sold to programmers within Amazon.

I suggest reading the paper more than once and following all the links in the bibliography, but if you are in a hurry, at least see these two:

Lamport, L. The TLA Home Page; http://research.microsoft.com/en-us/um/people/lamport/tla/tla.html

Lamport, L. The Wildfire Challenge Problem ; http://research.microsoft.com/en-us/um/people/lamport/tla/wildfire-challenge.html

Public forum of the TLA+ user community; https://groups.google.com/forum/?hl=en&fromgroups#!forum/tlaplus

Which leaves me with the question: How do you create a reliability guarantee for a topic map? Manual inspection doesn’t scale.

I first saw this in a tweet by Marc Brooker.

April 16, 2014

…Generalized Language Models…

Filed under: Language,Linguistics,Modeling — Patrick Durusau @ 1:19 pm

How Generalized Language Models outperform Modified Kneser Ney Smoothing by a Perplexity drop of up to 25% by René Pickhardt.

René reports on the core of his dissertation work.

From the post:

When you want to assign a probability to a sequence of words you will run into the Problem that longer sequences are very rare. People fight this problem by using smoothing techniques and interpolating longer order models (models with longer word sequences) with lower order language models. While this idea is strong and helpful it is usually applied in the same way. In order to use a shorter model the first word of the sequence is omitted. This will be iterated. The Problem occurs if one of the last words of the sequence is the really rare word. In this way omiting words in the front will not help.

So the simple trick of Generalized Language models is to smooth a sequence of n words with n-1 shorter models which skip a word at position 1 to n-1 respectively.

Then we combine everything with Modified Kneser Ney Smoothing just like it was done with the previous smoothing methods.

Unlike some white papers, webinars and demos, you don’t have to register, list your email and phone number, etc. to see both the test data and code that implements René’s ideas.

Data, Source.

Please send René useful feedback as a way to say thank you for sharing both data and code.

April 1, 2014

Molpher:…

Filed under: Cheminformatics,Modeling,Science — Patrick Durusau @ 6:39 pm

Molpher: a software framework for systematic chemical space exploration by David Hoksza, Petr Škoda, Milan Voršilák and Daniel Svozil.

Abstract:

Background

Chemical space is virtual space occupied by all chemically meaningful organic compounds. It is an important concept in contemporary chemoinformatics research, and its systematic exploration is vital to the discovery of either novel drugs or new tools for chemical biology.

Results

In this paper, we describe Molpher, an open-source framework for the systematic exploration of chemical space. Through a process we term ‘molecular morphing’, Molpher produces a path of structurally-related compounds. This path is generated by the iterative application of so-called ‘morphing operators’ that represent simple structural changes, such as the addition or removal of an atom or a bond. Molpher incorporates an optimized parallel exploration algorithm, compound logging and a two-dimensional visualization of the exploration process. Its feature set can be easily extended by implementing additional morphing operators, chemical fingerprints, similarity measures and visualization methods. Molpher not only offers an intuitive graphical user interface, but also can be run in batch mode. This enables users to easily incorporate molecular morphing into their existing drug discovery pipelines.

Conclusions

Molpher is an open-source software framework for the design of virtual chemical libraries focused on a particular mechanistic class of compounds. These libraries, represented by a morphing path and its surroundings, provide valuable starting data for future in silico and in vitro experiments. Molpher is highly extensible and can be easily incorporated into any existing computational drug design pipeline.

Beyond its obvious importance for cheminformatics, this paper offers another example of “semantic impedance:”

While virtual chemical space is very large, only a small fraction of it has been reported in actual chemical databases so far. For example, PubChem contains data for 49.1 million chemical compounds [17] and Chemical Abstracts consists of over 84.3 million organic and inorganic substances [18] (numbers as of 12. 3. 2014). Thus, the navigation of chemical space is a very important area of chemoinformatics research [19,20]. Because chemical space is usually defined using various sets of descriptors [21], a major problem is the lack of invariance of chemical space [22,23]. Depending on the descriptors and distance measures used [24], different chemical spaces show different compound distributions. Unfortunately, no generally applicable representation of invariant chemical space has yet been reported [25].

OK, so how much further is there to go with these various descriptors?

The article describes estimates of the size of chemical space this way:

Chemical space is populated by all chemically meaningful and stable organic compounds [1-3]. It is an important concept in contemporary chemoinformatics research [4,5], and its exploration leads to the discovery of either novel drugs [2] or new tools for chemical biology [6,7]. It is agreed that chemical space is huge, but no accurate approximation of its size exists. Even if only drug-like molecules are taken into account, size estimates vary [8] between 1023[9] and 10100[10] compounds. However, smaller numbers have also been reported. For example, based on the growth of a number of organic compounds in chemical databases, Drew et al.[11] deduced the size of chemical space to be 3.4 × 109. By assigning all possible combinations of atomic species to the same three-dimensional geometry, Ogata et al. [12] estimated the size of chemical space to be between 108 and 1019. Also, by analyzing known organic substituents, the size of accessible chemical space was assessed as between 1020 and 1024[9].

Such estimates have been put into context by Reymond et al., who produced all molecules that can exist up to a certain number of heavy atoms in their Chemical Universe Databases: GDB-11 [13,14] (2.64 × 107 molecules with up to 11 heavy atoms); GDB-13 [15] (9.7 × 108 molecules with up to 13 heavy atoms); and GDB-17 [16] (1.7 × 1011 compounds with up to 17 heavy atoms). The GDB-17 database was then used to approximate the number of possible drug-like molecules as 1033[8].

To give you an easy basis for comparison: possible drug-like molecules at 1033, versus number of stars in galaxies in the observable universe at 1024.

That’s an impressive number of possible drug like molecules. 109 more than stars in the observable universe (est.).

I can’t imagine that having diverse descriptors is assisting in the search to complete the chemical space. And from the description, it doesn’t sound like semantic convergence in one the horizon.

Mapping between the existing systems would be a major undertaking but the longer exploration goes on without such a mapping, the problem is only going to get worse.

January 25, 2014

Using Neo4J for Website Analytics

Filed under: Graphs,Modeling,Neo4j,Web Analytics — Patrick Durusau @ 2:23 pm

Using Neo4J for Website Analytics by Francesco Gallarotti.

From the post:

Working at the office customizing and installing different content management systems (CMS) for some of our clients, I have seen different ways of tracking users and then using the collected data to:

  1. generate analytics reports
  2. personalize content

I am not talking about simple Google Analytics data. I am referring to ways to map users into predefined personas and then modify the content of the site based on what that persona is interested into.

Interesting discussion of tracking users for web analytics with a graph database.

Not NSA grade tracking because users are collapsed into predefined personas. Personas limit the granularity of your tracking.

On the other hand, if that is all the granularity that is required, personas allow you to avoid a lot of “merge” statements that test for the prior existence of a user in the graph.

Depending on the circumstances, I would create new nodes for each visit by a user, reasoning it is quicker to stream the data and later combine for specific users, if desired. Defining “personas” on the fly from the pages visited and ignoring the individual users.

Thinking I can always ignore granularity I don’t need but once lost, granularity is forever lost.

November 27, 2013

Getting Started with Multilevel Modeling in R

Filed under: Modeling,R — Patrick Durusau @ 3:18 pm

Getting Started with Multilevel Modeling in R by Jared E. Knowles.

From the post:

Analysts dealing with grouped data and complex hierarchical structures in their data ranging from measurements nested within participants, to counties nested within states or students nested within classrooms often find themselves in need of modeling tools to reflect this structure of their data. In R there are two predominant ways to fit multilevel models that account for such structure in the data. These tutorials will show the user how to use both the lme4 package in R to fit linear and nonlinear mixed effect models, and to use rstan to fit fully Bayesian multilevel models. The focus here will be on how to fit the models in R and not the theory behind the models. For background on multilevel modeling, see the references. [1]

Jared walks the reader through adding the required packages, obtaining sample data and performing analysis on the sample data.

If you think about it, all data points are “nested” in one complex hierarchical structure or another.

Sometimes we choose to ignore those structures and sometimes we account for some chosen subset of complex hierarchical structures.

The important point being that our models may be useful but they are not the subjects being modeled.

November 21, 2013

Finding Occam’s razor in an era of information overload

Filed under: Modeling,Skepticism — Patrick Durusau @ 11:54 am

Finding Occam’s razor in an era of information overload

From the post:

How can the actions and reactions of proteins so small or stars so distant they are invisible to the human eye be accurately predicted? How can blurry images be brought into focus and reconstructed?

A new study led by physicist Steve Pressé, Ph.D., of the School of Science at Indiana University-Purdue University Indianapolis, shows that there may be a preferred strategy for selecting mathematical models with the greatest predictive power. Picking the best model is about sticking to the simplest line of reasoning, according to Pressé. His paper explaining his theory is published online this month in Physical Review Letters, a preeminent international physics journal.

“Building mathematical models from observation is challenging, especially when there is, as is quite common, a ton of noisy data available,” said Pressé, an assistant professor of physics who specializes in statistical physics. “There are many models out there that may fit the data we do have. How do you pick the most effective model to ensure accurate predictions? Our study guides us towards a specific mathematical statement of Occam’s razor.”

Occam’s razor is an oft cited 14th century adage that “plurality should not be posited without necessity” sometimes translated as “entities should not be multiplied unnecessarily.” Today it is interpreted as meaning that all things being equal, the simpler theory is more likely to be correct.

Comforting that the principles of good modeling have not changed since the 14th century. (Occam’s Razor)

Bear in mind Occam’s Razor is guidance and not a hard and fast rule.

On the other hand, particularly with “big data,” be wary of complex models.

Especially the ones that retroactively “predict” unique events as a demonstration of their model.

If you are interested in the full “monty:”

Nonadditive Entropies Yield Probability Distributions with Biases not Warranted by the Data by Steve Pressé, Kingshuk Ghosh, Julian Lee, and Ken A. Dill. Phys. Rev. Lett. 111, 180604 (2013)

Abstract:

Different quantities that go by the name of entropy are used in variational principles to infer probability distributions from limited data. Shore and Johnson showed that maximizing the Boltzmann-Gibbs form of the entropy ensures that probability distributions inferred satisfy the multiplication rule of probability for independent events in the absence of data coupling such events. Other types of entropies that violate the Shore and Johnson axioms, including nonadditive entropies such as the Tsallis entropy, violate this basic consistency requirement. Here we use the axiomatic framework of Shore and Johnson to show how such nonadditive entropy functions generate biases in probability distributions that are not warranted by the underlying data.

October 27, 2013

Big Data Modeling with Cassandra

Filed under: BigData,Cassandra,Modeling — Patrick Durusau @ 7:34 pm

Big Data Modeling with Cassandra by Mat Brown.

Description:

When choosing the right data store for an application, developers face a trade-off between scalability and programmer-friendliness. With the release of version 3 of the Cassandra Query Language, Cassandra provides a uniquely attractive combination of both, exposing robust and intuitive data modeling capabilities while retaining the scalability and availability of a distributed, masterless data store.

This talk will focus on practical data modeling and access in Cassandra using CQL3. We’ll cover nested data structures; different types of primary keys; and the many shapes your tables can take. There will be a particular focus on understanding the way Cassandra stores and accesses data under the hood, to better reason about designing schemas for performant queries. We’ll also cover the most important (and often unexpected) differences between ACID databases and distributed data stores like Cassandra.

Mat Brown (twitter.com/0utoftime) is a software engineer at Rap Genius, a platform for annotating and explaining the world’s text. Mat is the author of Cequel, a Ruby object/row mapper for Cassandra, as well as Elastictastic, an object/document mapper for ElasticSearch, and Sunspot, a Ruby model integration layer for Solr.

Mat covers limitations of Cassandra without being pressed. Not unknown but not common either.

Migration from relational schema to Cassandra is a bad idea. (paraphrase)

Mat examines the internal data structures that influence how you should model data in Cassandra.

At 17:40, shows how the data structure is represented internally.

The internal representation drives schema design.

You may also like Cequel by the presenter.

PS: I suspect that if considered carefully, the internal representation of data in most databases drives the advice given by tech support.

October 9, 2013

Logical and Computational Structures for Linguistic Modeling

Filed under: Language,Linguistics,Logic,Modeling — Patrick Durusau @ 7:25 pm

Logical and Computational Structures for Linguistic Modeling

From the webpage:

Computational linguistics employs mathematical models to represent morphological, syntactic, and semantic structures in natural languages. The course introduces several such models while insisting on their underlying logical structure and algorithmics. Quite often these models will be related to mathematical objects studied in other MPRI courses, for which this course provides an original set of applications and problems.

The course is not a substitute for a full cursus in computational linguistics; it rather aims at providing students with a rigorous formal background in the spirit of MPRI. Most of the emphasis is put on the symbolic treatment of words, sentences, and discourse. Several fields within computational linguistics are not covered, prominently speech processing and pragmatics. Machine learning techniques are only very sparsely treated; for instance we focus on the mathematical objects obtained through statistical and corpus-based methods (i.e. weighted automata and grammars) and the associated algorithms, rather than on automated learning techniques (which is the subject of course 1.30).

Abundant supplemental materials, slides, notes, further references.

In particular you may like Notes on Computational Aspects of Syntax by Sylvain Schmitz, that cover the first part of Logical and Computational Structures for Linguistic Modeling.

As with any model, there are trade-offs and assumptions build into nearly every choice.

Knowing where to look for those trade-offs and assumptions will give you a response to: “Well, but the model shows that….”

October 4, 2013

The Mathematical Shape of Things to Come

Filed under: Data Analysis,Mathematics,Modeling — Patrick Durusau @ 4:27 pm

The Mathematical Shape of Things to Come by Jennifer Ouellette.

From the post:

Simon DeDeo, a research fellow in applied mathematics and complex systems at the Santa Fe Institute, had a problem. He was collaborating on a new project analyzing 300 years’ worth of data from the archives of London’s Old Bailey, the central criminal court of England and Wales. Granted, there was clean data in the usual straightforward Excel spreadsheet format, including such variables as indictment, verdict, and sentence for each case. But there were also full court transcripts, containing some 10 million words recorded during just under 200,000 trials.

“How the hell do you analyze that data?” DeDeo wondered. It wasn’t the size of the data set that was daunting; by big data standards, the size was quite manageable. It was the sheer complexity and lack of formal structure that posed a problem. This “big data” looked nothing like the kinds of traditional data sets the former physicist would have encountered earlier in his career, when the research paradigm involved forming a hypothesis, deciding precisely what one wished to measure, then building an apparatus to make that measurement as accurately as possible.

From further in the post:

Today’s big data is noisy, unstructured, and dynamic rather than static. It may also be corrupted or incomplete. “We think of data as being comprised of vectors – a string of numbers and coordinates,” said Jesse Johnson, a mathematician at Oklahoma State University. But data from Twitter or Facebook, or the trial archives of the Old Bailey, look nothing like that, which means researchers need new mathematical tools in order to glean useful information from the data sets. “Either you need a more sophisticated way to translate it into vectors, or you need to come up with a more generalized way of analyzing it,” Johnson said.

All true but vectors expect a precision that is missing from any natural language semantic.

A semantic that varies from listener to listener. See: Is there a text in this class? : The authority of interpretive communities by Stanley Fish.

It is a delightful article, so long as one bears in mind that all representations of semantics are from a point of view.

The most we can say for any point of view is that it is useful for some stated purpose.

October 1, 2013

Recursive Deep Models for Semantic Compositionality…

Filed under: Machine Learning,Modeling,Semantic Vectors,Semantics,Sentiment Analysis — Patrick Durusau @ 4:12 pm

Recursive Deep Models for Semantic Compositionality Over a Sentiment Treebank by Richard Socher, Alex Perelygin, Jean Y. Wu, Jason Chuang, Christopher D. Manning, Andrew Y. Ng and Christopher Potts.

Abstract:

Semantic word spaces have been very useful but cannot express the meaning of longer phrases in a principled way. Further progress towards understanding compositionality in tasks such as sentiment detection requires richer supervised training and evaluation resources and more powerful models of composition. To remedy this, we introduce a Sentiment Treebank. It includes fine grained sentiment labels for 215,154 phrases in the parse trees of 11,855 sentences and presents new challenges for sentiment compositionality. To address them, we introduce the Recursive Neural Tensor Network. When trained on the new treebank, this model outperforms all previous methods on several metrics. It pushes the state of the art in single sentence positive/negative classification from 80% up to 85.4%. The accuracy of predicting fine-grained sentiment labels for all phrases reaches 80.7%, an improvement of 9.7% over bag of features baselines. Lastly, it is the only model that can accurately capture the effect of contrastive conjunctions as well as negation and its scope at various tree levels for both positive and negative phrases.

You will no doubt want to see the webpage with the demo.

Along with possibly the data set and the code.

I was surprised by “fine-grained sentiment labels” meaning:

  1. Positive
  2. Somewhat positive
  3. Neutral
  4. Somewhat negative
  5. Negative

But then for many purposes, subject recognition on that level of granularity may be sufficient.

May 9, 2013

Become a Super Modeler

Filed under: Cassandra,CQL - Cassandra Query Language,Modeling — Patrick Durusau @ 2:00 pm

Become a Super Modeler (Webinar)

Thursday, May 16th
11am PDT / 2pm EDT / 7pm BST / 8pm CEST

Sure you can do some time series modeling. Maybe some user profiles. What’s going to make you a super modeler? Let’s take a look at some great techniques taken from real world applications where we exploit the Cassandra big table model to it’s fullest advantage. We’ll cover some of the new features in CQL 3 as well as some tried and true methods. In particular, we will look at fast indexing techniques to get data faster at scale. You’ll be jet setting through your data like a true super modeler in no time.

Speaker: Patrick McFadin, Principal Solutions Architect at DataStax

Looks interesting and I have neglected to look closely at CQL 3.

Could be some incentive to read up before the webinar.

April 5, 2013

Successful PROV Tutorial at EDBT

Filed under: Design,Modeling,Provenance — Patrick Durusau @ 1:13 pm

Successful PROV Tutorial at EDBT by Paul Groth.

From the post:

On March 20th, 2013 members of the Provenance Working Group gave a tutorial on the PROV family of specifications at the EDBT conference in Genova, Italy. EDBT (“Extending Database Technology”) is widely regarded as one of the prime venues in Europe for dissemination of data management research.

The 1.5 hours tutorial was attended by about 26 participants, mostly from academia. It was structured into three parts of approximately the same length. The first two parts introduced PROV as a relational data model with constraints and inference rules, supported by a (nearly) relational notation (PROV-N). The third part presented known extensions and applications of PROV, based on the extensive PROV implementation report and implementations known to the presenter at the time.

All the presentation material is available here.

As the first part of the tutorial notes:

  • Provenance is not a new subject
    • workflow systems
    • databases
    • knowledge representation
    • information retrieval
  • Existing community-grown vocabularies
    • Open Provenance Model (OPM)
    • Dublin Core
    • Provenir ontology
    • Provenance vocabulary
    • SWAN provenance ontology
    • etc.

The existence of “other” vocabularies isn’t an issue for topic maps.

You can query on “your” vocabulary and obtain results from “other” vocabularies.

Enriches your information and that of others.

You will need to know about the vocabularies of others and their oddities.

For the W3C work on provenance, follow this tutorial and the others it mentions.

April 4, 2013

Data Points: Preview

Filed under: Graphics,Modeling,Visualization — Patrick Durusau @ 2:18 pm

Data Points: Preview by Nathan Yau.

As you already know, Nathan is a rich source for interesting graphics and visualizations, some of which I have the good sense to point to.

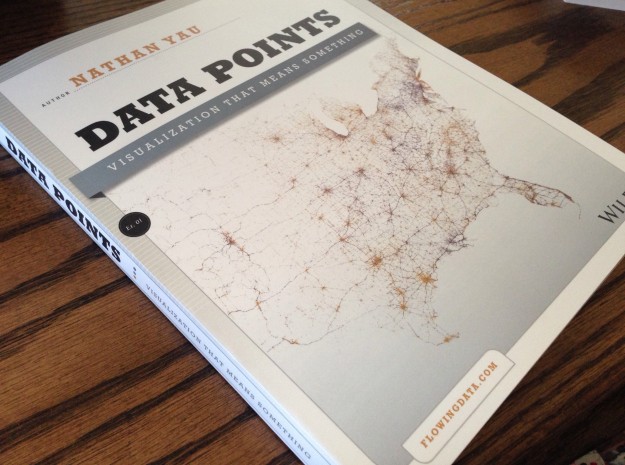
What you may not know is that Nathan has a new book out: Data Points: Visualizations That Mean Something.

Data Points

Not a book about coding to visualize data but rather:

Data Points is all about process from a non-programming point of view. Start with the data, really understand it, and then go from there. Data Points is about looking at your data from different perspectives and how it relates to real life. Then design accordingly.

That’s the hard part isn’t it?

Like the ongoing discussion here about modeling for topic maps.

Unless you understand the data, models and visualizations alike are going to be meaningless.

Check out Nathan’s new book to increase your chances of models and visualizations that mean something.

Older Posts »

Powered by WordPress