Another Word For It Patrick Durusau on Topic Maps and Semantic Diversity

April 2, 2016

Time Maps:…

Filed under: Mapping,Maps,Time,Timelines — Patrick Durusau @ 4:49 pm

Time Maps: Visualizing Discrete Events Across Many Timescales by Max Watson.

From the post:

In this blog post, I’ll describe a technique for visualizing many events across multiple timescales in a single image, where little or no zooming is required. It allows the viewer to quickly identify critical features, whether they occur on a timescale of milliseconds or months. It is adopted from the field of chaotic systems, and was originally conceived to study the timing of water drops from a dripping faucet. The visualization has gone by various names: return map, return-time map, and time vs. time plot. For conciseness, I will call them “time maps.” Though time maps have been used to visualize chaotic systems, they have not been applied to information technology. I will show how time maps can provide valuable insights into the behavior of Twitter accounts and the activity of a certain type of online entity, known as a bot.

This blog post is a shorter version of a paper I recently wrote, but with slightly different examples. The paper was accepted to the 2015 IEEE Big Data Conference. The end of the blog also contains sample Python code for creating time maps.

Building a time map is easy. First, imagine a series of events as dots along a time axis. The time intervals between each event are labeled as t1, t2, t3, t4, …

watson-1

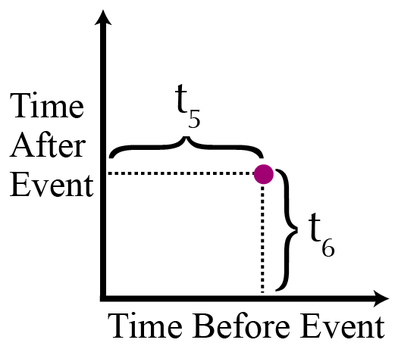
A time map is simply a two-dimensional scatterplot, where the xy coordinates of the events are: (t1,t2), (t2, t3), (t3, t4), and so on. On a time map, the purple dot would be plotted like this:

watson-2

In other words, each point in the scatterplot represents an event. The x-coordinate of an event is the time between the event itself and the preceding event. An event’s y-coordinate is the time between the event itself and the subsequent event. The only points that are not displayed in a time map are the first and last events of the dataset.

Max goes on to cover the heuristics of time maps, along with the Python code for generating them.

Max’s time maps use a common time line for events and so aren’t well suited to visualizing overlapping narrative time frames such as occur in novels and/or real life.

I first saw this in a tweet by Data Science Renee

January 20, 2014

Timeline of the Far Future

Filed under: Graphics,History,Timelines,Visualization — Patrick Durusau @ 6:37 pm

Timeline of the Far Future Randy Krum.

Randy has uncovered a timeline from the BBC that predicts the future in 1,000, 10,000, one million years and beyond.

It’s big and will take time to read.

I suspect the accuracy of the predictions are on par with a similar time line pointing backwards. 😉

But it’s fun to speculate about history, past, future, alternative, or fantasy histories.

December 26, 2013

Topotime gallery & sandbox

Filed under: D3,Graphics,JSON,Time,Time Series,Timelines,Visualization — Patrick Durusau @ 8:31 pm

Topotime gallery & sandbox

From the website:

A pragmatic JSON data format, D3 timeline layout, and functions for representing and computing over complex temporal phenomena. It is under active development by its instigators, Elijah Meeks (emeeks) and Karl Grossner (kgeographer), who welcome forks, comments, suggestions, and reasonably polite brickbats.

Topotime currently permits the representation of:

  • Singular, multipart, cyclical, and duration-defined timespans in periods (tSpan in Period). A Period can be any discrete temporal thing, e.g. an historical period, an event, or a lifespan (of a person, group, country).
  • The tSpan elements start (s), latest start (ls), earliest end (ee), end (e) can be ISO-8601 (YYYY-MM-DD, YYYY-MM or YYYY), or pointers to other tSpans or their individual elements. For example, >23.s stands for ‘after the start of Period 23 in this collection.’
    • Uncertain temporal extents; operators for tSpan elements include: before (<), after (>), about (~), and equals (=).
  • Further articulated start and end ranges in sls and eee elements, respectively.
  • An estimated timespan when no tSpan is defined
  • Relations between events. So far, part-of, and participates-in. Further relations including has-location are in development.

Topotime currently permits the computation of:

  • Intersections (overlap) between between a query timespan and a collection of Periods, answering questions like “what periods overlapped with the timespan [-433, -344] (Plato’s lifespan possibilities)?” with an ordered list.

To learn more, check out these and other pages in the Wiki and the Topotime web page

I am currently reading the A Song of Fire and Ice (first volume, A Game of Thrones) and the uncertain temporal extents of Topotime may be useful for modeling some aspects of the narrative.

What will be more difficult to model will be facts known to some parties but not to others, at any point in the narrative.

Unlike graph models where every vertex is connected to every other vertex.

As I type that, I wonder if the edge connecting a vertex (representing a person) to some fact or event (another vertex), could have a property that represents the time in the novel’s narrative when the person in question knows a fact or event?

I need to plot out knowledge of a lineage. If you know the novel you can guess which one. 😉

November 7, 2013

Enhancing Time Series Data by Applying Bitemporality

Filed under: Data,Time,Time Series,Timelines,Topic Maps — Patrick Durusau @ 5:30 pm

Enhancing Time Series Data by Applying Bitemporality (It’s not just what you know, it’s when you know it) by Jeffrey Shmain.

A “white paper” and all that implies but it raises the interesting question of setting time boundaries for the validity of data.

From the context of the paper, “bitemporality” means setting a start and end time for the validity of some unit of data.

We all know the static view of the world presented by most data systems is false. But it works well enough in some cases.

The problem is that most data systems don’t allow you to choose static versus some other view of the world.

In part because to get a non-static view, you have to modify your data system (often not a good idea) or migrate to another data system (which is expensive and not risk free) to obtain a non-static view of the world.

Jeffrey remarks in the paper that “all data is time series data” and he’s right. Data arrives at time X, was sent at time T, was logged at time Y, was seen by the CIO at Z, etc. To say nothing of tracking changes to that data.

Not all cases require that much detail but if you need it, wouldn’t it be nice to have?

Your present system may limit you to static views but topic maps can enhance your system in place. Avoiding the dangers of upgrading in place and/or migrating into unknown perils and hazards.

When did you know you needed time based validity for your data?

For a bit more technical view of bitemporality. (authored by Robbert van Dalen)

September 22, 2013

Relationship Timelines

Filed under: Associations,Networks,Time,Timelines — Patrick Durusau @ 3:09 pm

Relationship Timelines by Skye Bender-deMoll.

From the post:

I finally had a chance to pull together a bunch of interesting timeline examples–mostly about the U.S. Congress. Although several of these are about networks, the primary features being visualized are changes in group structure and membership over time. Should these be called “alluvial diagrams”, “stream graphs” “Sankey charts”, “phase diagrams”, “cluster timelines”?

From the U.S. Congress to characters in the Lord of the Rings (movie version) and beyond, Skye explores visualization of dynamic relationships over time.

Raises the interesting issue of how do you represent a dynamic relationship in a topic map?

For example, at some point in a topic map of a family, the mother and father did not know each other. At some later point they met, but were not yet married. Still later they were married and later still, had children. Other events in their lives happened before or after those major events.

Scope could segment off a segment of events, but you would have to create a date/time datatype or use one from the W3C, XML Schema Part 2: Datatypes Second Edition, for calculation of which scope precedes or follows another scope.

A closely related problem is to show what facts were known to a person at some point in time. Or as put by Howard Baker:

“What did the President know and when did he know it?” [During the Watergate Hearings

That may again be a relevant question in the not too distant future.

Suggestions for a robust topic map modeling solution would be most welcome!

November 24, 2012

Futures in literature from the past

Filed under: Graphics,Time,Timelines,Visualization — Patrick Durusau @ 7:58 pm

Futures in literature from the past by Nathan Yau.

Another very graphic post that merits your attention. In part because of the visualization and Nathan’s suggestions about it. How would you recast the data?

But in a topic map context, how would you represent past projections about the future, both when the future is the present, but also against other projected futures?

I ask because the “Dark Ages” weren’t called that at the time. And in fact, they were a fairly lively time of invention and innovation.

The term was coined in the Renaissance to distinguish their “enlightened” civilization from the “dark” times between them and the fall of the Roman Empire.

It is an old trick but none the less effective for being an old one.

Recent political elections offered a number of examples that will be recognized as such in the fullness of time.

July 23, 2012

Wrinkling Time

Filed under: Modeling,Time,Timelines,Topic Maps — Patrick Durusau @ 6:25 pm

The post by Dan Brickley that I mentioned earlier today, Dilbert schematics, made me start thinking about more complex time scenarios than serial assignment of cubicles.

Like Hermione Granger and Harry Potter’s adventure in the Prisoner of Azkaban.

For those of you who are vague on the story, Hermione uses a “Time-Turner” to go back in time several hours. As a result, she and Harry must avoid being seen by themselves (and others). Works quite well in the story but what if I wanted to model that narrative in a topic map?

Some issues/questions that occurred to me:

Harry and Hermione are the same subjects they were during the prior time interval. Or are they?

Does a linear notion of time mean they are different subjects?

How would I model their interactions with others? Such as Buckbeak? Who interacted with both versions (for lack of a better term) of Harry?

Is there a time line running parallel to the “original” time line?

Just curious, what happens if the Time-Turner fails and Harry and Hermoine don’t return to the present, ever? That is their “current” present is forever 3 hours behind their “real” present.

What other time issues, either in literature or elsewhere seem difficult to model to you?

April 11, 2012

Timeline Maps

Filed under: Mapping,Maps,Time,Timelines — Patrick Durusau @ 6:17 pm

Timeline Maps

From the post:

Mapping time has long been an interest of cartographers. Visualizing historical events in a timeline or chart or diagram is an effective way to show the rise and fall of empires and states, religious history, and important human and natural occurrences. We have over 100 examples in the Rumsey Map Collection, ranging in date from 1770 to 1967. We highlight a few below.

Sebastian Adams’ 1881 Synchronological Chart of Universal History is 23 feet long and shows 5,885 years of history, from 4004 B.C. to 1881 A.D. It is the longest timeline we have seen. The recently published Cartographies of Time calls it “nineteenth-century America’s surpassing achievement in complexity and synthetic power.” In the key to the map, Adams states that timeline maps enable learning and comprehension “through the eye to the mind.”

Below is a close up detail of a very small part of the chart: (click on the title or the image to open up the full chart)

Stunning visuals.

Our present day narratives aren’t any less arrogant than those of the 19th century but the distance is great enough for us to laugh at their presumption. Which unlike our own, isn’t “true.” 😉

Worth all the time you can spend with the maps. Likely to provoke insights into how you have viewed “history” as well as how you view current “events.”

Powered by WordPress