Easy Hierarchical Faceting and display with Solr and jQuery (and a tiny bit of Python) by Grant Ingersoll.
From the post:
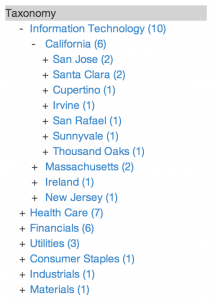
Visiting two major clients in two days last week, each presented me with the same question: how do we better leverage hierarchical information like taxonomies, file paths, etc. in LucidWorks Search (LWS) (and Apache Solr) their applications, such that they could display something like the following image in their UI:
Since this is pretty straight forward (much of it is captured already on the Solr Wiki) and I have both the client-side and server side code for this already in a few demos we routinely give here at Lucid, I thought I would write it up as a blog instead of sending each of them a one-off answer. I am going to be showing this work in the context of the LWS Financial Demo, for those who wish to follow along at the code level. We’ll use it to show a little bit of hierarchical faceting that correlates the industry sector of an S&P 500 company with the state and city of the HQ of that company. In your particular use case, you may wish to use it for organizing content in filesystems, websites, taxonomies or pretty much anything that exhibits, as the name implies, hierarchical relationships.
Who knew? Hierarchies are just like graphs! They’re everywhere! 😉
Grant closes by suggesting Solr analysis capabilities for faceting would be a nice addition to Solr. Are you game?
