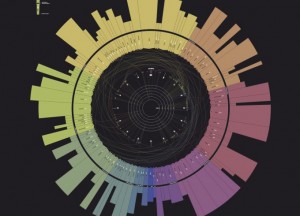
100 pieces of flute music – A quantified self project where music and design come together by Erika von Kelsch.
From the post:
(image: The final infographic | Erika von Kelsch)
The premise of the project was to organize 100 pieces of data into a static print piece. At least 7 metadata categories were to be included within the infographic, as well as a minimum of 3 overall data rollups. I chose 100 pieces of flute music that I have played that have been in my performance repertoire. Music was a potential career path for me, and the people and experiences I had through music influence how I view and explore the world around me to this day. The way I approach design is also influenced by what I learned from studying music, including the technical aspects of both flute and theory, as well as the emotional facets of performance. I decided to use this project as a vehicle to document this experience.
Not only is this a great visualization but the documentation of the design process is very impressive!
Have you ever attempted to document your design process during a project? That is what actually happened as opposed to what “must have happended” in the design process?
