Another Word For It Patrick Durusau on Topic Maps and Semantic Diversity

April 14, 2015

New Non-Meaningful NoSQL Benchmark

Filed under: Benchmarks,NoSQL — Patrick Durusau @ 5:57 am

New NoSQL benchmark: Cassandra, MongoDB, HBase, Couchbase by Jon Jensen.

From the post:

Today we are pleased to announce the results of a new NoSQL benchmark we did to compare scale-out performance of Apache Cassandra, MongoDB, Apache HBase, and Couchbase. This represents work done over 8 months by Josh Williams, and was commissioned by DataStax as an update to a similar 3-way NoSQL benchmark we did two years ago.

If you can guess the NoSQL database used by DataStax, then you already know the results of the benchmark test.

Amazing how that works isn’t it? I can’t think of a single benchmark test sponsored by a vendor that shows a technology option, other than their own, would be the better choice.

Technology vendors aren’t like Progressive where you can get competing quotes for automobile insurance.

Technology vendors are convinced that with just enough effort, your problem can be tamed to be met by their solution.

I won’t bother to list the one hundred and forty odd (140+) NoSQL databases that did not appear in this benchmark or use cases that would challenge the strengths and weaknesses of each one. Unless benchmarking is one of your use cases, ask vendors for performance characteristics based on your use cases. You will be less likely to be disappointed.

November 30, 2014

BigBench: Toward An Industry-Standard Benchmark for Big Data Analytics

Filed under: Benchmarks,BigData — Patrick Durusau @ 1:26 pm

BigBench: Toward An Industry-Standard Benchmark for Big Data Analytics by Bhaskar D Gowda and Nishkam Ravi.

From the post:

Benchmarking Big Data systems is an open problem. To address this concern, numerous hardware and software vendors are working together to create a comprehensive end-to-end big data benchmark suite called BigBench. BigBench builds upon and borrows elements from existing benchmarking efforts in the Big Data space (such as YCSB, TPC-xHS, GridMix, PigMix, HiBench, Big Data Benchmark, and TPC-DS). Intel and Cloudera, along with other industry partners, are working to define and implement extensions to BigBench 1.0. (A TPC proposal for BigBench 2.0 is in the works.)

BigBench Overview

BigBench is a specification-based benchmark with an open-source reference implementation kit, which sets it apart from its predecessors. As a specification-based benchmark, it would be technology-agnostic and provide the necessary formalism and flexibility to support multiple implementations. As a “kit”, it would lower the barrier of entry to benchmarking by providing a readily available reference implementation as a starting point. As open source, it would allow multiple implementations to co-exist in one place and be reused by different vendors, while providing consistency where expected for the ability to provide meaningful comparisons.

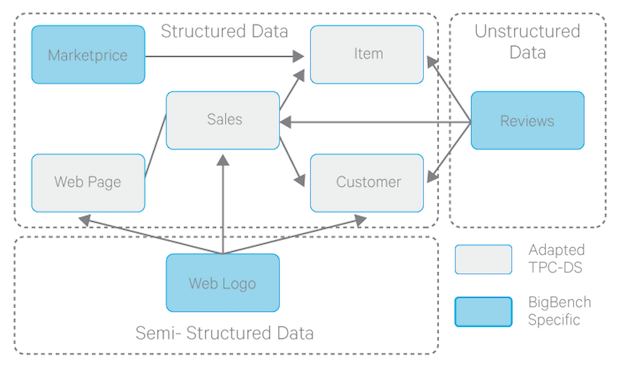
The BigBench specification comprises two key components: a data model specification, and a workload/query specification. The structured part of the BigBench data model is adopted from the TPC-DS data model depicting a product retailer, which sells products to customers via physical and online stores. BigBench’s schema uses the data of the store and web sales distribution channel and augments it with semi-structured and unstructured data as shown in Figure 1.

big bench figure 1

Figure 1: BigBench data model specification

The data model specification is implemented by a data generator, which is based on an extension of PDGF. Plugins for PDGF enable data generation for an arbitrary schema. Using the BigBench plugin, data can be generated for all three pats of the schema: structured, semi-structured and unstructured.

BigBench 1.0 workload specification consists of 30 queries/workloads. Ten of these queries have been taken from the TPC-DS workload and run against the structured part of the schema. The remaining 20 were adapted from a McKinsey report on Big Data use cases and opportunities. Seven of these run against the semi-structured portion and five run against the unstructured portion of the schema. The reference implementation of the workload specification is available here.

BigBench 1.0 specification includes a set of metrics (focused around execution time calculation) and multiple execution modes. The metrics can be reported for the end-to-end execution pipeline as well as each individual workload/query. The benchmark also defines a model for submitting concurrent workload streams in parallel, which can be extended to simulate the multi-user scenario.

The post continues with plans for BigBench 2.0 and Intel tests using BigBench 1.0 against various hardware configurations.

An important effort and very much worth your time to monitor.

None other than the Open Data Institute and Thomson Reuters have found that identifiers are critical to bringing value to data. With that realization and the need to map between different identifiers, there is an opportunity for identifier benchmarks in BigData. Identifiers that have documented semantics and the ability to merge with other identifiers.

A benchmark for BigData identifiers would achieve two very important goals:

First, it would give potential users a rough gauge of the amount of effort required to reach some X goal of identifiers. The cost of identifiers will vary for data set to data set but having no cost information at all, leaves potential users to expect the worst.

Second, as with the BigBench benchmark, potential users could compare apples to apples in judging the performance and characteristics of identifier schemes (such as topic map merging).

Both of those goals seem like worthy ones to me.

You?

July 23, 2014

Choke-Point based Benchmark Design

Filed under: Benchmarks,Graphs,Linked Data — Patrick Durusau @ 7:05 pm

Choke-Point based Benchmark Design by Peter Boncz.

From the post:

The Linked Data Benchmark Council (LDBC) mission is to design and maintain benchmarks for graph data management systems, and establish and enforce standards in running these benchmarks, and publish and arbitrate around the official benchmark results. The council and its ldbcouncil.org website just launched, and in its first 1.5 year of existence, most effort at LDBC has gone into investigating the needs of the field through interaction with the LDBC Technical User Community (next TUC meeting will be on October 5 in Athens) and indeed in designing benchmarks.

So, what makes a good benchmark design? Many talented people have paved our way in addressing this question and for relational database systems specifically the benchmarks produced by TPC have been very helpful in maturing relational database technology, and making it successful. Good benchmarks are relevant and representative (address important challenges encountered in practice), understandable , economical (implementable on simple hardware), fair (such as not to favor a particular product or approach), scalable, accepted by the community and public (e.g. all of its software is available in open source). This list stems from Jim Gray’s Benchmark Handbook. In this blogpost, I will share some thoughts on each of these aspects of good benchmark design.

Just in case you want to start preparing for the Athens meeting:

The Social Network Benchmark 0.1 draft and supplemental materials.

The Semantic Publishing Benchmark 0.1 draft and supplemental materials.

Take the opportunity to download the benchmark materials edited by Jim Gray. Will be useful in evaluating the benchmarks of the LDBC.

July 11, 2014

LDBC benchmarks reach Public Draft

Filed under: Benchmarks,Linked Data — Patrick Durusau @ 4:12 pm

LDBC benchmarks reach Public Draft

From the post:

The Linked Data Benchmark Council (LDBC) is reaching a milestone today, June 23 2014, in announcing that two of the benchmarks that it has been developing since 1.5 years have now reached the status of Public Draft. This concerns the Semantic Publishing Benchmark (SPB) and the interactive workload of the Social Network Benchmark (SNB). In case of LDBC, the release is staged: now the benchmark software just runs read-only queries. This will be expanded in a few weeks with a mix of read- and insert-queries. Also, query validation will be added later. Watch this blog for the announcements to come, as this will be a matter of weeks to add.

The Public Draft stage means that the initial software (data generator, query driver) work and an initial technical specification and documentation has been written. In other words, there is a testable version of the benchmark available for anyone who is interested. Public Draft status does not mean that the benchmark has been adopted yet, it rather means that LDBC has come closer to adopting them, but is now soliciting feedback from the users. The benchmarks will remain in this stage at least until October 6. On that date, LDBC is organizing its fifth Technical User Community meeting. One of the themes for that meeting is collecting user feedback on the Public Drafts; which input will be used to either further evolve the benchmarks, or adopt them.

You can also see that we created a this new website and a new logo. This website is different from http://ldbc.eu that describes the EU project which kick-starts LDBC. The ldbcouncil.org is a website maintained by the Linked Data Benchmark Council legal entity, which will live on after the EU project stops (in less than a year). The Linked Data Benchmark Council is an independent, impartial, member-sustained organization dedicated to the creation of RDF and graph data management benchmarks and benchmark practices.

What do you expect with an announcement of a public review draft?

A link to the public review draft?

If so, you are out of luck with the new Linked Data Benchmark Council website. Nice looking website, poor on content.

Let me help out:

The Social Network Benchmark 0.1 draft and supplemental materials.

The Semantic Publishing Benchmark 0.1 draft and supplemental materials.

Pointing readers to drafts makes it easier for them to submit comments. These drafts will remain open for comments “at least until October 6” according to the post.

At which time they will be further evolved or adopted? Suggest you review and get your comments in early.

March 6, 2014

Bersys 2014!

Filed under: Benchmarks,RDF,SPARQL — Patrick Durusau @ 2:18 pm

Bersys 2014!

From the webpage:

Following the 1st International workshop on Benchmarking RDF Systems (BeRSys 2013) the aim of the BeRSys 2014 workshop is to provide a discussion forum where researchers and industrials can meet to discuss topics related to the performance of RDF systems. BeRSys 2014 is the only workshop dedicated to benchmarking different aspects of RDF engines – in the line of TPCTC series of workshops.The focus of the workshop is to expose and initiate discussions on best practices, different application needs and scenarios related to different aspects of RDF data management.

We will solicit contributions presenting experiences with benchmarking RDF systems, real-life RDF application needs which are good candidates for benchmarking, as well as novel ideas on developing benchmarks for different aspects of RDF data management ranging from query processing, reasoning to data integration. More specifically, we will welcome contributions from a diverse set of domain areas such as life science (bio-informatics, pharmaceutical), social networks, cultural informatics, news, digital forensics, e-science (astronomy, geology) and geographical among others. More specifically, the topics of interest include but are not limited to:

  • Descriptions of RDF data management use cases and query workloads
  • Benchmarks for RDF SPARQL 1.0 and SPARQL 1.1 query workloads
  • Benchmarks RDF data integration tasks including but not limited to ontology aligment, instance matching and ETL techniques
  • Benchmark metrics
  • Temporal and geospatial benchmarks
  • Evaluation of benchmark performance results on RDF engines
  • Benchmark principles
  • Query processing and optimization algorithms for RDF systems.

Venue:

The workshop is held in conjuction with the 40th International Conference on Very Large Data Bases (VLDB2014) in Hangzhou, China.

The only date listed on the announcement is September 1-5, 2014 for the workshop.

When other dates appear, I will update this post and re-post about the conference.

As you have seen in better papers on graphs, RDF, etc., benchmarking in this area is a perilous affair. Workshops, like this one, are one step towards building the experience necessary to consider the topic of benchmarking.

I first saw this in a tweet by Stefano Bertolo.

February 10, 2014

Parallel Data Generation Framework

Filed under: Benchmarks,Data — Patrick Durusau @ 11:06 am

Parallel Data Generation Framework

From the webpage:

The Parallel Data Generation Framework (PDGF) is a generic data generator for database benchmarking. Its development started at the University of Passau at the group of Prof. Dr. Harald Kosch.

PDGF was designed to take advantage of today’s multi-core processors and large clusters of computers to generate large amounts of synthetic benchmark data very fast. PDGF uses a fully computational approach and is a pure Java implementation which makes it very portable.

I mention this to ask if you are aware of methods for generating unstructured text with known characteristics such as the number of entities and their representations in the data set?

A “natural” dataset, say blog posts or emails, etc., can be probed to determine its semantic characteristics but I am interested in generation of a dataset with known semantic characteristics.

Thoughts?

I first saw this in a tweet by Stefano Bertolo.

February 5, 2014

SNB Graph Generator

Filed under: Benchmarks,Linked Data — Patrick Durusau @ 3:47 pm

Social Network Benchmark (SNB) Graph Generator by Peter Boncz.

Slides from FOSDEM2014.

Be forewarned, the slide are difficult to read due to heavy background images.

Slide 17 will be of interest because of computed “…similarity of two nodes based on their (correlated) properties.” (Rhymes with “merging.”) Computationally expensive.

Slide 18, disregard nodes with too large similarity distance.

Slide 41 points to:

github.com/ldbc

ldbc.eu:8090/display/TUC

And a truncated link that I think points to:

LDBC_Status of the Semantic Publishing Benchmark.pdf but it is difficult to say because that link opens a page of fifteen (15) PDF files.

If you select “download all” it will deliver the files to you in one zip file.

January 8, 2014

BigDataBench:…

Filed under: Benchmarks,BigData — Patrick Durusau @ 11:07 am

BigDataBench: a Big Data Benchmark Suite from Internet Services by Lei Wang, et.al.

Abstract:

As architecture, systems, and data management communities pay greater attention to innovative big data systems and architecture, the pressure of benchmarking and evaluating these systems rises. However, the complexity, diversity, frequently changed workloads, and rapid evolution of big data systems raise great challenges in big data benchmarking. Considering the broad use of big data systems, for the sake of fairness, big data benchmarks must include diversity of data and workloads, which is the prerequisite for evaluating big data systems and architecture. Most of the state-of-the-art big data benchmarking efforts target evaluating specific types of applications or system software stacks, and hence they are not qualified for serving the purposes mentioned above.

This paper presents our joint research efforts on this issue with several industrial partners. Our big data benchmark suite—BigDataBench not only covers broad application scenarios, but also includes diverse and representative data sets. Currently, we choose 19 big data benchmarks from dimensions of application scenarios, operations/ algorithms, data types, data sources, software stacks, and application types, and they are comprehensive for fairly measuring and evaluating big data systems and architecture. BigDataBench is publicly available from the project home page http://prof.ict.ac.cn/BigDataBench.

Also, we comprehensively characterize 19 big data workloads included in BigDataBench with varying data inputs. On a typical state-of-practice processor, Intel Xeon E5645, we have the following observations: First, in comparison with the traditional benchmarks: including PARSEC, HPCC, and SPECCPU, big data applications have very low operation intensity, which measures the ratio of the total number of instructions divided by the total byte number of memory accesses; Second, the volume of data input has non-negligible impact on micro-architecture characteristics, which may impose challenges for simulation-based big data architecture research; Last but not least, corroborating the observations in CloudSuite and DCBench (which use smaller data inputs), we find that the numbers of L1 instruction cache (L1I) misses per 1000 instructions (in short, MPKI) of the big data applications are higher than in the traditional benchmarks; also, we find that L3 caches are effective for the big data applications, corroborating the observation in DCBench.

An excellent summary of current big data benchmarks along with datasets and diverse benchmarks for varying big data inputs.

I emphasize diverse because we have all known “big data” covers a wide variety of data. Unfortunately, that hasn’t always been a point of emphasis. This paper corrects that oversight.

The User_Manual for Big Data Bench 2.1.

Summaries of the data sets and benchmarks:

No. data sets data size

1

Wikipedia Entries

4,300,000 English articles

2

Amazon Movie Reviews

7,911,684 reviews

3

Google Web Graph

875713 nodes, 5105039 edges

4

Facebook Social Network

4039 nodes, 88234 edges

5

E-commerce Transaction Data

table1: 4 columns, 38658 rows.

table2: 6 columns, 242735 rows

6

ProfSearch Person Resumes

278956 resumes


Table 2: The Summary of BigDataBench

Application Scenarios

Operations & Algorithm

Data Type

Data Source

Software stack

Application type

Micro Benchmarks

Sort

Unstructured

Text

MapReduce, Spark, MPI

Offline Analytics

Grep

Unstructured

Text

MapReduce, Spark, MPI

Offline Analytics

WordCount

Unstructured

Text

MapReduce, Spark, MPI

Offline Analytics

BFS

Unstructured

Graph

MapReduce, Spark, MPI

Offline Analytics

Basic Datastore Operations (“Cloud OLTP”)

Read

Semi-structured

Table

Hbase, Cassandra, MongoDB, MySQL

Online Service

Write

Semi-structured

Table

Hbase, Cassandra, MongoDB, MySQL

Online Services

Scan

Semi-structured

Table

Hbase, Cassandra, MongoDB, MySQL

Online Services

Relational Query

Select Query

Structured

Table

Impala, Shark, MySQL, Hive

Realtime Analytics

Aggregate Query

Structured

Table

Impala, Shark, MySQL, Hive

Realtime Analytics

Join Query

Structured

Table

Impala, Shark, MySQL, Hive

Realtime Analytics

Search Engine

Nutch Server

Structured

Table

Hadoop

Online Services

PageRank

Unstructured

Graph

Hadoop, MPI, Spark

Offline Analytics

Index

Unstructured

Text

Hadoop, MPI, Spark

Offline Analytics

Social Network

Olio Server

Structured

Table

MySQL

Online Service

K-means

Unstructured

Graph

Hadoop, MPI, Spark

Offline Analytics

Connected Com-ponents

Unstructured

Graph

Hadoop, MPI, Spark

Offline Analytics

E-commerce

Rubis Server

Structured

Table

MySQL

Online Service

Collaborative Filtering

Unstructured

Text

Hadoop, MPI, Spark

Offline Analytics

Naive Bayes

Unstructrued

Text

Hadoop, MPI, Spark

Offline Analytics

I first saw this in a tweet by Stefano Bertolo.

December 4, 2013

To fairly compare…

Filed under: Benchmarks,Graphs,Linked Data — Patrick Durusau @ 3:27 pm

LDBC D3.3.1 Use case analysis and choke point analysis Coordinators: Alex Averbuch and Norbert Martinez.

From the introduction:

Due largely to the Web, an exponentially increasing amount of data is generated each year. Moreover, a significant fraction of this data is unstructured, or semi-structured at best. This has meant that traditional data models are becoming increasingly restrictive and unsuitable for many application domains – the relational model in particular has been criticized for its lack of semantics. These trends have driven development of alternative database technologies, including graph databases.

The proliferation of applications dealing with complex networks has resulted in an increasing number of graph database deployments. This, in turn, has created demand for a means by which to compare the characteristics of different graph database technologies, such as: performance, data model, query expressiveness, as well as general functional and non-functional capabilities.

To fairly compare these technologies it is essential to first have a thorough understanding of graph data models, graph operations, graph datasets, graph workloads, and the interactions between all of these. (emphasis added)

In this rather brief report, the LDBC (Linked Data Benchmark Council) gives a thumbnail sketch of the varieties of graphs, graph databases, graph query languages, along with some summary use cases. To their credit, unlike some graph vendors, they do understand what is meant by a hyperedge. (see p.8)

On the other hand, they retreat from the full generality of graph models to “directed attributed multigraphs,” before evaluating any of the graph alternatives. (also at p.8)

It may be a personal prejudice but I would prefer to see fuller development of use cases and requirements before restricting the solution space.

Particularly since new developments in graph theory and/or technology are a weekly if not daily occurrence.

Premature focus on “unsettled” technology could result in a benchmark for yesterday’s version of graph technology.

Interesting I suppose but not terribly useful.

December 3, 2013

Benchmarking Honesty

Filed under: Benchmarks,FoundationDB — Patrick Durusau @ 6:43 pm

Benchmarking Honesty by David Rosenthal.

From the post:

Recently, someone brought to my attention a blog post that benchmarks FoundationDB and another responding to the benchmark itself. I’ll weigh in: I think this benchmark is unfair because it gives people too good an impression of FoundationDB’s performance. In the benchmark, 100,000 items are loaded into each database/storage engine in both sequential and random patterns. In the case of FoundationDB and other sophisticated systems like SQL Server, you can see that the performance of random and sequential writes are virtually the same; this points to the problem. In the case of FoundationDB, an “absorption” mechanism is able to cope with bursts of writes (on the order of a minute or two, usually) without actually updating the real data structures holding the data (i.e. only persisting a log to disk, and making changes available to read from RAM). Hence, the published test results are giving FoundationDB an unfair advantage. I think that you will find that if you sustain this workload for a longer time, like in real-world usages, FoundationDB might be significantly slower.

If you don’t recognize the name, David Rosenthal is the co-founder and CEO of FoundationDB.

What?

A CEO saying a benchmark favorable to his product is “unfair?”

Odd as it may sound, I think there is an honest CEO on the loose.

Statistically speaking, it had to happen eventually. 😉

Seriously, high marks to David Rosenthal. We need more CEOs, engineers and presenters with a sense of honesty.

October 18, 2013

Updated conclusions about the graph database benchmark…

Filed under: Benchmarks,Graphs,Neo4j — Patrick Durusau @ 4:44 pm

Updated conclusions about the graph database benchmark – Neo4j can perform much better by Alex Popescu.

You may recall in Benchmarking Graph Databases I reported on a comparison of Neo4j against three relational databases, MySQL, Vertica and VoltDB.

Alex has listed resources relevant to the response from the original testers:

Our conclusions from this are that, like any of the complex systems we tested, properly tuning Neo4j can be tricky and getting optimal performance may require some experimentation with parameters. Whether a user of Neo4j can expect to see runtimes on graphs like this measured in milliseconds or seconds depends on workload characteristics (warm / cold cache) and whether setup steps can be amortized across many queries or not.

The response, Benchmarking Graph Databases – Updates, shows that Neo4j on shortest path outperforms MySQL, Vertica and VoltDB.

But scores on shortest path don’t appear for MySQL, Vertica and VoltDB on shortest path in the “Updates” post.

Let me help you with that.

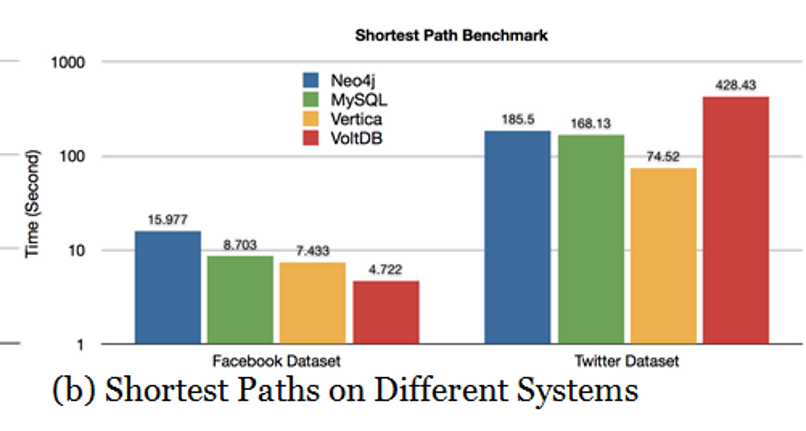
Here is the original comparison:

Original comparison on shortest path

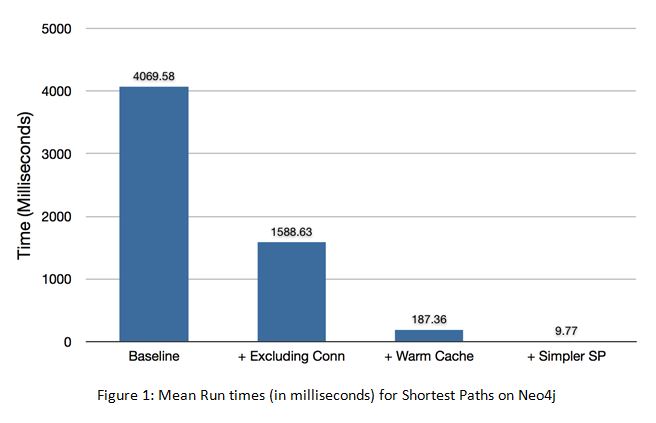
Here is Neo4j shortest path after reading the docs and suggestions from Neo4j tech support:

Neo4j shortest path

First graph has time in seconds, second graph has time in milliseconds.

Set up correctly, measure milliseconds on shortest path for Neo4j. SQL solutions, well, the numbers speak for themselves.

The moral here is to read software documentation and contact tech support before performing and publishing benchmarks.

September 25, 2013

Benchmarking Graph Databases

Filed under: Benchmarks,Giraph,GraphLab,MySQL,Neo4j — Patrick Durusau @ 3:33 pm

Benchmarking Graph Databases by Alekh Jindal.

Speaking of data skepticism.

From the post:

Graph data management has recently received a lot of attention, particularly with the explosion of social media and other complex, inter-dependent datasets. As a result, a number of graph data management systems have been proposed. But this brings us to the question: What happens to the good old relational database systems (RDBMSs) in the context of graph data management?

The article names some of the usual graph database suspects.

But for its comparison, it selects only one (Neo4j) and compares it against three relational databases, MySQL, Vertica and VoltDB.

What’s missing? How about expanding to include GraphLab (GraphLab – Next Generation [Johnny Come Lately VCs]) and Giraph (Scaling Apache Giraph to a trillion edges) or some of the other heavy hitters (insert your favorite) in the graph world?

Nothing against Neo4j. It is making rapid progress on a query language and isn’t hard to learn. But it lacks the raw processing power of an application like Apache Giraph. Giraph, after all, is used to process the entire Facebook data set, not a “4k nodes and 88k edges” Facebook sample as in this comparison.

Not to mention that only two algorithms were used in this comparison: PageRank and Shortest Paths.

Personally I can imagine users being interested in running more than two algorithms. But that’s just me.

Every benchmarking project has to start somewhere but this sort of comparison doesn’t really advance the discussion of competing technologies.

Not that any comparison would be complete without a discussion of typical uses cases and user observations on how each candidate did or did not meet their expectations.

September 13, 2013

An empirical comparison of graph databases

Filed under: Benchmarks,DEX,Graphs,Neo4j,OrientDB,Titan — Patrick Durusau @ 2:39 pm

An empirical comparison of graph databases by Salim Jouili and Valentin Vansteenberghe.

Abstract:

In recent years, more and more companies provide services that can not be anymore achieved efficiently using relational databases. As such, these companies are forced to use alternative database models such as XML databases, object-oriented databases, document-oriented databases and, more recently graph databases. Graph databases only exist for a few years. Although there have been some comparison attempts, they are mostly focused on certain aspects only.

In this paper, we present a distributed graph database comparison framework and the results we obtained by comparing four important players in the graph databases market: Neo4j, OrientDB, Titan and DEX.

(Salim Jouili and Valentin Vansteenberghe, An empirical comparison of graph databases. To appear in Proceedings of the 2013 ASE/IEEE International Conference on Big Data, Washington D.C., USA, September 2013.)

For your convenience:

DEX

Neo4j

OrientDB

Titan

I won’t reproduce the comparison graphs here. The “winner” depends on your requirements.

Looking forward to seeing this graph benchmark develop!

June 27, 2013

Big Data Benchmark

Filed under: Benchmarks,BigData — Patrick Durusau @ 1:57 pm

Big Data Benchmark

From the webpage:

This is an open source benchmark which compares the performance of several large scale data-processing frameworks.

Introduction

Several analytic frameworks have been announced in the last six months. Among them are inexpensive data-warehousing solutions based on traditional Massively Parallel Processor (MPP) architectures (Redshift), systems which impose MPP-like execution engines on top of Hadoop (Impala, HAWQ) and systems which optimize MapReduce to improve performance on analytical workloads (Shark, Stinger). This benchmark provides quantitative and qualitative comparisons of four sytems. It is entirely hosted on EC2 and can be reproduced directly from your computer.

  • Redshift – a hosted MPP database offered by Amazon.com based on the ParAccel data warehouse.
  • Hive – a Hadoop-based data warehousing system. (v0.10, 1/2013 Note: Hive v0.11, which advertises improved performance, was recently released but is not yet included)
  • Shark – a Hive-compatible SQL engine which runs on top of the Spark computing framework. (v0.8 preview, 5/2013)
  • Impala – a Hive-compatible* SQL engine with its own MPP-like execution engine. (v1.0, 4/2013)

This remains a work in progress and will evolve to include additional frameworks and new capabilities. We welcome contributions.

What is being evaluated?

This benchmark measures response time on a handful of relational queries: scans, aggregations, joins, and UDF’s, across different data sizes. Keep in mind that these systems have very different sets of capabilities. MapReduce-like systems (Shark/Hive) target flexible and large-scale computation, supporting complex User Defined Functions (UDF’s), tolerating failures, and scaling to thousands of nodes. Traditional MPP databases are strictly SQL compliant and heavily optimized for relational queries. The workload here is simply one set of queries that most of these systems these can complete.

Benchmarks were mentioned in a discussion at the XTM group on LinkedIn.

Not sure these would be directly applicable but should prove to be useful background material.

I first saw this at Danny Bickson’s Shark @ SIGMOD workshop.

Danny points to Reynold Xin’s Shark talk at SIGMOD GRADES workshop. General overview but worth your time.

Danny also points out that Reynold Xin will be presenting on GraphX at the GraphLab workshop Monday July 1st in SF.

I can’t imagine why that came to mind. 😉

May 31, 2013

Big Data RDF Store Benchmarking Experiences

Filed under: Benchmarks,BigData,RDF — Patrick Durusau @ 1:48 pm

Big Data RDF Store Benchmarking Experiences by Peter Boncz.

From the post:

Recently we were able to present new BSBM results, testing the RDF triple stores Jena TDB, BigData, BIGOWLIM and Virtuoso on various data sizes. These results extend the state-of-the-art in various dimensions:

  • scale: this is the first time that RDF store benchmark results on such a large size have been published. The previous published BSBM results published were on 200M triples, the 150B experiments thus mark a 750x increase in scale.
  • workload: this is the first time that results on the Business Intelligence (BI) workload are published. In contrast to the Explore workload, which features short-running “transactional” queries, the BI workload consists of queries that go through possibly billions of triples, grouping and aggregating them (using the respective functionality, new in SPARQL1.1).
  • architecture: this is the first time that RDF store technology with cluster functionality has been publicly benchmarked.

Clusters are great but also difficult to use.

Peter’s post is one of those rare ones that exposes the second half of that statement.

Impressive hardware and results.

Given the hardware and effort required, are we pursuing “big data” for the sake of “big data?”

Not just where RDF is concerned but in general?

Shouldn’t the first question always be: What is the relevant data?

If you can’t articulate the relevant data, isn’t that a commentary on your understanding of the problem?

April 30, 2013

XDGBench: 3rd party benchmark results against graph databases [some graph databases]

Filed under: AllegroGraph,Benchmarks,Fuseki,Neo4j,OrientDB — Patrick Durusau @ 2:19 pm

XDGBench: 3rd party benchmark results against graph databases by Luca Garulli.

From the post:

Toyotaro Suzumura and Miyuru Dayarathna from the Department of Computer Science of the Tokyo Institute of Technology and IBM Research published an interesting research about a benchmark between Graph Databases in the Clouds called:

XGDBench: A Benchmarking Platform for Graph Stores in Exascale Clouds”

This research conducts a performance evaluation of four famous graph data stores AllegroGraph, Fuseki, Neo4j, an OrientDB using XGDBench on Tsubame 2.0 HPC cloud environment. XGDBench is an extension of famous Yahoo! Cloud Serving Benchmark (YCSB).

OrientDB is the faster Graph Database among the 4 products tested. In particular OrientDB is about 10x faster (!) than Neo4j in all the tests.

Look at the Presentation (25 slides) and Research PDF.

Researchers are free to pick any software packages for comparison but the selection here struck me as odd before reading a comment on the original post asking for ObjectivityDB be added to the comparison.

For that matter, where are GraphChi, Infinite Graph, Dex, Titan, FlockDB? Just to call a few of the other potential candidates out.

Will be interesting when a non-winner on such a benchmark cites it for the proposition that easy of use, reliability, lower TOC outweighs brute speed in a benchmark test.

April 19, 2013

Yahoo! Cloud Serving Benchmark

Filed under: Benchmarks,YCSB — Patrick Durusau @ 1:45 pm

Yahoo! Cloud Serving Benchmark

From the webpage:

With the many new serving databases available including Sherpa, BigTable, Azure and many more, it can be difficult to decide which system is right for your application, partially because the features differ between systems, and partially because there is not an easy way to compare the performance of one system versus another.

The goal of the Yahoo! Cloud Serving Benchmark (YCSB) project is to develop a framework and common set of workloads for evaluating the performance of different “key-value” and “cloud” serving stores.

The project comprises two areas:

  • The YCSB Client, an extensible workload generator
  • The Core workloads, a set of workload scenarios to be executed by the generator

Although the core workloads provide a well-rounded picture of a system’s performance, the Client is extensible so that you can define new and different workloads to examine system aspects, or application scenarios, not adequately covered by the core workload. Similarly, the Client is extensible to support benchmarking different databases. Although we include sample code for benchmarking HBase and Cassandra, it is straightforward to write a new interface layer to benchmark your favorite database.

A common use of the tool is to benchmark multiple systems and compare them. For example, you can install multiple systems on the same hardware configuration, and run the same workloads against each system. Then you can plot the performance of each system (for example, as latency versus throughput curves) to see when one system does better than another.

The Yahoo! Cloud Serving Benchmark (YCSB) doesn’t get discussed in the video and only briefly in the paper: How to Compare NoSQL Databases.

YCSB source code and Benchmarking Cloud Serving Systems with YCSB may be helpful.

Performance of databases depend upon your point of view, benchmarks and their application and no doubt other causes as well.

Would make an interesting topic map project to make create a comparison of the metrics from different benchmarks and to attempt to create a crosswalk between them.

That would require a very deep and explicit definition of commonalities and differences between the benchmarks and their application to various database architectures.

How to Compare NoSQL Databases

Filed under: Aerospike,Benchmarks,Cassandra,Couchbase,Database,MongoDB,NoSQL — Patrick Durusau @ 12:45 pm

How to Compare NoSQL Databases by Ben Engber. (video)

From the description:

Ben Engber, CEO and founder of Thumbtack Technology, will discuss how to perform tuned benchmarking across a number of NoSQL solutions (Couchbase, Aerospike, MongoDB, Cassandra, HBase, others) and to do so in a way that does not artificially distort the data in favor of a particular database or storage paradigm. This includes hardware and software configurations, as well as ways of measuring to ensure repeatable results.

We also discuss how to extend benchmarking tests to simulate different kinds of failure scenarios to help evaluate the maintainablility and recoverability of different systems. This requires carefully constructed tests and significant knowledge of the underlying databases — the talk will help evaluators overcome the common pitfalls and time sinks involved in trying to measure this.

Lastly we discuss the YCSB benchmarking tool, its significant limitations, and the significant extensions and supplementary tools Thumbtack has created to provide distributed load generation and failure simulation.

Ben makes a very good case for understanding the details of your use case versus the characteristics of particular NoSQL solutions.

Where you will find “better” performance depends on non-obvious details.

Watch the use of terms like “consistency” in this presentation.

The paper Ben refers to: Ultra-High Performance NoSQL Benchmarking: Analyzing Durability and Performance Tradeoffs.

Forty-three pages of analysis and charts.

Slow but interesting reading.

If you are into the details of performance and NoSQL databases.

April 2, 2013

LinkBench [Graph Benchmark]

Filed under: Benchmarks,Facebook,Graphs — Patrick Durusau @ 10:14 am

LinkBench

From the webpage:

LinkBench Overview

LinkBench is a database benchmark developed to evaluate database performance for workloads similar to those of Facebook’s production MySQL deployment. LinkBench is highly configurable and extensible. It can be reconfigured to simulate a variety of workloads and plugins can be written for benchmarking additional database systems.

LinkBench is released under the Apache License, Version 2.0.

Background

One way of modeling social network data is as a social graph, where entities or nodes such as people, posts, comments and pages are connected by links which model different relationships between the nodes. Different types of links can represent friendship between two users, a user liking another object, ownership of a post, or any relationship you like. These nodes and links carry metadata such as their type, timestamps and version numbers, along with arbitrary payload data.

Facebook represents much of its data in this way, with the data stored in MySQL databases. The goal of LinkBench is to emulate the social graph database workload and provide a realistic benchmark for database performance on social workloads. LinkBench’s data model is based on the social graph, and LinkBench has the ability to generate a large synthetic social graph with key properties similar to the real graph. The workload of database operations is based on Facebook’s production workload, and is also generated in such a way that key properties of the workload match the production workload.

A benchmark for testing your graph database performance!

Additional details at: LinkBench: A database benchmark for the social graph by Tim Armstrong.

I first saw this in a tweet by Stefano Bertolo.

March 16, 2013

Algebraix Data Achieves Unrivaled Semantic Benchmark Performance

Filed under: Benchmarks,RDF,Semantic Web — Patrick Durusau @ 7:24 pm

Algebraix Data Achieves Unrivaled Semantic Benchmark Performance by Angela Guess.

From the post:

Algebraix Data Corporation today announced its SPARQL Server(TM) RDF database successfully executed all 17 of its queries on the SP2 benchmark up to one billion triples on one computer node. The SP2 benchmark is the most computationally complex for testing SPARQL performance and no other vendor has reported results for all queries on data sizes above five million triples.

Furthermore, SPARQL Server demonstrated linear performance in total SP2Bench query time on data sets from one million to one billion triples. These latest dramatic results are made possible by algebraic optimization techniques that maximize computing resource utilization.

“Our outstanding SPARQL Server performance is a direct result of the algebraic techniques enabled by our patented Algebraix technology,” said Charlie Silver, CEO of Algebraix Data. “We are investing heavily in the development of SPARQL Server to continue making substantial additional functional, performance and scalability improvements.”

Pretty much a copy of the press release from Algebraix.

You may find:

Doing the Math: The Algebraix DataBase Whitepaper: What it is, how it works, why we need it (PDF) by Robin Bloor, PhD

ALGEBRAIX Technology Mathematics Whitepaper (PDF), by Algebraix Data

and,

Granted Patents

more useful.

BTW, The SP²Bench SPARQL Performance Benchmark, will be useful as well.

Algebraix listed its patents but I supplied the links. Why the links were missing at Algebraix I cannot say.

If the “…no other vendor has reported results for all queries on data sizes above five million triples…” is correct, isn’t scaling an issue for SQARQL?

February 24, 2013

S3G2: A Scalable Structure-Correlated Social Graph Generator

Filed under: Benchmarks,Graph Analytics,Graph Database Benchmark,Graphs — Patrick Durusau @ 5:17 pm

S3G2: A Scalable Structure-Correlated Social Graph Generator by Minh-Duc Pham, Peter Boncz, Orri Erling. (The same text you will find at: Selected Topics in Performance Evaluation and Benchmarking Lecture Notes in Computer Science Volume 7755, 2013, pp 156-172. DOI: 10.1007/978-3-642-36727-4_11)

Abstract:

Benchmarking graph-oriented database workloads and graph-oriented database systems is increasingly becoming relevant in analytical Big Data tasks, such as social network analysis. In graph data, structure is not mainly found inside the nodes, but especially in the way nodes happen to be connected, i.e. structural correlations. Because such structural correlations determine join fan-outs experienced by graph analysis algorithms and graph query executors, they are an essential, yet typically neglected, ingredient of synthetic graph generators. To address this, we present S3G2: a Scalable Structure-correlated Social Graph Generator. This graph generator creates a synthetic social graph, containing non-uniform value distributions and structural correlations, which is intended as test data for scalable graph analysis algorithms and graph database systems. We generalize the problem by decomposing correlated graph generation in multiple passes that each focus on one so-called correlation dimension; each of which can be mapped to a MapReduce task. We show that S3G2 can generate social graphs that (i) share well-known graph connectivity characteristics typically found in real social graphs (ii) contain certain plausible structural correlations that influence the performance of graph analysis algorithms and queries, and (iii) can be quickly generated at huge sizes on common cluster hardware.

You may also want to see the slides.

What a nice way to start the week!

Enjoy!

I first saw this at Datanami.

February 13, 2013

TPC Benchmark H

Filed under: Benchmarks,TPC-H — Patrick Durusau @ 1:14 pm

TPC Benchmark H

From the webpage:

Summary

The TPC Benchmark™H (TPC-H) is a decision support benchmark. It consists of a suite of business oriented ad-hoc queries and concurrent data modifications. The queries and the data populating the database have been chosen to have broad industry-wide relevance. This benchmark illustrates decision support systems that examine large volumes of data, execute queries with a high degree of complexity, and give answers to critical business questions.

The performance metric reported by TPC-H is called the TPC-H Composite Query-per-Hour Performance Metric (QphH@Size), and reflects multiple aspects of the capability of the system to process queries. These aspects include the selected database size against which the queries are executed, the query processing power when queries are submitted by a single stream, and the query throughput when queries are submitted by multiple concurrent users. The TPC-H Price/Performance metric is expressed as $/QphH@Size.

Just in case you want to incorporate the TPC-H benchmark into your NoSQL solution.

I don’t recall any literature on benchmarks for semantic integration solutions.

At least in the sense of either the speed of semantic integration based on some test of semantic equivalence or the range of semantic equivalents handled by a particular engine.

You?

December 14, 2012

Semantic Technology ROI: Article of Faith? or Benchmarks for 1.28% of the web?

Filed under: Benchmarks,Marketing,Performance,RDFa,Semantic Web — Patrick Durusau @ 3:58 pm

Orri Erling, in LDBC: A Socio-technical Perspective, writes in part:

I had a conversation with Michael at a DERI meeting a couple of years ago about measuring the total cost of technology adoption, thus including socio-technical aspects such as acceptance by users, learning curves of various stakeholders, whether in fact one could demonstrate an overall gain in productivity arising from semantic technologies. [in my words, paraphrased]

“Can one measure the effectiveness of different approaches to data integration?” asked I.

“Of course one can,” answered Michael, “this only involves carrying out the same task with two different technologies, two different teams and then doing a double blind test with users. However, this never happens. Nobody does this because doing the task even once in a large organization is enormously costly and nobody will even seriously consider doubling the expense.”

LDBC does in fact intend to address technical aspects of data integration, i.e., schema conversion, entity resolution, and the like. Addressing the sociotechnical aspects of this (whether one should integrate in the first place, whether the integration result adds value, whether it violates privacy or security concerns, whether users will understand the result, what the learning curves are, etc.) is simply too diverse and so totally domain dependent that a general purpose metric cannot be developed, at least not in the time and budget constraints of the project. Further, adding a large human element in the experimental setting (e.g., how skilled the developers are, how well the stakeholders can explain their needs, how often these needs change, etc.) will lead to experiments that are so expensive to carry out and whose results will have so many unquantifiable factors that these will constitute an insuperable barrier to adoption.

The need for parallel systems to judge the benefits of a new technology is a straw man. And one that is easy to dispel.

For example, if your company provides technical support, you are tracking metrics on how quickly your staff can answer questions. And probably customer satisfaction with your technical support.

Both are common metrics in use today.

Assume the suggestion that linked data to improve technical support for your products. You begin with a pilot project to measure the benefit from the suggested change.

If the length of support calls goes down or customer customer satisfaction goes up, or both, change to linked data. If not, don’t.

Naming a technology as “semantic” doesn’t change how you measure the benefits of a change in process.

LDBC will find purely machine based performance measures easier to produce than answering more difficult socio-technical issues.

But of what value are great benchmarks for a technology that no one wants to use?

See my comments under: Web Data Commons (2012) – [RDFa at 1.28% of 40.5 million websites]. Benchmarks for 1.28% of the web?
November 10, 2012

LDBC: Linked Data Benchmark Council [I count 15 existing Graph/RDF benchmarks. You?]

Filed under: Benchmarks,Graphs,Linked Data — Patrick Durusau @ 11:01 am

LDBC: Linked Data Benchmark Council

From the webpage:

In the last years we have seen an explosion of massive amounts of graph shaped data coming from a variery of applications that are related to social networks like facebook, twitter, blogs and other on-line media and telecommunication networks. Furthermore, the W3C linking open data initiative has boosted the publication and interlinkage of a large number of datasets on the semantic web resulting to the Linked Data Cloud. These datasets with billions of RDF triples such as Wikipedia, U.S. Census bureau, CIA World Factbook, DBPedia, and government sites have been created and published online. Moreover, numerous datasets and vocabularies from e-science are published nowadays as RDF graphs most notably in life and earth sciences, astronomy in order to facilitate community annota- tion and interlinkage of both scientific and scholarly data of interest.

Technology and bandwidth now provide the opportunities for compiling, publishing and sharing massive Linked Data datasets. A significant number of commercial semantic repositories (RDF databases with reasoner and query-engine) which are the cornerstone of the Semantic Web exist.

Neverthless at the present time,

  • there is no comprehensive suite of benchmarks that encourage the advancement of technology by providing both academia and industry with clear targets for performance and functionality and
  • no independent authority for developing benchmarks and verifying the results of those engines. The same holds for the emerging field of noSQL graph databases, which share with RDF a graph data model and pattern- and pathoriented query languages.

The Linked Data Benchmark Council (LDBC) project aims to provide a solution to this problem by making insightful the critical properties of graph and RDF data management technology, and stimulating progress through compettion. This is timely and urgent since non-relational data management is emerging as a critical need for the new data economy based on large, distributed, heterogeneous, and complexly structured data sets. This new data management paradigm also provides an opportunity for research results to impact young innovative companies working on RDF and graph data management to start playing a significant role in this new data economy.

This announcement puzzled me because I know I have seen (and written about) graph benchmarks.

A quick search with a popular search engine turned up three of the better known graph benchmarks (in the first ten “hits”):

  1. BHOSLIB: Benchmarks with Hidden Optimum Solutions for Graph Problems (Maximum Clique, Maximum Independent Set, Minimum Vertex Cover and Vertex Coloring) —— Hiding Exact Solutions in Random Graphs by Ke XU, Beijing University of Aeronautics and Astronautics.
  2. HPC Graph Analysis From the homepage:

    We maintain a parallel graph theory benchmark that solves multiple graph analysis kernels on small-world networks. An early version of the benchmark was part of the DARPA High Productivity Computing Systems (HPCS) Compact Application (SSCA) suite. The benchmark performance across current HPC systems can be compared using a single score called TrEPS (Traversed Edges Per Second).

  3. Graph 500. From their specifications page:

    There are five problem classes defined by their input size:

    toy 17GB or around 1010 bytes, which we also call level 10,

    mini 140GB (1011 bytes, level 11),

    small 1TB (1012 bytes, level 12),

    medium 17TB (1013 bytes, level 13),

    large 140TB (1014 bytes, level 14), and

    huge 1.1PB (1015 bytes, level 15).

On RDF graphs in particular, the W3C wiki page: RDF Store Benchmarking, has a host of resources, including twelve (12) benchmarks for RDF Stores:

For a total of fifteen (15) graph/RDF benchmarks, discoverable in just a few minutes.

Given the current financial difficulties at the EU, duplicating research already performed/underway by others is a poor investment.


PS: Pass my name along to anyone you know in the EU research approval committees. I would be happy to do new/not-new evaluations of proposals on a contract basis.

PPS: As always, if you know of other graph/RDF benchmarks, I would be happy to add them. I deliberately did not attempt an exhaustive survey of graph or RDF benchmarks. If you or your company are interested in such a survey, ping me.

January 30, 2012

Ålenkå

Filed under: Benchmarks,Database,GPU — Patrick Durusau @ 8:02 pm

Ålenkå

If you don’t mind alpha code, ålenkå was pointed out in the bitmap posting I cited earlier today.

From its homepage:

Alenka is a modern analytical database engine written to take advantage of vector based processing and high bandwidth of modern GPUs.

Features include:

Vector-based processing
CUDA programming model allows a single operation to be applied to an entire set of data at once.

Self optimizing compression
Ultra fast compression and decompression performed directly inside GPU

Column-based storage
Minimize disk I/O by only accessing the relevant data

Fast database loads
Data load times measured in minutes, not in hours.

Open source and free

Apologies for the name spelling differences, Ålenkå versus Alenka. I suspect it has something to do with character support in whatever produced the readme file, but can’t say for sure.

The benchmarks (there is that term again) are impressive.

Would semantic benchmarks be different from the ones used in IR currently? Different from precision and recall? What about range (same subject but identified differently) or accuracy (different identifications but same subject, how many false positives)?

August 31, 2011

The VLTS Benchmark Suite

Filed under: Benchmarks,Graphs — Patrick Durusau @ 7:43 pm

The VLTS Benchmark Suite

From the webpage:

The VLTS acronym stands for “Very Large Transition Systems“.

The VLTS benchmark suite is a collection of Labelled Transition Systems (hereafter called benchmarks).

Each Labelled Transition System is a directed, connected graph, whose vertices are called states and whose edges are called transitions. There is one distinguished vertex called the initial state. Each transition is labelled by a character string called action or label. There is one distinguished label noted “i” that is used for so-called invisible transitions (also known as hidden transitions or tau-transitions).

The VLTS benchmarks have been obtained from various case studies about the modelling of communication protocols and concurrent systems. Many of these case studies correspond to real life, industrial systems.

If you aren’t already working with large graphs in your work on topic maps, you will be.

Powered by WordPress