Another Word For It Patrick Durusau on Topic Maps and Semantic Diversity

November 11, 2017

Practical advice for analysis of large, complex data sets [IC tl;dr]

Filed under: Data Analysis,Data Science — Patrick Durusau @ 9:37 pm

Practical advice for analysis of large, complex data sets by Patrick Riley.

From the post:

For a number of years, I led the data science team for Google Search logs. We were often asked to make sense of confusing results, measure new phenomena from logged behavior, validate analyses done by others, and interpret metrics of user behavior. Some people seemed to be naturally good at doing this kind of high quality data analysis. These engineers and analysts were often described as “careful” and “methodical”. But what do those adjectives actually mean? What actions earn you these labels?

To answer those questions, I put together a document shared Google-wide which I optimistically and simply titled “Good Data Analysis.” To my surprise, this document has been read more than anything else I’ve done at Google over the last eleven years. Even four years after the last major update, I find that there are multiple Googlers with the document open any time I check.

Why has this document resonated with so many people over time? I think the main reason is that it’s full of specific actions to take, not just abstract ideals. I’ve seen many engineers and analysts pick up these habits and do high quality work with them. I’d like to share the contents of that document in this blog post.

Great post and should be read and re-read until it becomes second nature.

I wave off the intelligence community (IC) with tl;dr because intelligence conclusions are policy and not fact, artifacts.

The best data science practices in the world have no practical application in intelligence circles, unless they support the desired conclusions.

Rather than sully data science, intelligence communities should publish their conclusions and claim the evidence cannot be shared.

Before you leap to defend the intelligence community, recall their lying about mass surveillance of Americans, lying about weapons of mass destruction in Iraq, numerous lies about US activities in Vietnam (before 50K+ Americans and millions of Vietnamese were killed).

The question to ask about American intelligence community reports isn’t whether they are lies (they are), but rather why they are lying?

For those interested in data driven analysis, follow Riley’s advice.

October 6, 2017

Computational Data Analysis Workflow Systems

Filed under: Astroinformatics,Cheminformatics,Chemistry,Data Analysis,Physics,Workflow — Patrick Durusau @ 4:42 pm

Computational Data Analysis Workflow Systems

An incomplete list of existing workflow systems. As of today, approximately 17:00 EST, 173 systems in no particular order.

I first saw this mentioned in a tweet by Michael R. Crusoe.

One of the many resources found at: Common Workflow Language.

From the webpage:

The Common Workflow Language (CWL) is a specification for describing analysis workflows and tools in a way that makes them portable and scalable across a variety of software and hardware environments, from workstations to cluster, cloud, and high performance computing (HPC) environments. CWL is designed to meet the needs of data-intensive science, such as Bioinformatics, Medical Imaging, Astronomy, Physics, and Chemistry.

You should take a quick look at: Common Workflow Language User Guide to get a feel for CWL.

Try to avoid thinking of CWL as “documenting” your workflow if that is an impediment to using it. That’s a side effect but its main purpose is to make your more effective.

September 27, 2017

InfoWord Bossie 2017 Awards Databases & Analytics

Filed under: Data Analysis,Database — Patrick Durusau @ 2:44 pm

InfoWorld’s Bossie awards for 2017 for databases and analytics.

In true InfoWorld fashion, the winners were in no particular order, one per slide and presented as images to prevent copy-n-paste.

Let’s re-arrange those “facts” for the time-pressed reader:

Hyperlinks are to the projects, the best information you will find for each one.

Enjoy!

August 21, 2016

The Ethics of Data Analytics

Filed under: Data Analysis,Data Science,Ethics,Graphics,Statistics,Visualization — Patrick Durusau @ 4:00 pm

The Ethics of Data Analytics by Kaiser Fung.

Twenty-one slides on ethics by Kaiser Fung, author of: Junk Charts (data visualization blog), and Big Data, Plainly Spoken (comments on media use of statistics).

Fung challenges you to reach your own ethical decisions and acknowledges there are a number of guides to such decision making.

Unfortunately, Fung does not include professional responsibility requirements, such as the now out-dated Canon 7 of the ABA Model Code Of Professional Responsibility:

A Lawyer Should Represent a Client Zealously Within the Bounds of the Law

That canon has a much storied history, which is capably summarized in Whatever Happened To ‘Zealous Advocacy’? by Paul C. Sanders.

In what became known as Queen Caroline’s Case, the House of Lords sought to dissolve the marriage of King George the IV

George IV 1821 color

to Queen Caroline

CarolineOfBrunswick1795

on the grounds of her adultery. Effectively removing her as queen of England.

Queen Caroline was represented by Lord Brougham, who had evidence of a secret prior marriage by King George the IV to Catholic (which was illegal), Mrs Fitzherbert.

Portrait of Mrs Maria Fitzherbert, wife of George IV

Brougham’s speech is worth your reading in full but the portion most often cited for zealous defense reads as follows:


I once before took leave to remind your lordships — which was unnecessary, but there are many whom it may be needful to remind — that an advocate, by the sacred duty of his connection with his client, knows, in the discharge of that office, but one person in the world, that client and none other. To save that client by all expedient means — to protect that client at all hazards and costs to all others, and among others to himself — is the highest and most unquestioned of his duties; and he must not regard the alarm, the suffering, the torment, the destruction, which he may bring upon any other; nay, separating even the duties of a patriot from those of an advocate, he must go on reckless of the consequences, if his fate it should unhappily be, to involve his country in confusion for his client.

The name Mrs. Fitzherbert never slips Lord Brougham’s lips but the House of Lords has been warned that may not remain to be the case, should it choose to proceed. The House of Lords did grant the divorce but didn’t enforce it. Saving fact one supposes. Queen Caroline died less than a month after the coronation of George IV.

For data analysis, cybersecurity, or any of the other topics I touch on in this blog, I take the last line of Lord Brougham’s speech:

To save that client by all expedient means — to protect that client at all hazards and costs to all others, and among others to himself — is the highest and most unquestioned of his duties; and he must not regard the alarm, the suffering, the torment, the destruction, which he may bring upon any other; nay, separating even the duties of a patriot from those of an advocate, he must go on reckless of the consequences, if his fate it should unhappily be, to involve his country in confusion for his client.

as the height of professionalism.

Post-engagement of course.

If ethics are your concern, have that discussion with your prospective client before you are hired.

Otherwise, clients have goals and the task of a professional is how to achieve them. Nothing more.

June 17, 2016

Volumetric Data Analysis – yt

Filed under: Astroinformatics,Data Analysis,Python,Science,Visualization — Patrick Durusau @ 7:23 pm

One of those rotating homepages:

Volumetric Data Analysis – yt

yt is a python package for analyzing and visualizing volumetric, multi-resolution data from astrophysical simulations, radio telescopes, and a burgeoning interdisciplinary community.

Quantitative Analysis and Visualization

yt is more than a visualization package: it is a tool to seamlessly handle simulation output files to make analysis simple. yt can easily knit together volumetric data to investigate phase-space distributions, averages, line integrals, streamline queries, region selection, halo finding, contour identification, surface extraction and more.

Many formats, one language

yt aims to provide a simple uniform way of handling volumetric data, regardless of where it is generated. yt currently supports FLASH, Enzo, Boxlib, Athena, arbitrary volumes, Gadget, Tipsy, ART, RAMSES and MOAB. If your data isn’t already supported, why not add it?

From the non-rotating part of the homepage:

To get started using yt to explore data, we provide resources including documentation, workshop material, and even a fully-executable quick start guide demonstrating many of yt’s capabilities.

But if you just want to dive in and start using yt, we have a long list of recipes demonstrating how to do various tasks in yt. We even have sample datasets from all of our supported codes on which you can test these recipes. While yt should just work with your data, here are some instructions on loading in datasets from our supported codes and formats.

Professional astronomical data and tools like yt put exploration of the universe at your fingertips!

Enjoy!

April 22, 2016

Where You Look – Determines What You See

Filed under: Data Analysis,Visualization — Patrick Durusau @ 7:34 pm

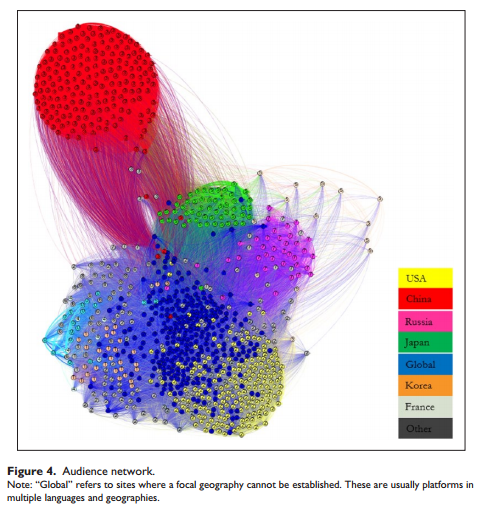
Mapping an audience-centric World Wide Web: A departure from hyperlink analysis by Harsh Taneja.

Abstract:

This article argues that maps of the Web’s structure based solely on technical infrastructure such as hyperlinks may bear little resemblance to maps based on Web usage, as cultural factors drive the latter to a larger extent. To test this thesis, the study constructs two network maps of 1000 globally most popular Web domains, one based on hyperlinks and the other using an “audience-centric” approach with ties based on shared audience traffic between these domains. Analyses of the two networks reveal that unlike the centralized structure of the hyperlink network with few dominant “core” Websites, the audience network is more decentralized and clustered to a larger extent along geo-linguistic lines.

Apologies but the article is behind a firewall.

A good example of what you look for determining your results. And an example of how firewalls prevent meaningful discussion of such research.

Unless you know of a site like sci-hub.io of course.

Enjoy!

PS: This is what an audience-centric web mapping looks like:

audience-network

Impressive work!

January 13, 2016

Using ‘R’ for betting analysis [Data Science For The Rest Of Us]

Filed under: Data Analysis,R — Patrick Durusau @ 4:45 pm

Using ‘R’ for betting analysis by Minrio Mella.

From the post:

Gaining an edge in betting often boils down to intelligent data analysis, but faced with daunting amounts of data it can be hard to know where to start. If this sounds familiar, R – an increasingly popular statistical programming language widely used for data analysis – could be just what you’re looking for.

What is R?

R is a statistical programming language that is used to visualize and analyse data. Okay, this sounds a little intimidating but actually it isn’t as scary as it may appear. Its creators – two professors from New Zealand – wanted an intuitive statistical platform that their students could use to slice and dice data and create interesting visual representation like 3D graphs.

Given its relative simplicity but endless scope for applications (packages) R has steadily gained momentum amongst the world’s brightest statisticians and data scientists. Facebook use R for statistical analysis of status updates and many of the complex word clouds you might see online are powered by R.

There are now thousands of user created libraries to enhance R functionality and given how much successful betting boils down to effective data analysis, packages are being created to perform betting related analysis and strategies.

On a day when the PowerBall lottery has a jackpot of $1.5 billion, a post on betting analysis is appropriate.

Especially since most data science articles are about sentiment analysis, recommendations, all of which is great if you are marketing videos in a streaming environment across multiple media channels.

At home? Not so much.

Mirio’s introduction to R walks you through getting R installed along with a library for Pinnacle Sports for odds conversion.

No guarantees on your betting performance but having a subject you are interested in, betting, makes it much more likely you will learn R.

Enjoy!

November 18, 2015

A Timeline of Terrorism Warning: Incomplete Data

Filed under: Data Analysis,Graphics,Skepticism,Visualization — Patrick Durusau @ 2:41 pm

A Timeline of Terrorism by Trevor Martin.

From the post:

The recent terrorist attacks in Paris have unfortunately once again brought terrorism to the front of many people’s minds. While thinking about these attacks and what they mean in a broad historical context I’ve been curious about if terrorism really is more prevalent today (as it feels), and if data on terrorism throughout history can offer us perspective on the terrorism of today.

In particular:

  • Have incidents of terrorism been increasing over time?
  • Does the amount of attacks vary with the time of year?
  • What type of attack and what type of target are most common?
  • Are the terrorist groups committing attacks the same over decades long time scales?

In order to perform this analysis I’m using a comprehensive data set on 141,070 terrorist attacks from 1970-2014 compiled by START.

Trevor writes a very good post and the visualizations are ones that you will find useful for this and other date.

However, there is a major incompleteness in Trevor’s data. If you follow the link for “comprehensive data set” and the FAQ you find there, you will find excluded from this data set:

Criterion III: The action must be outside the context of legitimate warfare activities.

So that excludes the equivalent of five Hiroshimas dropped on rural Cambodia (1969-1973), the first and second Iraq wars, the invasion of Afghanistan, numerous other acts of terrorism using cruise missiles and drones, all by the United States, to say nothing of the atrocities committed by Russia against a variety of opponents and other governments since 1970.

Depending on how you count separate acts, I would say the comprehensive data set is short by several orders of magnitude in accounting for all the acts of terrorism between 1970 to 2014.

If that additional data were added to the data set, I suspect (don’t know because the data set is incomplete) that who is responsible for more deaths and more terror would have a quite different result from that offered by Trevor.

So I don’t just idly complain, I will contact the United States Air Force to see if there are public records on how many bombing missions and how many bombs were dropped on Cambodia and in subsequent campaigns. That could be a very interesting data set all on its own.

September 24, 2015

Data Analysis for the Life Sciences… [No Ur-Data Analysis Book?]

Filed under: Data Analysis,Life Sciences,Science — Patrick Durusau @ 7:42 pm

Data Analysis for the Life Sciences – a book completely written in R markdown by Rafael Irizarry.

From the post:

Data analysis is now part of practically every research project in the life sciences. In this book we use data and computer code to teach the necessary statistical concepts and programming skills to become a data analyst. Following in the footsteps of Stat Labs, instead of showing theory first and then applying it to toy examples, we start with actual applications and describe the theory as it becomes necessary to solve specific challenges. We use simulations and data analysis examples to teach statistical concepts. The book includes links to computer code that readers can use to program along as they read the book.

It includes the following chapters: Inference, Exploratory Data Analysis, Robust Statistics, Matrix Algebra, Linear Models, Inference for High-Dimensional Data, Statistical Modeling, Distance and Dimension Reduction, Practical Machine Learning, and Batch Effects.

Have you ever wondered about the growing proliferation of data analysis books?

The absence of one Ur-Data Analysis book that everyone could read and use?

I have a longer post coming on a this idea but if each discipline has the need for its own view on data analysis, it is really surprising that no one system of semantics satisfies all communities?

In other words, is the evidence of heterogeneous semantics so strong that we should abandon attempts at uniform semantics and focus on communicating across systems of semantics?

I’m sure there are other examples of where every niche has its own vocabulary, tables in relational databases or column headers in spreadsheets for example.

What is your favorite example of heterogeneous semantics?

Assuming heterogeneous semantics are here to stay (they have been around since the start of human to human communication, possibly earlier), what solution do you suggest?

I first saw this in a tweet by Christophe Lalanne.

April 25, 2015

pandas: powerful Python data analysis toolkit Release 0.16

Filed under: Data Analysis,Programming,Python — Patrick Durusau @ 7:42 pm

pandas: powerful Python data analysis toolkit Release 0.16 by Wes McKinney and PyData Development Team.

I mentioned Wes’ 2011 paper on pandas in 2011 and a lot has changed since then.

From the homepage:

pandas: powerful Python data analysis toolkit

PDF Version

Zipped HTML

Date: March 24, 2015 Version: 0.16.0

Binary Installers: http://pypi.python.org/pypi/pandas

Source Repository: http://github.com/pydata/pandas

Issues & Ideas: https://github.com/pydata/pandas/issues

Q&A Support: http://stackoverflow.com/questions/tagged/pandas

Developer Mailing List: http://groups.google.com/group/pydata

pandas is a Python package providing fast, flexible, and expressive data structures designed to make working with“relational” or “labeled” data both easy and intuitive. It aims to be the fundamental high-level building block for doing practical, real world data analysis in Python. Additionally, it has the broader goal of becoming the most powerful and flexible open source data analysis / manipulation tool available in any language. It is already well on its way toward this goal.

pandas is well suited for many different kinds of data:

  • Tabular data with heterogeneously-typed columns, as in an SQL table or Excel spreadsheet
  • Ordered and unordered (not necessarily fixed-frequency) time series data.
  • Arbitrary matrix data (homogeneously typed or heterogeneous) with row and column labels
  • Any other form of observational / statistical data sets. The data actually need not be labeled at all to be placed into a pandas data structure

The two primary data structures of pandas, Series (1-dimensional) and DataFrame (2-dimensional), handle the vast majority of typical use cases in finance, statistics, social science, and many areas of engineering. For R users, DataFrame provides everything that R’s data.frame provides and much more. pandas is built on top of NumPy and is intended to integrate well within a scientific computing environment with many other 3rd party libraries.

Here are just a few of the things that pandas does well:

  • Easy handling of missing data (represented as NaN) in floating point as well as non-floating point data
  • Size mutability: columns can be inserted and deleted from DataFrame and higher dimensional objects
  • Automatic and explicit data alignment: objects can be explicitly aligned to a set of labels, or the user can simply ignore the labels and let Series, DataFrame, etc. automatically align the data for you in computations
  • Powerful, flexible group by functionality to perform split-apply-combine operations on data sets, for both aggregating and transforming data
  • Make it easy to convert ragged, differently-indexed data in other Python and NumPy data structures into DataFrame objects
  • Intelligent label-based slicing, fancy indexing, and subsetting of large data sets
  • Intuitive merging and joining data sets
  • Flexible reshaping and pivoting of data sets
  • Hierarchical labeling of axes (possible to have multiple labels per tick)
  • Robust IO tools for loading data from flat files (CSV and delimited), Excel files, databases, and saving / loading data from the ultrafast HDF5 format
  • Time series-specific functionality: date range generation and frequency conversion, moving window statistics, moving window linear regressions, date shifting and lagging, etc.

Many of these principles are here to address the shortcomings frequently experienced using other languages / scientific research environments. For data scientists, working with data is typically divided into multiple stages: munging and cleaning data, analyzing / modeling it, then organizing the results of the analysis into a form suitable for plotting or tabular display. pandas is the ideal tool for all of these tasks.

Some other notes

  • pandas is fast. Many of the low-level algorithmic bits have been extensively tweaked in Cython code. However, as with anything else generalization usually sacrifices performance. So if you focus on one feature for your application you may be able to create a faster specialized tool.
  • pandas is a dependency of statsmodels, making it an important part of the statistical computing ecosystem in Python.
  • pandas has been used extensively in production in financial applications.

Note

This documentation assumes general familiarity with NumPy. If you haven’t used NumPy much or at all, do invest some time in learning about NumPy first.

Not that I’m one to make editorial suggestions, ;-), but with almost 200 pages of What’s New entries going back to September of 2011 and topping out at over 1600 pages, I would move all but the latest What’s New to the end. Yes?

BTW, at 1600 pages, you may already be behind in your reading. Are you sure you want to get further behind?

Not only will the reading be entertaining, it will have the side benefit of improving your data analysis skills as well.

Enjoy!

I first saw this mentioned in a tweet by Kirk Borne.

April 8, 2015

Four Mistakes To Avoid If You’re Analyzing Data

Filed under: Data Analysis,Plotly — Patrick Durusau @ 9:54 am

Four Mistakes To Avoid If You’re Analyzing Data

The post highlights four (4) common mistakes in analyzing data, with visualizations.

Four (4) seems like a low number, at least in my personal experience. 😉

Still, I am encouraged that the post concludes with:

Analyzing data is not easy. We hope this post helps. Has your team made or avoided any of these mistakes? Do you have suggestions for a future post? Let us know; we’re @plotlygraphs, or email us at feedback at plot dot ly.

I just thought of a common data analysis mistake, reliance on source or authority.

As we saw in Photoshopping Science? Where Was Peer Review?, apparently peer reviewers were too impressed by the author’s status to take a close look at photos submitted with his articles. On later and closer examination, those same photos, as published, revealed problems that should have been caught by the peer reviewers.

Do you spot check all your data sources?

February 23, 2015

Announcing Pulsar: Real-time Analytics at Scale

Filed under: Analytics,Data Analysis,eBay,Pulsar — Patrick Durusau @ 8:54 pm

Announcing Pulsar: Real-time Analytics at Scale by Sharad Murthy and Tony Ng.

From the post:

We are happy to announce Pulsar – an open-source, real-time analytics platform and stream processing framework. Pulsar can be used to collect and process user and business events in real time, providing key insights and enabling systems to react to user activities within seconds. In addition to real-time sessionization and multi-dimensional metrics aggregation over time windows, Pulsar uses a SQL-like event processing language to offer custom stream creation through data enrichment, mutation, and filtering. Pulsar scales to a million events per second with high availability. It can be easily integrated with metrics stores like Cassandra and Druid.

pulsar_logo-e1423166909374

Why Pulsar

eBay provides a platform that enables millions of buyers and sellers to conduct commerce transactions. To help optimize eBay end users’ experience, we perform analysis of user interactions and behaviors. Over the past years, batch-oriented data platforms like Hadoop have been used successfully for user behavior analytics. More recently, we have newer use cases that demand collection and processing of vast numbers of events in near real time (within seconds), in order to derive actionable insights and generate signals for immediate action. Here are examples of such use cases:

  • Real-time reporting and dashboards
  • Business activity monitoring
  • Personalization
  • Marketing and advertising
  • Fraud and bot detection

We identified a set of systemic qualities that are important to support these large-scale, real-time analytics use cases:

  • Scalability – Scaling to millions of events per second
  • Latency – Sub-second event processing and delivery
  • Availability – No cluster downtime during software upgrade, stream processing rule updates , and topology changes
  • Flexibility – Ease in defining and changing processing logic, event routing, and pipeline topology
  • Productivity – Support for complex event processing (CEP) and a 4GL language for data filtering, mutation, aggregation, and stateful processing
  • Data accuracy – 99.9% data delivery
  • Cloud deployability – Node distribution across data centers using standard cloud infrastructure

Given our unique set of requirements, we decided to develop our own distributed CEP framework. Pulsar CEP provides a Java-based framework as well as tooling to build, deploy, and manage CEP applications in a cloud environment. Pulsar CEP includes the following capabilities:

  • Declarative definition of processing logic in SQL
  • Hot deployment of SQL without restarting applications
  • Annotation plugin framework to extend SQL functionality
  • Pipeline flow routing using SQL
  • Dynamic creation of stream affinity using SQL
  • Declarative pipeline stitching using Spring IOC, thereby enabling dynamic topology changes at runtime
  • Clustering with elastic scaling
  • Cloud deployment
  • Publish-subscribe messaging with both push and pull models
  • Additional CEP capabilities through Esper integration

On top of this CEP framework, we implemented a real-time analytics data pipeline.

That should be enough to capture your interest!

I saw it coming off of a two and one-half hour conference call. Nice way to decompress.

Other places to look:

If you don’t know Docker already, you will. Courtesy of the Pulsar Get Started page.

Nice to have yet another high performance data tool.

January 22, 2015

Lecture Slides for Coursera’s Data Analysis Class

Filed under: Data Analysis,R — Patrick Durusau @ 2:26 pm

Lecture Slides for Coursera’s Data Analysis Class by Jeff Leek.

From the webpage:

This repository contains the lecture slides for the Coursera course Data Analysis. The slides were created with the Slidify package in Rstudio.

From the course description:

You have probably heard that this is the era of “Big Data”. Stories about companies or scientists using data to recommend movies, discover who is pregnant based on credit card receipts, or confirm the existence of the Higgs Boson regularly appear in Forbes, the Economist, the Wall Street Journal, and The New York Times. But how does one turn data into this type of insight? The answer is data analysis and applied statistics. Data analysis is the process of finding the right data to answer your question, understanding the processes underlying the data, discovering the important patterns in the data, and then communicating your results to have the biggest possible impact. There is a critical shortage of people with these skills in the workforce, which is why Hal Varian (Chief Economist at Google) says that being a statistician will be the sexy job for the next 10 years.

This course is an applied statistics course focusing on data analysis. The course will begin with an overview of how to organize, perform, and write-up data analyses. Then we will cover some of the most popular and widely used statistical methods like linear regression, principal components analysis, cross-validation, and p-values. Instead of focusing on mathematical details, the lectures will be designed to help you apply these techniques to real data using the R statistical programming language, interpret the results, and diagnose potential problems in your analysis. You will also have the opportunity to critique and assist your fellow classmates with their data analyses.

Once you master the basics of data analysis with R (or some other language), the best way to hone your data analysis skills is to look for data sets that are new to you. Don’t go so far afield that you can’t judge a useful result from a non-useful one but going to the edges of your comfort zone is good practice as well.

Enjoy!

I first saw this in a tweet by Christophe Lalanne.

January 12, 2015

Data wrangling, exploration, and analysis with R

Filed under: Data Analysis,Data Mining,R — Patrick Durusau @ 7:17 pm

Data wrangling, exploration, and analysis with R Jennifer (Jenny) Bryan.

Graduate level class that uses R for “data wrangling, exploration and analysis.” If you are self-motivated, you will be hard pressed to find better notes, additional links and resources for an R course anywhere. More difficult on your own but work through this course and you will have some serious R chops to build upon.

It just occurred to me that a requirement for news channels should have sub-titles that list data repositories for each story reported. So you could load of the data while the report in ongoing.

I first saw this in a tweet by Neil Saunders.

January 2, 2015

Conference on Innovative Data Systems Research (CIDR) 2015 Program + Papers!

Filed under: Computer Science,Conferences,Data Analysis,Data Management,Data Science — Patrick Durusau @ 3:23 pm

Conference on Innovative Data Systems Research (CIDR) 2015

From the homepage:

The biennial Conference on Innovative Data Systems Research (CIDR) is a systems-oriented conference, complementary in its mission to the mainstream database conferences like SIGMOD and VLDB, emphasizing the systems architecture perspective. CIDR gathers researchers and practitioners from both academia and industry to discuss the latest innovative and visionary ideas in the field.

Papers are invited on novel approaches to data systems architecture and usage. Conference Venue CIDR mainly encourages papers about innovative and risky data management system architecture ideas, systems-building experience and insight, resourceful experimental studies, provocative position statements. CIDR especially values innovation, experience-based insight, and vision.

As usual, the conference will be held at the Asilomar Conference Grounds on the Pacific Ocean just south of Monterey, CA. The program will include: keynotes, paper presentations, panels, a gong-show and plenty of time for interaction.

The conference runs January 4 – 7, 2015 (starts next Monday). If you aren’t lucky enough to attend, the program has links to fifty-four (54) papers for your reading pleasure.

The program was exported from a “no-sense-of-abstraction” OOXML application. Conversion to re-usable form will take a few minutes. I will produce an author-sorted version this weekend.

In the meantime, enjoy the papers!

December 26, 2014

How to Get Noticed and Hired as a Data Analyst

Filed under: Data Analysis,Jobs — Patrick Durusau @ 3:53 pm

How to Get Noticed and Hired as a Data Analyst by Cheng Han Lee.

From the post:

So, you’ve learned the skills needed to become a data analyst. You can write queries to retrieve data from a database, scour through user behavior to discover rich insights, and interpret the complex results of A/B tests to make substantive product recommendations.

In short, you feel confident about embarking full steam ahead on a career as a data analyst. The next question is, how do you get noticed and actually hired by recruiters or hiring managers?

Whether you are breaking into data analytics or looking for another position, Cheng Han Lee’s advice will stand you in good stead in the coming new year!

Enjoy!

December 19, 2014

A non-comprehensive list of awesome things other people did in 2014

Filed under: Data Analysis,Genomics,R,Statistics — Patrick Durusau @ 1:38 pm

A non-comprehensive list of awesome things other people did in 2014 by Jeff Leek.

Thirty-eight (38) top resources from 2014! Ranging from data analysis and statistics to R and genomics and places in between.

If you missed or overlooked any of these resources during 2014, take the time to correct that error!

Thanks Jeff!

I first saw this in a tweet by Nicholas Horton.

December 15, 2014

Infinit.e Overview

Filed under: Data Analysis,Data Mining,Structured Data,Unstructured Data,Visualization — Patrick Durusau @ 11:04 am

Infinit.e Overview by Alex Piggott.

From the webpage:

Infinit.e is a scalable framework for collecting, storing, processing, retrieving, analyzing, and visualizing unstructured documents and structured records.

[Image omitted. Too small in my theme to be useful.]

Let’s provide some clarification on each of the often overloaded terms used in that previous sentence:

  • It is a "framework" (or "platform") because it is configurable and extensible by configuration (DSLs) or by various plug-ins types – the default configuration is expected to be useful for a range of typical analysis applications but to get the most out of Infinit.e we anticipate it will usually be customized.
    • Another element of being a framework is being designed to integrate with existing infrastructures as well run standalone.
  • By "scalable" we mean that new nodes (or even more granular: new components) can be added to meet increasing workload (either more users or more data), and that provision of new resources are near real-time.
    • Further, the use of fundamentally cloud-based components means that there are no bottlenecks at least to the ~100 node scale.
  • By "unstructured documents" we mean anything from a mostly-textual database record to a multi-page report – but Infinit.e’s "sweet spot" is in the range of database records that would correspond to a paragraph or more of text ("semi-structured records"), through web pages, to reports of 10 pages or less.
    • Smaller "structured records" are better handled by structured analysis tools (a very saturated space), though Infinit.e has the ability to do limited aggregation, processing and integration of such datasets. Larger reports can still be handled by Infinit.e, but will be most effective if broken up first.
  • By "processing" we mean the ability to apply complex logic to the data. Infinit.e provides some standard "enrichment", such as extraction of entities (people/places/organizations.etc) and simple statistics; and also the ability to "plug in" domain specific processing modules using the Hadoop API.
  • By "retrieving" we mean the ability to search documents and return them in ranking order, but also to be able to retrieve "knowledge" aggregated over all documents matching the analyst’s query.
    • By "query"/"search" we mean the ability to form complex "questions about the data" using a DSL (Domain Specific Language).
  • By "analyzing" we mean the ability to apply domain-specific logic (visual/mathematical/heuristic/etc) to "knowledge" returned from a query.

We refer to the processing/retrieval/analysis/visualization chain as document-centric knowledge discovery:

  • "document-centric": means the basic unit of storage is a generically-formatted document (eg useful without knowledge of the specific data format in which it was encoded)
  • "knowledge discovery": means using statistical and text parsing algorithms to extract useful information from a set of documents that a human can interpret in order to understand the most important knowledge contained within that dataset.

One important aspect of the Infinit.e is our generic data model. Data from all sources (from large unstructured documents to small structured records) is transformed into a single, simple. data model that allows common queries, scoring algorithms, and analytics to be applied across the entire dataset. …

I saw this in a tweet by Gregory Piatetsky yesterday and so haven’t had time to download or test any of the features of Infinit.e.

The list of features is a very intriguing one.

Definitely worth the time to throw another VM on the box and try it out with a dataset of interest.

Would appreciate your doing the same and sending comments and/or pointers to posts with your experiences. Suspect we will have different favorite features and hit different limitations.

Thanks!

PS: Downloads.

December 7, 2014

Data Skepticism: Citations

Filed under: Data Analysis,Skepticism — Patrick Durusau @ 6:44 pm

There are two recent posts on citation practices that merit comparison.

The first is Citations for sale by Megan Messerly, which reads in part:

The U.S. News and World Report rankings have long been regarded as the Bible of university reputation metrics.

But when the outlet released its first global rankings in October, many were surprised. UC Berkeley, which typically hovers in the twenties in the national pecking order, shot to third in the international arena. The university also placed highly in several subjects, including first place in math.

Even more surprising, though, was that a little-known university in Saudi Arabia, King Abdulaziz University, or KAU, ranked seventh in the world in mathematics — despite the fact that it didn’t have a doctorate program in math until two years ago.

“I thought this was really bizarre,” said UC Berkeley math professor Lior Pachter. “I had never heard of this university and never heard of it in the context of mathematics.”

As he usually does when rankings are released, Pachter received a round of self-congratulatory emails from fellow faculty members. He, too, was pleased that his math department had ranked first. But he was also surprised that his school had edged out other universities with reputable math departments, such as MIT, which did not even make the top 10.

For the sake of ranking

It was enough to inspire Pachter to conduct his own review of the newly minted rankings. His inquiry revealed that KAU had aggressively recruited professors from a list of top scientists with the most frequently referenced papers, often referred to as highly cited researchers.

“The more I’ve learned, the more shocked and disgusted I’ve been,” Pachter said.

Citations are an indicator of academic clout, but they are also a crucial metric used in compiling several university rankings. There may be many reasons for hiring highly cited researchers, but rankings are one clear result of KAU’s investment. The worry, some researchers have said, is that citations and, ultimately, rankings may be KAU’s primary aim. KAU did not respond to repeated requests for comment via phone and email for this article.

On Halloween, Pachter published his findings about KAU’s so-called “highly-cited researcher program” in a post on his blog. It elicited many responses from his colleagues in the comment section, some of whom had experience working with KAU.

Pachter refers to earlier work of his own that makes claims about ranking universities highly suspect so one wonders why the bother?

I first saw this in a tweet by Lior Pachter.

In any event, you should also consider: Best Papers vs. Top Cited Papers in Computer Science (since 1996)

From the post:

The score in the bracket after each conference represents its average MAP score. MAP (Mean Average Precision) is a measure to evaluate the ranking performance. The MAP score of a conference in a year is calculated by viewing best papers of the conference in the corresponding year as the ground truth and the top cited papers as the ranking results.

Check the number out (the hyperlinks take you to the section in question):

AAAI (0.16) | ACL (0.13) | ACM MM (0.17) | ACSAC (0.27) | ALT (0.07) | APSEC (0.33) | ASIACRYPT (0.16) | CHI (0.2) | CIKM (0.19) | COMPSAC (0.6) | CONCUR (0.09) | CVPR (0.25) | CoNEXT (0.16) | DAC (0.07) | DASFAA (0.27) | DATE (0.11) | ECAI (0.0) | ECCV (0.42) | ECOOP (0.22) | EMNLP (0.14) | ESA (0.4) | EUROCRYPT (0.07) | FAST (0.18) | FOCS (0.07) | FPGA (0.59) | FSE (0.4) | HPCA (0.31) | HPDC (0.59) | ICALP (0.2) | ICCAD (0.13) | ICCV (0.07) | ICDE (0.48) | ICDM (0.13) | ICDT (0.25) | ICIP (0.0) | ICME (0.43) | ICML (0.12) | ICRA (0.16) | ICSE (0.24) | IJCAI (0.11) | INFOCOM (0.18) | IPSN (0.69) | ISMAR (0.57) | ISSTA (0.33) | KDD (0.33) | LICS (0.26) | LISA (0.07) | MOBICOM (0.09) | MobiHoc (0.02) | MobiSys (0.06) | NIPS (0.0) | NSDI (0.13) | OSDI (0.24) | PACT (0.37) | PLDI (0.3) | PODS (0.13) | RTAS (0.03) | RTSS (0.29) | S&P (0.09) | SC (0.14) | SCAM (0.5) | SDM (0.18) | SEKE (0.09) | SIGCOMM (0.1) | SIGIR (0.14) | SIGMETRICS (0.14) | SIGMOD (0.08) | SODA (0.12) | SOSP (0.41) | SOUPS (0.24) | SPAA (0.14) | STOC (0.21) | SenSys (0.4) | UIST (0.32) | USENIX ATC (0.1) | USENIX Security (0.18) | VLDB (0.18) | WSDM (0.2) | WWW (0.09) |

Universities and their professors conferred validity on the capricious ratings of U.S. News and World Report. Pachter’s own research has shown the ratings to be nearly fictional for comparison purposes. Yet at the same time, Pachter decrys what he sees as gaming of the rating system.

Crying “foul” in a game of capricious ratings, a game favors one’s own university, seems quite odd. Social practices at KAU may differ from universities in the United States but being ethnocentric about university education isn’t a good sign for university education in general.

December 6, 2014

Resisting Arrests: 15% of Cops Make 1/2 of Cases

Filed under: Data Analysis,Graphics,Visualization — Patrick Durusau @ 7:19 pm

Resisting Arrests: 15% of Cops Make 1/2 of Cases by WNYC

From the webpage:

Police departments around the country consider frequent charges of resisting arrest a potential red flag, as some officers might add the charge to justify use of force. WNYC analyzed NYPD records and found 51,503 cases with resisting arrest charges since 2009. Just five percent of arresting officers during that period account for 40% of resisting arrest cases — and 15% account for more than half of such cases.

Be sure to hit the “play” button on the graphic.

Statistics can be simple, direct and very effective.

First question: What has the police department done to lower those numbers for the 5% of the officers in question?

Second question: Who are the officers in the 5%?

Without transparency there is no accountability.

November 10, 2014

Is prostitution really worth £5.7 billion a year? [Data Skepticism]

Filed under: Data Analysis,Skepticism — Patrick Durusau @ 3:40 pm

Is prostitution really worth £5.7 billion a year? by David Spiegelhalter.

From the post:

The EU has demanded rapid payment of £1.7 billion from the UK because our economy has done better than predicted, and some of this is due to the prostitution market now being considered as part of our National Accounts and contributing an extra £5.3 billion to GDP at 2009 prices, which is 0.35% of GDP, half that of agriculture. But is this a reasonable estimate?

This £5.3 billion figure was assessed by the Office of National Statistics in May 2014 based on the following assumptions, derived from this analysis. To quote the ONS:

  • Number of prostitutes in UK: 61,000
  • Average cost per visit: £67
  • Clients per prostitute per week: 25
  • Number of weeks worked per year: 52

Multiply these up and you get £5.3 billion at 2009 prices, around £5.7 billion now.

An excellent example of data skepticism. Taking commonly available data, David demonstrates the “£5.7 billion a year” claim depends on 400,000 Englishmen visiting prostitutes every three (3) days. Existing data on use of prostitutes suggests that figure is far too high.

There are other problems with the data. See David’s post for the details.

BTW, there was some quibbling about the price for prostitutes, as in being too low. Perhaps the authors of the original estimate were accustomed to government subsidized prostitutes. 😉

Should prostitution pricing come up in your data analysis, one source (not necessarily a reliable one) is Havocscope Prostitution Prices. The price for a UK street prostitute is listed in U.S. dollars at $20.00. Even lower than the original estimate. Would dramatically increase the number of required visits, by about a factor of five (5).

November 6, 2014

Extracting insights from the shape of complex data using topology

Filed under: Data Analysis,Mathematics,Topological Data Analysis,Topology — Patrick Durusau @ 7:29 pm

Extracting insights from the shape of complex data using topology by P. Y. Lum, et al. (Scientific Reports 3, Article number: 1236 doi:10.1038/srep01236)

Abstract:

This paper applies topological methods to study complex high dimensional data sets by extracting shapes (patterns) and obtaining insights about them. Our method combines the best features of existing standard methodologies such as principal component and cluster analyses to provide a geometric representation of complex data sets. Through this hybrid method, we often find subgroups in data sets that traditional methodologies fail to find. Our method also permits the analysis of individual data sets as well as the analysis of relationships between related data sets. We illustrate the use of our method by applying it to three very different kinds of data, namely gene expression from breast tumors, voting data from the United States House of Representatives and player performance data from the NBA, in each case finding stratifications of the data which are more refined than those produced by standard methods.

In order to identify subjects you must first discover them.

Does the available financial contribution data on members of the United States House of Representatives correspond with the clustering analysis here? (Asking because I don’t know but would be interested in finding out.)

I first saw this in a tweet by Stian Danenbarger.

October 9, 2014

Intriguing properties of neural networks [Gaming Neural Networks]

Filed under: Data Analysis,Neural Networks — Patrick Durusau @ 4:48 pm

Intriguing properties of neural networks by Christian Szegedy, et al.

Abstract:

Deep neural networks are highly expressive models that have recently achieved state of the art performance on speech and visual recognition tasks. While their expressiveness is the reason they succeed, it also causes them to learn uninterpretable solutions that could have counter-intuitive properties. In this paper we report two such properties.

First, we find that there is no distinction between individual high level units and random linear combinations of high level units, according to various methods of unit analysis. It suggests that it is the space, rather than the individual units, that contains of the semantic information in the high layers of neural networks.

Second, we find that deep neural networks learn input-output mappings that are fairly discontinuous to a significant extend. Specifically, we find that we can cause the network to misclassify an image by applying a certain imperceptible perturbation, which is found by maximizing the network’s prediction error. In addition, the specific nature of these perturbations is not a random artifact of learning: the same perturbation can cause a different network, that was trained on a different subset of the dataset, to misclassify the same input.

Both findings are of interest but the discovery of “adversarial examples” that can cause a trained network to misclassify images, is the more intriguing of the two.

How do you validate a result from a neural network? Possessing the same network and data isn’t going to help if it contains “adversarial examples.” I suppose you could “spot” a misclassification but one assumes a neural network is being used because physical inspection by a person isn’t feasible.

What “adversarial examples” work best against particular neural networks? How to best generate such examples?

How do users of off-the-shelf neural networks guard against “adversarial examples?” (One of those cases where “shrink-wrap” data services may not be a good choice.)

I first saw this in a tweet by Xavier Amatriain

September 11, 2014

MRAPs And Bayonets: What We Know About The Pentagon’s 1033 Program

Filed under: Data,Data Analysis — Patrick Durusau @ 5:47 pm

MRAPs And Bayonets: What We Know About The Pentagon’s 1033 Program by by Arezou Rezvani, Jessica Pupovac, David Eads, and Tyler Fisher. (NPR)

From the post:

Amid widespread criticism of the deployment of military-grade weapons and vehicles by police officers in Ferguson, Mo., President Obama recently ordered a review of federal efforts supplying equipment to local law enforcement agencies across the country.

So, we decided to take a look at what the president might find.

NPR obtained data from the Pentagon on every military item sent to local, state and federal agencies through the Pentagon’s Law Enforcement Support Office — known as the 1033 program — from 2006 through April 23, 2014. The Department of Defense does not publicly report which agencies receive each piece of equipment, but they have identified the counties that the items were shipped to, a description of each, and the amount the Pentagon initially paid for them.

We took the raw data, analyzed it and have organized it to make it more accessible. We are making that data set available to the public today.

This is a data set that raises more questions than it answers, as the post points out.

The top ten categories of items distributed (valued in the $millions): vehicles, aircraft, comm. & detection, clothing, construction, fire control, weapons, electric wire, medical equipment, and tractors.

Tractors? I can understand the military having tractors since it is entirely self-reliance during military operations. Why any local law enforcement office needs a tractor is less clear. Or bayonets (11,959 of them).

The NPR post does a good job of raising questions but since there are 3,143 counties or their equivalents in the United States, connecting the dots with particular local agencies, uses, etc. falls on your shoulders.

Could be quite interesting. Is your local sheriff “training” on an amphibious vehicle to reach his deer blind during hunting season? (Utter speculation on my part. I don’t know if your local sheriff likes to hunt deer.)

September 3, 2014

FCC Net Neutrality Plan – 800,000 Comments

Filed under: Data Analysis,Data Mining,Government — Patrick Durusau @ 1:40 pm

What can we learn from 800,000 public comments on the FCC’s net neutrality plan? by Bob Lannon and Andrew Pendleton.

From the post:

On Aug. 5, the Federal Communications Commission announced the bulk release of the comments from its largest-ever public comment collection. We’ve spent the last three weeks cleaning and preparing the data and leveraging our experience in machine learning and natural language processing to try and make sense of the hundreds-of-thousands of comments in the docket. Here is a high-level overview, as well as our cleaned version of the full corpus which is available for download in the hopes of making further research easier.

A great story of cleaning dirty data. Beyond eliminating both Les Misérables and War and Peace as comments, the authors detected statements by experts, form letters, etc.

If you’re interested in doing your own analysis with this data, you can download our cleaned-up versions below. We’ve taken the six XML files released by the FCC and split them out into individual files in JSON format, one per comment, then compressed them into archives, one for each of XML file. Additionally, we’ve taken several individual records from the FCC data that represented multiple submissions grouped together, and split them out into individual files (these JSON files will have hyphens in their filenames, where the value before the hyphen represents the original record ID). This includes email messages to openinternet@fcc.gov, which had been aggregated into bulk submissions, as well as mass submissions from CREDO Mobile, Sen. Bernie Sanders’ office and others. We would be happy to answer any questions you may have about how these files were generated, or how to use them.

All the code use in the project is available at: https://github.com/sunlightlabs/fcc-net-neutrality-comments

I first saw this in a tweet by Scott Chamberlain.

August 26, 2014

Test Your Analysis With Random Numbers

Filed under: Bioinformatics,Data Analysis,Statistics — Patrick Durusau @ 12:55 pm

A critical reanalysis of the relationship between genomics and well-being by Nicholas J. L. Brown, et al. (Nicholas J. L. Brown, doi: 10.1073/pnas.1407057111)

Abstract:

Fredrickson et al. [Fredrickson BL, et al. (2013) Proc Natl Acad Sci USA 110(33):13684–13689] claimed to have observed significant differences in gene expression related to hedonic and eudaimonic dimensions of well-being. Having closely examined both their claims and their data, we draw substantially different conclusions. After identifying some important conceptual and methodological flaws in their argument, we report the results of a series of reanalyses of their dataset. We first applied a variety of exploratory and confirmatory factor analysis techniques to their self-reported well-being data. A number of plausible factor solutions emerged, but none of these corresponded to Fredrickson et al.’s claimed hedonic and eudaimonic dimensions. We next examined the regression analyses that purportedly yielded distinct differential profiles of gene expression associated with the two well-being dimensions. Using the best-fitting two-factor solution that we identified, we obtained effects almost twice as large as those found by Fredrickson et al. using their questionable hedonic and eudaimonic factors. Next, we conducted regression analyses for all possible two-factor solutions of the psychometric data; we found that 69.2% of these gave statistically significant results for both factors, whereas only 0.25% would be expected to do so if the regression process was really able to identify independent differential gene expression effects. Finally, we replaced Fredrickson et al.’s psychometric data with random numbers and continued to find very large numbers of apparently statistically significant effects. We conclude that Fredrickson et al.’s widely publicized claims about the effects of different dimensions of well-being on health-related gene expression are merely artifacts of dubious analyses and erroneous methodology. (emphasis added)

To see the details you will need a subscription the the Proceedings of the National Academy of Sciences.

However, you can take this data analysis lesson from the abstract:

If your data can be replaced with random numbers and still yield statistically significant results, stop the publication process. Something is seriously wrong with your methodology.

I first saw this in a tweet by WvSchaik.

July 30, 2014

Awesome Machine Learning

Filed under: Data Analysis,Machine Learning,Visualization — Patrick Durusau @ 3:30 pm

Awesome Machine Learning by Joseph Misiti.

From the webpage:

A curated list of awesome machine learning frameworks, libraries and software (by language). Inspired by awesome-php. Other awesome lists can be found in the awesome-awesomeness list.

If you want to contribute to this list (please do), send me a pull request or contact me @josephmisiti

Not strictly limited to “machine learning” as it offers resources on data analysis, visualization, etc.

With a list of 576 resources, I am sure you will find something new!

July 25, 2014

Advanced Data Analysis from an Elementary Point of View (update)

Filed under: Data Analysis,Mathematics,Statistics — Patrick Durusau @ 3:37 pm

Advanced Data Analysis from an Elementary Point of View by Cosma Rohilla Shalizi. (8 January 2014)

From the introduction:

These are the notes for 36-402, Advanced Data Analysis, at Carnegie Mellon. If you are not enrolled in the class, you should know that it’s the methodological capstone of the core statistics sequence taken by our undergraduate majors (usually in their third year), and by students from a range of other departments. By this point, they have taken classes in introductory statistics and data analysis, probability theory, mathematical statistics, and modern linear regression (“401”). This class does not presume that you have learned but forgotten the material from the pre-requisites; it presumes that you know that material and can go beyond it. The class also presumes a firm grasp on linear algebra and multivariable calculus, and that you can read and write simple functions in R. If you are lacking in any of these areas, now would be an excellent time to leave.

I last reported on this draft in 2012 at: Advanced Data Analysis from an Elementary Point of View

Looking forward to this works publication by Cambridge University Press.

I first saw this in a tweet by Mark Patterson.

July 19, 2014

First complex, then simple

Filed under: Bioinformatics,Data Analysis,Data Mining,Data Models — Patrick Durusau @ 4:18 pm

First complex, then simple by James D Malley and Jason H Moore. (BioData Mining 2014, 7:13)

Abstract:

At the start of a data analysis project it is often suggested that the researcher look first at multiple simple models. That is, always begin with simple, one variable at a time analyses, such as multiple single-variable tests for association or significance. Then, later, somehow (how?) pull all the separate pieces together into a single comprehensive framework, an inclusive data narrative. For detecting true compound effects with more than just marginal associations, this is easily defeated with simple examples. But more critically, it is looking through the data telescope from wrong end.

I would have titled this article: “Data First, Models Later.”

That is the author’s start with no formal theories about what data will prove and upon finding signals in the data, then generate simple models to explain the signals.

I am sure their questions of the data are driven by a suspicion of what the data may prove, but that isn’t the same thing as asking questions designed to prove a model generated before the data is queried.

July 1, 2014

Introduction to Python for Econometrics, Statistics and Data Analysis

Filed under: Data Analysis,Python,Statistics — Patrick Durusau @ 7:04 pm

Introduction to Python for Econometrics, Statistics and Data Analysis by Kevin Sheppard.

From the introduction:

These notes are designed for someone new to statistical computing wishing to develop a set of skills necessary to perform original research using Python. They should also be useful for students, researchers or practitioners who require a versatile platform for econometrics, statistics or general numerical analysis (e.g. numeric solutions to economic models or model simulation).

Python is a popular general purpose programming language which is well suited to a wide range of problems. 1 Recent developments have extended Python’s range of applicability to econometrics, statistics and general numerical analysis. Python – with the right set of add-ons – is comparable to domain-specific languages such as MATLAB and R. If you are wondering whether you should bother with Python (or another language), a very incomplete list of considerations includes:

One of the more even-handed introductions I have read in a long time.

Enough examples and exercises to build some keyboard memory into your fingers! 😉

Bookmark this text so you can forward the link to others.

I first saw this in a tweet by yhat.

Older Posts »

Powered by WordPress