Another Word For It Patrick Durusau on Topic Maps and Semantic Diversity

August 20, 2016

Everybody Discusses The Weather In R (+ Trigger Warning)

Filed under: Climate Data,Climate Informatics,R,Weather Data — Patrick Durusau @ 3:01 pm

Well, maybe not everybody but if you are interested in weather statistics, there’s a trio of posts at R-Bloggers made for you.

Trigger Warning: If you are a climate change denier, you won’t like the results presented by the posts cited below. Facts dead ahead.

Tracking Precipitation by Day-of-Year

From the post:

Plotting cumulative day-of-year precipitation can helpful in assessing how the current year’s rainfall compares with long term averages. This plot shows the cumulative rainfall by day-of-year for Philadelphia International Airports rain gauge.

Checking Historical Precipitation Data Quality

From the post:

I am interested in evaluating potential changes in precipitation patterns caused by climate change. I have been working with daily precipitation data for the Philadelphia International Airport, site id KPHL, for the period 1950 to present time using R.

I originally used the Pennsylvania State Climatologist web site to download a CSV file of daily precipitation data from 1950 to the present. After some fits and starts analyzing this data set, I discovered that data for January was missing for the period 1950 – 1969. This data gap seriously limited the usable time record.

John Yagecic, (Adventures In Data) told me about the weatherData package which provides easy to use functions to retrieve Weather Underground data. I have found several precipitation data quality issues that may be of interest to other investigators.

Access and Analyze 170 Monthly Climate Time Series Using Simple R Scripts

From the post:

Open Mind, a climate trend data analysis blog, has a great Climate Data Service that provides updated consolidated csv file with 170 monthly climate time series. This is a great resource for those interested in studying climate change. Quick, reliable access to 170 up-to-date climate time series will save interested analysts hundreds – thousands of data wrangling hours of work.

This post presents a simple R script to show how a user can select one of the 170 data series and generate a time series plot like this:

All of these posts originated at RClimate, a new blog that focuses on R and climate data.

Drop by to say hello to D Kelly O’Day, PE (professional engineer) Retired.

Relevant searches at R-Bloggers (as of today):

Climate – 218 results

Flood – 61 results

Rainfall – 55 results

Weather – 291 results

Caution: These results contain duplicates.

Enjoy!
June 24, 2014

Virtual Workshop and Challenge (NASA)

Open NASA Earth Exchange (NEX) Virtual Workshop and Challenge 2014

From the webpage:

President Obama has announced a series of executive actions to reduce carbon pollution and promote sound science to understand and manage climate impacts for the U.S.

Following the President’s call for developing tools for climate resilience, OpenNEX is hosting a workshop that will feature:

  1. Climate science through lectures by experts
  2. Computational tools through virtual labs, and
  3. A challenge inviting participants to compete for prizes by designing and implementing solutions for climate resilience.

Whether you win any of the $60K in prize money or not, this looks like a great way to learn about climate data, approaches to processing climate data and the Amazon cloud all at one time!

Processing in the virtual labs is on the OpenNEX (Open NASA Earth Exchange) nickel. You can experience cloud computing without fear of the bill for computing services. Gain valuable cloud experience and possibly make a contribution to climate science.

Enjoy!

January 10, 2014

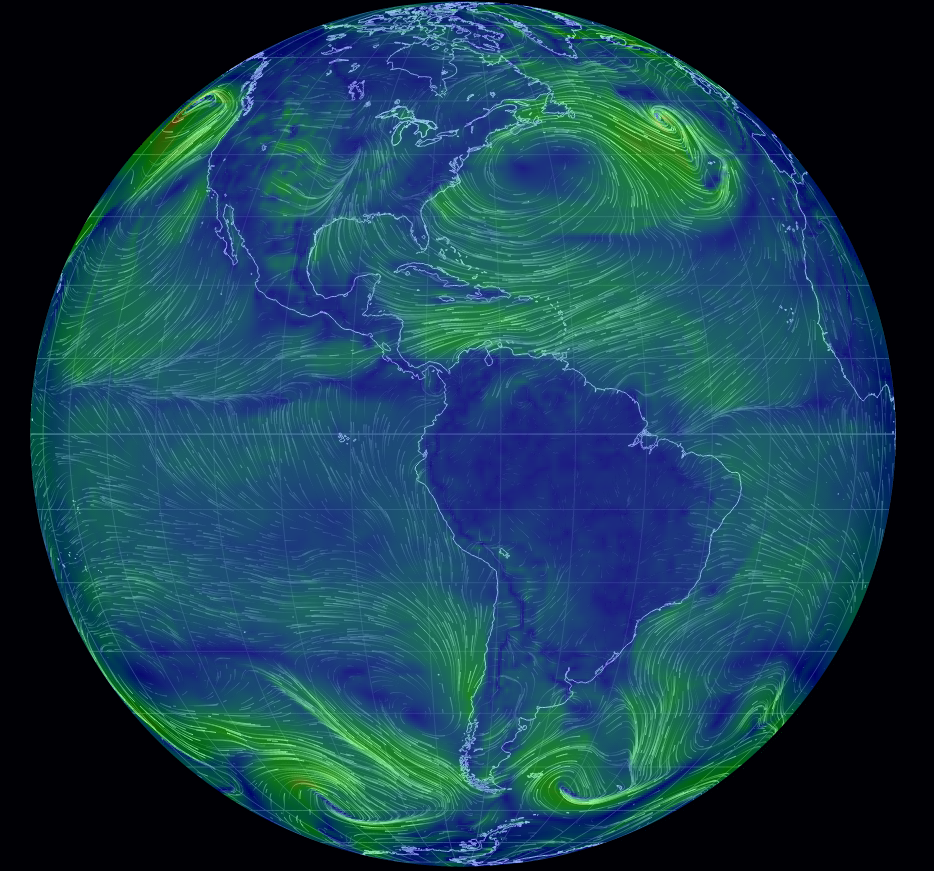
Dirty Wind Paths

Filed under: Climate Data,Climate Informatics,Graphics,Visualization,Weather Data — Patrick Durusau @ 6:38 pm

earth wind patterns

Interactive display of wind patterns on the Earth. Turn the globe, zoom in, etc.

Useful the next time a nuclear power plant cooks off.

If you doubt the “next time” part of that comment, review Timeline: Nuclear plant accidents from the BBC.

I count eleven (11) “serious” incidents between 1957 and 2014.

Highly dangerous activities are subject to catastrophic failure. Not every time or even often.

On the other hand, how often is an equivalent to the two U.S. space shuttle failures acceptable with a nuclear power plant?

If I were living nearby or in the wind path from a nuclear accident, I would say never.

You?

According to Dustin Smith at Chart Porn, where I first saw this, the chart updates every three hours.

January 29, 2013

What is Climate Informatics?

Filed under: Climate Informatics,Informatics — Patrick Durusau @ 6:51 pm

What is Climate Informatics? by Steve

From the post:

I’ve been using the term Climate Informatics informally for a few years to capture the kind of research I do, at the intersection of computer science and climate science. So I was delighted to be asked to give a talk at the second annual workshop on Climate Informatics at NCAR, in Boulder this week. The workshop has been fascinating – an interesting mix of folks doing various kinds of analysis on (often huge) climate datasets, mixing up techniques from Machine Learning and Data Mining with the more traditional statistical techniques used by field researchers, and the physics-based simulations used in climate modeling.

I was curious to see how this growing community defines itself – i.e. what does the term “climate informatics” really mean? Several of the speakers offered definitions, largely drawing on the idea of the Fourth Paradigm, a term coined by Jim Gray, who explained it as follows. Originally, science was purely empirical. In the last few centuries, theoretical science came along, using models and generalizations, and in the latter half of the twentieth century, computational simulations. Now, with the advent of big data, we can see a fourth scientific research paradigm emerging, sometimes called eScience, focussed on extracting new insights from vast collections of data. By this view, climate informatics could be defined as data-driven inquiry, and hence offers a complement to existing approaches to climate science.

However, there’s still some confusion, in part because the term is new, and crosses disciplinary boundaries. For example, some people expected that Climate Informatics would encompass the problems of managing and storing big data (e.g. the 3 petabytes generated by the CMIP5 project, or the exabytes of observational data that is now taxing the resources of climate data archivists). However, that’s not what this community does. So, I came up with my own attempt to define the term:

Fleshes out a term that gets tossed around without a lot of discussion.

Personally I have never understood the attraction of disciplinary boundaries. Other than as an “in” versus “out” crowd for journal/presentation acceptance.

Given the low citation rates in the humanities, being “in” a discipline, to say nothing of peer review, isn’t a guarantee of good work.

Powered by WordPress