Another Word For It Patrick Durusau on Topic Maps and Semantic Diversity

November 17, 2018

Query Expansion Techniques for Information Retrieval: a Survey

Filed under: Query Expansion,Subject Identity,Subject Recognition,Topic Maps — Patrick Durusau @ 9:12 pm

Query Expansion Techniques for Information Retrieval: a Survey by Hiteshwar Kumar Azad, Akshay Deepak.

With the ever increasing size of web, relevant information extraction on the Internet with a query formed by a few keywords has become a big challenge. To overcome this, query expansion (QE) plays a crucial role in improving the Internet searches, where the user’s initial query is reformulated to a new query by adding new meaningful terms with similar significance. QE — as part of information retrieval (IR) — has long attracted researchers’ attention. It has also become very influential in the field of personalized social document, Question Answering over Linked Data (QALD), and, Text Retrieval Conference (TREC) and REAL sets. This paper surveys QE techniques in IR from 1960 to 2017 with respect to core techniques, data sources used, weighting and ranking methodologies, user participation and applications (of QE techniques) — bringing out similarities and differences.

Another goodie for the upcoming holiday season. At forty-three (43) pages and needing updating, published in 2017, a real joy for anyone interested in query expansion.

Writing this post I realized that something is missing in discussions of query expansion. It is assumed that end-users are querying the data set and they are called upon to evaluate the results.

What if we change that assumption to an expert user querying the data set and authoring filtered results for end users?

Instead of presenting an end user with a topic map, no matter how clever its merging rules, they are presented with a curated information resource.

Granting that an expert may have been using a topic map to produce the curated information resource but of what concern is that for the end user?

November 1, 2018

Field Notes: Building Data Dictionaries [Rough-n-Ready Merging]

Filed under: Data Management,Data Provenance,Documentation,Merging,Topic Maps — Patrick Durusau @ 4:33 pm

Field Notes: Building Data Dictionaries by Caitlin Hudon.

From the post:

The scariest ghost stories I know take place when the history of data — how it’s collected, how it’s used, and what it’s meant to represent — becomes an oral history, passed down as campfire stories from one generation of analysts to another like a spooky game of telephone.

These stories include eerie phrases like “I’m not sure where that comes from”, “I think that broke a few years ago and I’m not sure if it was fixed”, and the ever-ominous “the guy who did that left”. When hearing these stories, one can imagine that a written history of the data has never existed — or if it has, it’s overgrown with ivy and tech-debt in an isolated statuary, never to be used again.

The best defense I’ve found against relying on an oral history is creating a written one.

Enter the data dictionary. A data dictionary is a “centralized repository of information about data such as meaning, relationships to other data, origin, usage, and format”, and provides us with a framework to store and share all of the institutional knowledge we have about our data.

Unless you have taken over the administration of an undocumented network, you cannot really appreciate Hudon’s statement:


As part of my role as a lead data scientist at a start-up, building a data dictionary was one of the first tasks I took on (started during my first week on the job).

I have taken over undocumented Novell and custom-written membership systems. They didn’t remain that way but moving to fully documented systems was perilous and time-consuming.

The first task for any such position is to confirm an existing data dictionary and/or build one if it doesn’t exist. No other task, except maybe the paperwork for HR so you can get paid, is more important.

Hudon’s outline of her data dictionary process is as good as any, but it doesn’t allow for variant and/or possibly conflicting data dictionaries. Or for detecting when “variants” are only apparent and not real.

Where Hudon has Field notes, consider inserting structured properties that you can then query for “merging” purposes.

It’s not necessary to work out how to merge all the other fields automatically, especially if you are exploring data or data dictionaries.

Or to put it differently, not every topic map results in a final, publishable, editorial product. Sometimes you only want enough subject identity to improve your data set or results. That’s not a crime.

August 31, 2018

Leonardo da Vinci’s Notebooks [IIIF + Topic Maps]

Victoria and Albert Museum brings Leonardo da Vinci’s notebooks to life online by Gareth Harris.

From the post:

Scholars and digital experts at the Victoria and Albert Museum (V&A) in London have posted online the contents of two notebooks by Leonardo da Vinci, enabling devotees of the Renaissance polymath to zoom in and examine his revolutionary ideas and concepts.

On the technical front, the use of IIIF (International Image Interoperability Framework) to present a digital version of the notebooks is an innovation. “It’s our use of the IIIF standard that has enabled us to present the codex in a new way. The V&A digital team has been doing a lot of work in the last 18 months using IIIF. We’ve used the deep-zoom functionality enabled through IIIF to present some of the most spectacular and detailed items in our collection,” says Kati Price, the V&A’s head of digital media and publishing.

Crucially, IIIF also lets scholars compare similar objects across several institutions’ collections. “Researchers can easily see the images together with Leonardo da Vinci items held by other institutions using IIIF, for side-by-side digital comparison,” Yvard says.

These two notebooks, not to mention those to be posted next year for the 500th anniversary of Leonardo’s death, are important in their own right.

However, I want to draw your attention to the use of International Image Interoperability Framework (IIIF) in this project.

From the IIIF FAQ:

What is IIIF?

The International Image Interoperability Framework (IIIF) is a set of shared application programming interface (API) specifications for interoperable functionality in digital image repositories. The IIIF is comprised of and driven by a community of libraries, museums, archives, software companies, and other organizations working together to create, test, refine, implement and promote the IIIF specifications. Using JSON-LD, linked data, and standard W3C web protocols such as Web Annotation, IIIF makes it easy to parse and share digital image data, migrate across technology systems, and provide enhanced image access for scholars and researchers. In short, IIIF enables better, faster and cheaper image delivery. It lets you leverage interoperability and the fabric of the Web to access new possibilities and new users for your image-based resources, while reducing long term maintenance and technological lock in. IIIF gives users a rich set of baseline functionality for viewing, zooming, and assembling the best mix of resources and tools to view, compare, manipulate and work with images on the Web, an experience made portable–shareable, citable, and embeddable.

What are the benefits of IIIF?

….

Advanced, interactive functionality for end users

  • Fast, rich, zoom and pan delivery of images
  • Manipulation of size, scale, region of interest, rotation, quality and format.
  • Annotation – IIIF has native compatibility with the W3C annotation working group’s Web Annotation Data Model, which supports annotating content on the Web. Users can comment on, transcribe, and draw on image-based resources using the Web’s inherent architecture.
  • Assemble and use image-based resources from across the Web, regardless of source. Compare pages, build an exhibit, or view a virtual collection of items served from different sites.
  • Cite and Share – IIIF APIs provide motivation for persistence, providing portable views of images and/or regions of images. Cite an image with confidence in stable image URIs, or share it for reference by others–or yourself in a different environment.

If you are looking to enhance your topic map with images, this sounds like the right way to go. Ping me with your examples of your uses of IIIF with topic maps.

BTW, the Draft IIIF v.3.0 Specifications have been released for review.

August 3, 2018

Podcasting from Scratch

Filed under: Podcasting,Topic Maps — Patrick Durusau @ 3:27 pm

Podcasting from Scratch by Alex Laughlin and Julia Furlan.

No promises but while thinking about a podcast on topic map authoring (something never covered in the standards) I encountered this eight (8) page guide.

It’s not everything you need to know but it’s enough to get you past the initial fear of starting a new activity or skill.

If and when I do post one or more podcasts, don’t judge Laughlin and Furlan by my efforts!

See how helpful they are in launching your podcasting career for yourself!

January 23, 2018

The vector algebra war: a historical perspective [Semantic Confusion in Engineering and Physics]

The vector algebra war: a historical perspective by James M. Chappell, Azhar Iqbal, John G. Hartnett, Derek Abbott.

Abstract:

There are a wide variety of different vector formalisms currently utilized in engineering and physics. For example, Gibbs’ three-vectors, Minkowski four-vectors, complex spinors in quantum mechanics, quaternions used to describe rigid body rotations and vectors defined in Clifford geometric algebra. With such a range of vector formalisms in use, it thus appears that there is as yet no general agreement on a vector formalism suitable for science as a whole. This is surprising, in that, one of the primary goals of nineteenth century science was to suitably describe vectors in three-dimensional space. This situation has also had the unfortunate consequence of fragmenting knowledge across many disciplines, and requiring a significant amount of time and effort in learning the various formalisms. We thus historically review the development of our various vector systems and conclude that Clifford’s multivectors best fulfills the goal of describing vectorial quantities in three dimensions and providing a unified vector system for science.

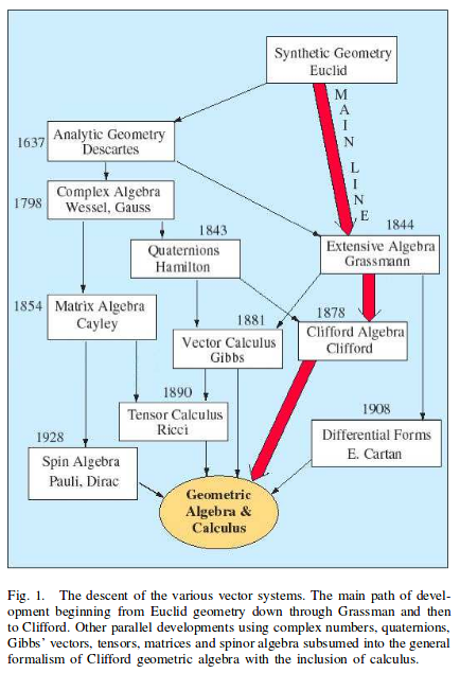
An image from the paper captures the “descent of the various vector systems:”

The authors contend for use of Clifford’s multivectors over the other vector formalisms described.

Assuming Clifford’s multivectors displace all other systems in use, the authors fail to answer how readers will access the present and past legacy of materials in other formalisms?

If the goal is to eliminate “fragmenting knowledge across many disciplines, and requiring a significant amount of time and effort in learning the various formalisms,” that fails in the absence of a mechanism to access existing materials using the Clifford’s multivector formalism.

Topic maps anyone?

December 27, 2017

Where Do We Write Down Subject Identifications?

Filed under: Subject Identifiers,Subject Identity,Topic Maps — Patrick Durusau @ 11:23 am

Modern Data Integration Paradigms by Matthew D. Sarrel, The Bloor Group.

Introduction:

Businesses of all sizes and industries are rapidly transforming to make smarter, data-driven decisions. To accomplish this transformation to digital business , organizations are capturing, storing, and analyzing massive amounts of structured, semi-structured, and unstructured data from a large variety of sources. The rapid explosion in data types and data volume has left many IT and data science/business analyst leaders reeling.

Digital transformation requires a radical shift in how a business marries technology and processes. This isn’t merely improving existing processes, but
rather redesigning them from the ground up and tightly integrating technology. The end result can be a powerful combination of greater efficiency, insight and scale that may even lead to disrupting existing markets. The shift towards reliance on data-driven decisions requires coupling digital information with powerful analytics and business intelligence tools in order to yield well-informed reasoning and business decisions. The greatest value of this data can be realized when it is analyzed rapidly to provide timely business insights. Any process can only be as timely as the underlying technology allows it to be.

Even data produced on a daily basis can exceed the capacity and capabilities of many pre-existing database management systems. This data can be structured or unstructured, static or streaming, and can undergo rapid, often unanticipated, change. It may require real-time or near-real-time transformation to be read into business intelligence (BI) systems. For these reasons, data integration platforms must be flexible and extensible to accommodate business’s types and usage patterns of the data.

There’s the usual homage to the benefits of data integration:


IT leaders should therefore try to integrate data across systems in a way that exposes them using standard and commonly implemented technologies such as SQL and REST. Integrating data, exposing it to applications, analytics and reporting improves productivity, simplifies maintenance, and decreases the amount of time and effort required to make data-driven decisions.

The paper covers, lightly, Operational Data Store (ODS) / Enterprise Data Hub (EDH), Enterprise Data Warehouse (EDW), Logical Data Warehouse (LDW), and Data Lake as data integration options.

Having found existing systems deficient in one or more ways, the report goes on to recommend replacement with Voracity.

To be fair, as described, all four systems plus Voracity are all deficient in the same way. The hard part of data integration, the rub that lies at the heart of the task, is passed over as ETL.

Efficient and correct ETL performance requires knowledge of what column headers, for instance, identify. For instance, from the Enron spreadsheets, can you specify the transformation of the data in the following columns? “A, B, C, D, E, F…” from andrea_ring_15_IFERCnov.xlsx, or “A, B, C, D, E,…” from andy_zipper__129__Success-TradeLog.xlsx?

With enough effort, no doubt you could go through speadsheets of interest and create a mapping sufficient to transform data of interest, but where are you going to write down the facts you established for each column that underlie your transformation?

In topic maps, we may the mistake of mystifying the facts for each column by claiming to talk about subject identity, which has heavy ontological overtones.

What we should have said was we wanted to talk about where do we write down subject identifications?

Thus:

  1. What do you want to talk about?
  2. Data in column F in andrea_ring_15_IFERCnov.xlsx
  3. Do you want to talk about each entry separately?
  4. What subject is each entry? (date written month/day (no year))
  5. What calendar system was used for the date?
  6. Who created that date entry? (If want to talk about them as well, create a separate topic and an association to the spreadsheet.)
  7. The date is the date of … ?
  8. Conversion rules for dates in column F, such as supplying year.
  9. Merging rules for #2? (date comparison)
  10. Do you want relationship between #2 and the other data in each row? (more associations)

With simple questions, we have documented column F of a particular spreadsheet for any present or future ETL operation. No magic, no logical conundrums, no special query language, just asking what an author or ETL specialist knew but didn’t write down.

There are subtlties such as distinguishing between subject identifiers (identifies a subject, like a wiki page) and subject locators (points to the subject we want to talk about, like a particular spreadsheet) but identifying what you want to talk about (subject identifications and where to write them down) is more familiar than our prior obscurities.

Once those identifications are written down, you can search those identifications to discover the same subjects identified differently or with properties in one identification and not another. Think of it as capturing the human knowledge that resides in the brains of your staff and ETL experts.

The ETL assumed by Bloor Group should be written: ETLD – Extract, Transform, Load, Dump (knowledge). That seems remarkably inefficient and costly to me. You?

December 16, 2017

Statistics vs. Machine Learning Dictionary (flat text vs. topic map)

Filed under: Dictionary,Machine Learning,Statistics,Topic Maps — Patrick Durusau @ 10:43 am

Data science terminology (UBC Master of Data Science)

From the webpage:

About this document

This document is intended to help students navigate the large amount of jargon, terminology, and acronyms encountered in the MDS program and beyond. There is also an accompanying blog post.

Stat-ML dictionary

This section covers terms that have different meanings in different contexts, specifically statistics vs. machine learning (ML).
… (emphasis in original)

Gasp! You don’t mean that the same words have different meanings in machine learning and statistics!

Even more shocking, some words/acronyms, have the same meaning!

Never fear, a human reader can use this document to distinguish the usages.

Automated processors, not so much.

If these terms were treated as occurrences of topics, where the topics had the respective scopes of statistics and machine-learning, then for any scoped document, an enhanced view with the correct definition for the unsteady reader could be supplied.

Static markup of legacy documents is not required as annotations can be added as a document is streamed to a reader. Opening the potential, of course, for different annotations depending upon the skill and interest of the reader.

If for each term/subject, more properties than the scope of statistics or machine-learning or both were supplied, users of the topic map could search on those properties to match terms not included here. Such as which type of bias (in statistics) does bias mean in your paper? A casually written Wikipedia article reports twelve and with refinement, the number could be higher.

Flat text is far easier to write than a topic map but tasks every reader with re-discovering the distinctions already known to the author of the document.

Imagine your office, department, agency’s vocabulary and its definitions captured and then used to annotate internal or external documentation for your staff.

Instead of very new staffer asking (hopefully), what do we mean by (your common term), the definition appears with a mouse-over in a document.

Are you capturing the soft knowledge of your staff?

December 9, 2017

Clojure 1.9 Hits the Streets!

Filed under: Clojure,Functional Programming,Merging,Topic Maps — Patrick Durusau @ 4:31 pm

Clojure 1.9 by Alex Miller.

From the post:

Clojure 1.9 is now available!

Clojure 1.9 introduces two major new features: integration with spec and command line tools.

spec (rationale, guide) is a library for describing the structure of data and functions with support for:

  • Validation
  • Error reporting
  • Destructuring
  • Instrumentation
  • Test-data generation
  • Generative test generation
  • Documentation

Clojure integrates spec via two new libraries (still in alpha):

This modularization facilitates refinement of spec separate from the Clojure release cycle.

The command line tools (getting started, guide, reference) provide:

  • Quick and easy install
  • Clojure REPL and runner
  • Use of Maven and local dependencies
  • A functional API for classpath management (tools.deps.alpha)

The installer is available for Mac developers in brew, for Linux users in a script, and for more platforms in the future.

Being interested in documentation, I followed the link to spec rationale and found:


Map specs should be of keysets only

Most systems for specifying structures conflate the specification of the key set (e.g. of keys in a map, fields in an object) with the specification of the values designated by those keys. I.e. in such approaches the schema for a map might say :a-key’s type is x-type and :b-key’s type is y-type. This is a major source of rigidity and redundancy.

In Clojure we gain power by dynamically composing, merging and building up maps. We routinely deal with optional and partial data, data produced by unreliable external sources, dynamic queries etc. These maps represent various sets, subsets, intersections and unions of the same keys, and in general ought to have the same semantic for the same key wherever it is used. Defining specifications of every subset/union/intersection, and then redundantly stating the semantic of each key is both an antipattern and unworkable in the most dynamic cases.

Decomplect maps/keys/values

Keep map (keyset) specs separate from attribute (key→value) specs. Encourage and support attribute-granularity specs of namespaced keyword to value-spec. Combining keys into sets (to specify maps) becomes orthogonal, and checking becomes possible in the fully-dynamic case, i.e. even when no map spec is present, attributes (key-values) can be checked.

Sets (maps) are about membership, that’s it

As per above, maps defining the details of the values at their keys is a fundamental complecting of concerns that will not be supported. Map specs detail required/optional keys (i.e. set membership things) and keyword/attr/value semantics are independent. Map checking is two-phase, required key presence then key/value conformance. The latter can be done even when the (namespace-qualified) keys present at runtime are not in the map spec. This is vital for composition and dynamicity.

The idea of checking keys separate from their values strikes me as a valuable idea for processing of topic maps.

Keys not allowed in a topic or proxy, could signal an error, as in authoring, could be silently discarded depending upon your processing goals, or could be maintained while not considered or processed for merging purposes.

Thoughts?

October 26, 2017

What’s New in the JFK Files? [A Topic Map Could Help Answer That Question]

Filed under: Government,Government Data,History,Topic Maps — Patrick Durusau @ 9:07 pm

The JFK Files: Calling On Citizen Reporters

From the webpage:

The government has released long-secret files on John F. Kennedy’s assassination, and we want your help.

The files are among the last to be released by the National Archives under a 1992 law that ordered the government to make public all remaining documents pertaining to the assassination. Other files are being withheld because of what the White House says are national security, law enforcement and foreign policy concerns.

There has long been a trove of conspiracy theories surrounding Kennedy’s murder in Dallas on Nov. 22, 1963, including doubts about whether Lee Harvey Oswald acted alone, as the Warren Commission determined in its report the following year.

Here’s where you come in. Read the documents linked here. If you find news or noteworthy nuggets among the pages, share them with us on the document below. If we use what you find, we’ll be sure to give you a shoutout!

Given the linear feet of existing files, finding new nuggets or aligning them with old nuggets in the original files, is going to be a slow process.

What more, you or I may find the exact nugget needed to connect dots for someone else, but since we all read, search, and maintain our searches separately, effective sharing of those nuggets won’t happen.

Depending on the granularity of a topic map over those same materials, confirmation of Oswald’s known whereabouts and who reported those could be easily examined and compared to new (if any) whereabouts information in these files. If new files confirm what is known, researchers could skip that material and move to subjects unknown in the original files.

A non-trivial encoding task but full details have been delayed pending another round of hiding professional incompetence. A topic map will help you ferret out the incompetents seeking to hide in the last releases of documents. Interested?

October 4, 2017

Law Library of Congress Chatbot

Filed under: Interface Research/Design,Law,Law - Sources,Library,Topic Maps — Patrick Durusau @ 2:51 pm

We are Excited to Announce the Release of the Law Library of Congress Chatbot by Robert Brammer.

From the webpage:

We are excited to announce the release of a new chatbot that can connect you to primary sources of law, Law Library research guides and our foreign law reports. The chatbot has a clickable interface that will walk you through a basic reference interview. Just click “get started,” respond “yes” or “no” to its questions, and then click on the buttons that are relevant to your needs. If you would like to return to the main menu, you can always type “start over.”

(image omitted)

The chatbot can also respond to a limited number of text commands. Just type “list of commands” to view some examples. We plan to add to the chatbot’s vocabulary based on user interaction logs, particularly whenever a question triggers the default response, which directs the user to our Ask A Librarian service. To give the chatbot a try, head over to our Facebook page and click the blue “Send Message” button.

The response to “list of commands” returns in part this content:

This page provides examples of text commands that can be used with the Law Library of Congress chat bot. The chat bot should also understand variations of these commands and its vocabulary will increase over time as we add new responses. If you have any questions, please contact us through Ask A Librarian.

(I deleted the table of contents to the following commands)


Advance Healthcare Directives
-I want to make an advanced health care directive
-I want to make a living will

Caselaw
– I want to find a case

Civil Rights
My voting rights were violated
– I was turned away at the polling station
– I feel I have been a victim of sexual harassment

Constitutional Law
– I want to learn about the U.S. Constitution
– I want to locate a state constitution
-I want to learn about the history of the U.S. Constitution

Employment Law
-I would like to learn more about employment law
-I was not paid overtime

Family Law
– I have been sued for a divorce
– I want to sue for child custody
– I want to sue for child support
– My former spouse is not paying child support

Federal Statutes
– I want to find a federal statute

File a Lawsuit
– I want to file a lawsuit

Foreclosure
– My house is in foreclosure

Immigration
– I am interested in researching immigration law
-I am interested in researching asylum law

Landlord-Tenant Law
– My landlord is violating my lease
-My landlord does not maintain my property

Legal Drafting
Type “appeal”, “motion”, or “complaint”

Lemon Laws
– I bought a car that is a lemon

Municipal Law
– My neighbor is making loud noise
-My neighbor is letting their dog out without a leash
-My neighbor is not maintaining their property
-My neighbor’s property is overgrown

Real Estate
-I’m looking for a deed
– I’m looking for a real estate form

State Statutes
I want to find state statutes

Social Security Disability
– I want to apply for disability

Wills and Probate
– I want to draft a will
– I want to probate an estate

Unlike some projects, the Law Library of Congress chat bot doesn’t learn from its users, at least not automatically. Interactions are reviewed by librarians and content changed/updated.

Have you thought about a chat bot user interface to a topic map? The user might have no idea that results are merged and otherwise processed before presentation.

When I say “user interface,” I’m thinking of the consumer of a topic map, who may or may not be interested in how the information is being processed, but is interested in a useful answer.

September 29, 2017

@niccdias and @cward1e on Mis- and Dis-information [Additional Questions]

Filed under: Authoring Topic Maps,Journalism,News,Reporting,Social Media,Topic Maps — Patrick Durusau @ 7:50 pm

10 questions to ask before covering mis- and dis-information by Nic Dias and Claire Wardle.

From the post:

Can silence be the best response to mis- and dis-information?

First Draft has been asking ourselves this question since the French election, when we had to make difficult decisions about what information to publicly debunk for CrossCheck. We became worried that – in cases where rumours, misleading articles or fabricated visuals were confined to niche communities – addressing the content might actually help to spread it farther.

As Alice Marwick and Rebecca Lewis noted in their 2017 report, Media Manipulation and Disinformation Online, “[F]or manipulators, it doesn’t matter if the media is reporting on a story in order to debunk or dismiss it; the important thing is getting it covered in the first place.” Buzzfeed’s Ryan Broderick seemed to confirm our concerns when, on the weekend of the #MacronLeaks trend, he tweeted that 4channers were celebrating news stories about the leaks as a “form of engagement.”

We have since faced the same challenges in the UK and German elections. Our work convinced us that journalists, fact-checkers and civil society urgently need to discuss when, how and why we report on examples of mis- and dis-information and the automated campaigns often used to promote them. Of particular importance is defining a “tipping point” at which mis- and dis-information becomes beneficial to address. We offer 10 questions below to spark such a discussion.

Before that, though, it’s worth briefly mentioning the other ways that coverage can go wrong. Many research studies examine how corrections can be counterproductive by ingraining falsehoods in memory or making them more familiar. Ultimately, the impact of a correction depends on complex interactions between factors like subject, format and audience ideology.

Reports of disinformation campaigns, amplified through the use of bots and cyborgs, can also be problematic. Experiments suggest that conspiracy-like stories can inspire feelings of powerlessness and lead people to report lower likelihoods to engage politically. Moreover, descriptions of how bots and cyborgs were found give their operators the opportunity to change strategies and better evade detection. In a month awash with revelations about Russia’s involvement in the US election, it’s more important than ever to discuss the implications of reporting on these kinds of activities.

Following the French election, First Draft has switched from the public-facing model of CrossCheck to a model where we primarily distribute our findings via email to newsroom subscribers. Our election teams now focus on stories that are predicted (by NewsWhip’s “Predicted Interactions” algorithm) to be shared widely. We also commissioned research on the effectiveness of the CrossCheck debunks and are awaiting its results to evaluate our methods.

The ten questions (see the post) should provoke useful discussions in newsrooms around the world.

I have three additional questions that round Nic Dias and Claire Wardle‘s list to a baker’s dozen:

  1. How do you define mis- or dis-information?
  2. How do you evaluate information to classify it as mis- or dis-information?
  3. Are your evaluations of specific information as mis- or dis-information public?

Defining dis- or mis-information

The standard definitions (Merriam Webster) for:

disinformation: false information deliberately and often covertly spread (as by the planting of rumors) in order to influence public opinion or obscure the truth

misinformation: incorrect or misleading information

would find nodding agreement from Al Jazeera and the CIA, to the European Union and Recep Tayyip Erdoğan.

However, what is or is not disinformation or misinformation would vary from one of those parties to another.

Before reaching the ten questions of Nic Dias and Claire Wardle, define what you mean by disinformation or misinformation. Hopefully with numerous examples, especially ones that are close to the boundaries of your definitions.

Otherwise, all your readers know is that on the basis of some definition of disinformation/misinformation known only to you, information has been determined to be untrustworthy.

Documenting your process to classify as dis- or mis-information

Assuming you do arrive at a common definition of misinformation or disinformation, what process do you use to classify information according to those definitions? Ask your editor? That seems like a poor choice but no doubt it happens.

Do you consult and abide by an opinion found on Snopes? Or Politifact? Or FactCheck.org? Do all three have to agree for a judgement of misinformation or disinformation? What about other sources?

What sources do you consider definitive on the question of mis- or disinformation? Do you keep that list updated? How did you choose those sources over others?

Documenting your evaluation of information as dis- or mis-information

Having a process for evaluating information is great.

But have you followed that process? If challenged, how would you establish the process was followed for a particular piece of information?

Is your documentation office “lore,” or something more substantial?

An online form that captures the information, its source, the check fact source consulted with date, decision and person making the decision would take only seconds to populate. In addition to documenting the decision, you can build up a record of a source’s reliability.

Conclusion

Vagueness makes discussion and condemnation of mis- or dis-information easy to do and difficult to have a process for evaluating information, a common ground for classifying that information, to say nothing of documenting your decision on specific information.

Don’t be the black box of whim and caprice users experience at Twitter, Facebook and Google. You can do better than that.

August 31, 2017

July 27, 2017

Dimensions of Subject Identification

Filed under: Subject Identifiers,Subject Identity,Topic Maps — Patrick Durusau @ 2:30 pm

This isn’t a new idea, but it occurred to me that introducing readers to “dimensions of subject identification” might be an easier on ramp for topic maps. It enables us to dodge the sticky issues of “identity,” in favor of asking what do you want to talk about? and how many do you want/need to identify it?

To start with a classic example, if we only have one dimension and the string “Paris,” ambiguity is destined to follow.

If we add a country dimension, now having two dimensions, “Paris” + “France” can be distinguished from all other uses of “Paris” with the string + country dimension.

The string + country dimension fares less well for “Paris” + country = “United States:”

For the United States you need “Paris” + country + state dimensions, at a minimum, but that leaves you with two instances of Paris in Ohio.

One advantage of speaking of “dimensions of subject identification” is that we can order systems of subject identification by the number of dimensions they offer. Not to mention examining the consequences of the choices of dimensions.

One dimensional systems, that is a solitary string, "Paris," as we said above, leave users with no means to distinguish one use from another. They are useful and common in CSV files or database tables, but risk ambiguity and being difficult to communicate accurately to others.

Two dimensional systems, that is city = "Paris," enables users to distinguish usages other than for city, but as you can see from the Paris example in the U.S., that may not be sufficient.

Moreover, city itself may be a subject identified by multiple dimensions, as different governmental bodies define “city” differently.

Just as some information systems only use one dimensional strings for headers, other information systems may use one dimensional strings for the subject city in city = "Paris." But all systems can capture multiple dimensions of identification for any subjects, separate from those systems.

Perhaps the most useful aspect of dimensions of identification is enabling user to ask their information architects what dimensions and their values serve to identify subjects in information systems.

Such as the headers in database tables or spreadsheets. 😉

June 30, 2017

If Silo Owners Love Their Children Too*

Filed under: Silos,Topic Maps — Patrick Durusau @ 8:58 am

* Apologies to Sting for the riff on the lyrics to Russians.

Topic Maps Now by Michel Biezunski.

From the post:

This article is my assessment on where Topic Maps are standing today. There is a striking contradiction between the fact that many web sites are organized as a set of interrelated topics — Wikipedia for example — and the fact that the name “Topic Maps” is hardly ever mentioned. In this paper, I will show why this is happening and advocate that the notions of topic mapping are still useful, even if they need to be adapted to new methods and systems. Furthermore, this flexibility in itself is a guarantee that they are still going to be relevant in the long term.

I have spent many years working with topic maps. I took part in the design of the initial topic maps model, I started the process to transform the conceptual model into an international standard. We published the first edition of Topic Maps ISO/IEC 13250 in 2000, and an update and a couple of years later in XML. Several other additions to the standard were published since then, the most recent one in 2015. During the last 15 years, I have helped clients create and manage topic map applications, and I am still doing it.

An interesting read, some may quibble over the details, but my only serious disagreement comes when Michel says:


When we created the Topic maps standard, we created something that turned out to be a solution without a problem: the possibility to merge knowledge networks across organizations. Despite numerous expectations and many efforts in that direction, this didn’t prove to meet enough demands from users.

On the contrary, the inability “…to merge knowledge networks across organizations” is a very real problem. It’s one that has existed since there was more than one record that capture information about the same subject, inconsistently. That original event has been lost in the depths of time.

The inability “…to merge knowledge networks across organizations” has persisted to this day, relieved only on occasion by the use of the principles developed as part of the topic maps effort.

If “mistake” it was, the “mistake” of topic maps was failing to realize that silo owners have an investment in the maintenance of their silos. Silos distinguish them from other silo owners, make them important both intra and inter organization, make the case for their budgets, their staffs, etc.

To argue that silos create inefficiencies for an organization is to mistake efficiency as a goal of the organization. There’s no universal ordering of the goals of organizations (commercial or governmental) but preservation or expansion of scope, budget, staff, prestige, mission, all trump “efficiency” for any organization.

Unfunded “benefits for others” (including the public) falls into the same category as “efficiency.” Unfunded “benefits for others” is also a non-goal of organizations, including governmental ones.

Want to appeal to silo owners?

Appeal to silo owners on the basis of extending their silos to consume the silos of others!

Market topic maps not as leading to a Kumbaya state of openness and stupor but of aggressive assimilation of other silos.

If the CIA assimilates part of the NSA or the NSA assimilates part of the FSB , or the FSB assimilates part of the MSS, what is assimilated, on what basis and what of those are shared, isn’t decided by topic maps. Those issues are decided by the silo owners paying for the topic map.

Topic maps and subject identity are non-partisan tools that enable silo poaching. If you want to share your results, that’s your call, not mine and certainly not topic maps.

Open data, leaking silos, envious silo owners, the topic maps market is so bright I gotta wear shades.**

** Unseen topic maps may be robbing you of the advantages of your silo even as you read this post. Whose silo(s) do you covet?

June 8, 2017

Open data quality – Subject Identity By Another Name

Filed under: Open Data,Record Linkage,Subject Identity,Topic Maps,XQuery — Patrick Durusau @ 1:03 pm

Open data quality – the next shift in open data? by Danny Lämmerhirt and Mor Rubinstein.

From the post:

Some years ago, open data was heralded to unlock information to the public that would otherwise remain closed. In the pre-digital age, information was locked away, and an array of mechanisms was necessary to bridge the knowledge gap between institutions and people. So when the open data movement demanded “Openness By Default”, many data publishers followed the call by releasing vast amounts of data in its existing form to bridge that gap.

To date, it seems that opening this data has not reduced but rather shifted and multiplied the barriers to the use of data, as Open Knowledge International’s research around the Global Open Data Index (GODI) 2016/17 shows. Together with data experts and a network of volunteers, our team searched, accessed, and verified more than 1400 government datasets around the world.

We found that data is often stored in many different places on the web, sometimes split across documents, or hidden many pages deep on a website. Often data comes in various access modalities. It can be presented in various forms and file formats, sometimes using uncommon signs or codes that are in the worst case only understandable to their producer.

As the Open Data Handbook states, these emerging open data infrastructures resemble the myth of the ‘Tower of Babel’: more information is produced, but it is encoded in different languages and forms, preventing data publishers and their publics from communicating with one another. What makes data usable under these circumstances? How can we close the information chain loop? The short answer: by providing ‘good quality’ open data.

Congratulations to Open Knowledge International on re-discovering the ‘Tower of Babel’ problem that prevents easy re-use of data.

Contrary to Lämmerhirt and Rubinstein’s claim, barriers have not “…shifted and multiplied….” More accurate to say Lämmerhirt and Rubinstein have experienced what so many other researchers have found for decades:


We found that data is often stored in many different places on the web, sometimes split across documents, or hidden many pages deep on a website. Often data comes in various access modalities. It can be presented in various forms and file formats, sometimes using uncommon signs or codes that are in the worst case only understandable to their producer.

The record linkage community, think medical epidemiology, has been working on aspects of this problem since the 1950’s at least (under that name). It has a rich and deep history, focused in part on mapping diverse data sets to a common representation and then performing analysis upon the resulting set.

A common omission in record linkage is to capture in discoverable format, the basis for mapping of the diverse records to a common format. That is subjects represented by “…uncommon signs or codes that are in the worst case only understandable to their producer,” that Lämmerhirt and Rubinstein complain of, although signs and codes need not be “uncommon” to be misunderstood by others.

To their credit, unlike RDF and the topic maps default, record linkage has long recognized that identification consists of multiple parts and not single strings.

Topic maps, at least at their inception, was unaware of record linkage and the vast body of research done under that moniker. Topic maps were bitten by the very problem they were seeking to solve. That being a subject, could be identified many different ways and information discovered by others about that subject, could be nearby but undiscoverable/unknown.

Rather than building on the experience with record linkage, topic maps, at least in the XML version, defaulted to relying on URLs to identify the location of subjects (resources) and/of identifying subjects (identifiers). Avoiding the Philosophy 101 mistakes of RDF, confusing locators and identifiers + refusing to correct the confusion, wasn’t enough for topic maps to become widespread. One suspects in part because topic maps were premised on creating more identifiers for subjects which already had them.

Imagine that your company has 1,000 employees and in order to use a new system, say topic maps, everyone must get a new name. Can’t use the old one. Do you see a problem? Now multiple that by every subject anyone in your company wants to talk about. We won’t run out of identifiers but your staff will certainly run out of patience.

Robust solutions to the open data ‘Tower of Babel’ issue will include the use of multi-part identifications extant in data stores, dynamic creation of multi-part identifications when necessary (note, no change to existing data store), discoverable documentation of multi-part identifications and their mappings, where syntax and data models are up to the user of data.

That sounds like a job for XQuery to me.

You?

May 10, 2017

Cloudera Introduces Topic Maps Extra-Lite

Filed under: Cloudera,Hue,SQL,Topic Maps — Patrick Durusau @ 7:36 pm

New in Cloudera Enterprise 5.11: Hue Data Search and Tagging by Romain Rigaux.

From the post:

Have you ever struggled to remember table names related to your project? Does it take much too long to find those columns or views? Hue now lets you easily search for any table, view, or column across all databases in the cluster. With the ability to search across tens of thousands of tables, you’re able to quickly find the tables that are relevant for your needs for faster data discovery.

In addition, you can also now tag objects with names to better categorize them and group them to different projects. These tags are searchable, expediting the exploration process through easier, more intuitive discovery.

Through an integration with Cloudera Navigator, existing tags and indexed objects show up automatically in Hue, any additional tags you add appear back in Cloudera Navigator, and the familiar Cloudera Navigator search syntax is supported.
… (emphasis in original)

Seventeen (17) years ago, ISO/IEC 13250:2000 offered users the ability to have additional names for tables, columns and/or any other subject of interest.

Additional names that could have scope (think range of application, such as a language), that could exist in relationships to their creators/users, exposing as much or as little information to a particular user as desired.

For commonplace needs, perhaps tagging objects with names, displayed as simple string is sufficient.

But if viewed from a topic maps perspective, that string display to one user could in fact represent that string, along with who created it, what names it is used with, who uses similar names, just to name a few of the possibilities.

All of which makes me think topic maps should ask users:

  • What subjects do you need to talk about?
  • How do you want to identify those subjects?
  • What do you want to say about those subjects?
  • Do you need to talk about associations/relationships?

It could be, that for day to day users, a string tag/name is sufficient. That doesn’t mean that greater semantics don’t lurk just below the surface. Perhaps even on demand.

April 27, 2017

Facebook Used To Spread Propaganda (The other use of Facebook would be?)

Filed under: Facebook,Government,Journalism,News,Subject Identity,Topic Maps — Patrick Durusau @ 8:31 pm

Facebook admits: governments exploited us to spread propaganda by Olivia Solon.

From the post:

Facebook has publicly acknowledged that its platform has been exploited by governments seeking to manipulate public opinion in other countries – including during the presidential elections in the US and France – and pledged to clamp down on such “information operations”.

In a white paper authored by the company’s security team and published on Thursday, the company detailed well-funded and subtle techniques used by nations and other organizations to spread misleading information and falsehoods for geopolitical goals. These efforts go well beyond “fake news”, the company said, and include content seeding, targeted data collection and fake accounts that are used to amplify one particular view, sow distrust in political institutions and spread confusion.

“We have had to expand our security focus from traditional abusive behavior, such as account hacking, malware, spam and financial scams, to include more subtle and insidious forms of misuse, including attempts to manipulate civic discourse and deceive people,” said the company.

It’s a good white paper and you can intuit a lot from it, but leaks on the details of Facebook counter-measures have commercial value.

Careful media advisers will start farming Facebook users now for the US mid-term elections in 2018. One of the “tells” (a behavior that discloses, unintentionally, a player’s intent) of a “fake” account is recent establishment with many similar accounts.

Such accounts need to be managed so that their “identity” fits the statistical average for similar accounts. They should not all suddenly like a particular post or account, for example.

The doctrines of subject identity in topic maps, can be used to avoid subject recognition as well as to insure it. Just the other side of the same coin.

March 25, 2017

Your maps are not lying to you

Filed under: Mapping,Maps,Topic Maps — Patrick Durusau @ 8:34 pm

Your maps are not lying to you by Andy Woodruff.

From the post:

Or, your maps are lying to you but so would any other map.

A week or two ago [edit: by now, sometime last year] a journalist must have discovered thetruesize.com, a nifty site that lets you explore and discover how sizes of countries are distorted in the most common world map, and thus was born another wave of #content in the sea of web media.

Your maps are lying to you! They are WRONG! Everything you learned is wrong! They are instruments of imperial oppressors! All because of the “monstrosity” of a map projection, the Mercator projection.

Technically, all of that is more or less true. I love it when little nuggets of cartographic education make it into popular media, and this is no exception. However, those articles spend most of their time damning the Mercator projection, and relatively little on the larger point:

There are precisely zero ways to draw an accurate map on paper or a screen. Not a single one.

In any bizarro world where a different map is the standard, the internet is still abuzz with such articles. The only alternatives to that no-good, lying map of yours are other no-good, lying maps.

Andy does a great job of covering the reasons why maps (in the geographic sense) are less than perfect for technical (projection) as well as practical (abstraction, selection) reasons. He also offers advice on how to critically evaluate a map for “bias.” Or at least possibly discovering some of its biases.

For maps of all types, including topic maps, the better question is:

Does the map represent the viewpoint you were paid to represent?

If yes, it’s a great map. If no, your client will be unhappy.

Critics of maps, whether they admit it or not, are inveighing for a map as they would have created it. That should be on their dime and not yours.

February 14, 2017

We’re Bringing Learning to Rank to Elasticsearch [Merging Properties Query Dependent?]

Filed under: DSL,ElasticSearch,Merging,Search Engines,Searching,Topic Maps — Patrick Durusau @ 8:26 pm

We’re Bringing Learning to Rank to Elasticsearch.

From the post:

It’s no secret that machine learning is revolutionizing many industries. This is equally true in search, where companies exhaust themselves capturing nuance through manually tuned search relevance. Mature search organizations want to get past the “good enough” of manual tuning to build smarter, self-learning search systems.

That’s why we’re excited to release our Elasticsearch Learning to Rank Plugin. What is learning to rank? With learning to rank, a team trains a machine learning model to learn what users deem relevant.

When implementing Learning to Rank you need to:

  1. Measure what users deem relevant through analytics, to build a judgment list grading documents as exactly relevant, moderately relevant, not relevant, for queries
  2. Hypothesize which features might help predict relevance such as TF*IDF of specific field matches, recency, personalization for the searching user, etc.
  3. Train a model that can accurately map features to a relevance score
  4. Deploy the model to your search infrastructure, using it to rank search results in production

Don’t fool yourself: underneath each of these steps lie complex, hard technical and non-technical problems. There’s still no silver bullet. As we mention in Relevant Search, manual tuning of search results comes with many of the same challenges as a good learning to rank solution. We’ll have more to say about the many infrastructure, technical, and non-technical challenges of mature learning to rank solutions in future blog posts.

… (emphasis in original)

A great post as always but of particular interest for topic map fans is this passage:


Many of these features aren’t static properties of the documents in the search engine. Instead they are query dependent – they measure some relationship between the user or their query and a document. And to readers of Relevant Search, this is what we term signals in that book.
… (emphasis in original)

Do you read this as suggesting the merging exhibited to users should depend upon their queries?

That two or more users, with different query histories could (should?) get different merged results from the same topic map?

Now that’s an interesting suggestion!

Enjoy this post and follow the blog for more of same.

(I have a copy of Relevant Search waiting to be read so I had better get to it!)

November 15, 2016

Researchers found mathematical structure that was thought not to exist [Topic Map Epistemology]

Filed under: Epistemology,Mathematics,Philosophy,Topic Maps — Patrick Durusau @ 5:04 pm

Researchers found mathematical structure that was thought not to exist

From the post:

Researchers found mathematical structure that was thought not to exist. The best possible q-analogs of codes may be useful in more efficient data transmission.

The best possible q-analogs of codes may be useful in more efficient data transmission.

In the 1970s, a group of mathematicians started developing a theory according to which codes could be presented at a level one step higher than the sequences formed by zeros and ones: mathematical subspaces named q-analogs.

While “things thought to not exist” may pose problems for ontologies and other mechanical replicas of truth, topic maps are untroubled by them.

As the Topic Maps Data Model (TMDM) provides:

subject: anything whatsoever, regardless of whether it exists or has any other specific characteristics, about which anything whatsoever may be asserted by any means whatsoever

A topic map can be constrained by its author to be as stunted as early 20th century logical positivism or have a more post-modernist approach, somewhere in between or elsewhere, but topic maps in general are amenable to any such choice.

One obvious advantage of topic maps being that characteristics of things “thought not to exist” can be captured as they are discussed, only to result in the merging of those discussions with those following the discovery things “thought not to exist really do exist.”

The reverse is also true, that is topic maps can capture the characteristics of things “thought to exist” which are later “thought to not exist,” along with the transition from “existence” to being thought to be non-existent.

If existence to non-existence sounds difficult, imagine a police investigation where preliminary statements then change and or replaced by other statements. You may want to capture prior statements, no longer thought to be true, along with their relationships to later statements.

In “real world” situations, you need epistemological assumptions in your semantic paradigm that adapt to the world as experienced and not limited to the world as imagined by others.

Topic maps offer an open epistemological assumption.

Does your semantic paradigm do the same?

October 19, 2016

The Podesta Emails [In Bulk]

Filed under: Government,Hillary Clinton,Searching,Topic Maps,Wikileaks — Patrick Durusau @ 7:53 pm

Wikileaks has been posting:

The Podesta Emails, described as:

WikiLeaks series on deals involving Hillary Clinton campaign Chairman John Podesta. Mr Podesta is a long-term associate of the Clintons and was President Bill Clinton’s Chief of Staff from 1998 until 2001. Mr Podesta also owns the Podesta Group with his brother Tony, a major lobbying firm and is the Chair of the Center for American Progress (CAP), a Washington DC-based think tank.

long enough for them to be decried as “interference” with the U.S. presidential election.

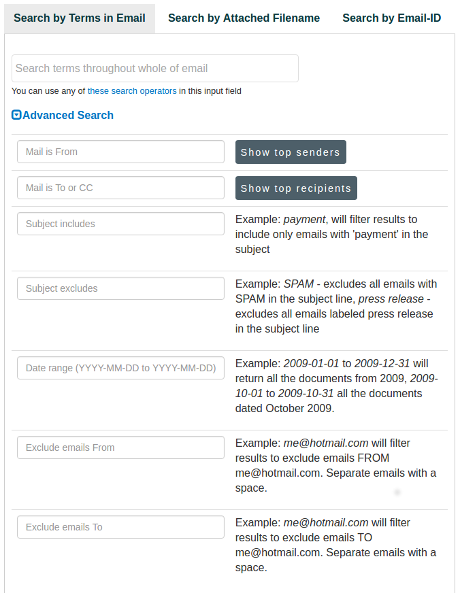
You have two search options, basic:

podesta-basic-search-460

and, advanced:

podesta-adv-search-460

As handy as these search interfaces are, you cannot easily:

  • Analyze relationships between multiple senders and/or recipients of emails
  • Perform entity recognition across the emails as a corpus
  • Process the emails with other software
  • Integrate the emails with other data sources
  • etc., etc.

Michael Best, @NatSecGeek, is posting all the Podesta emails as they are released at: Podesta Emails (zipped).

As of Podesta Emails 13, there is approximately 2 GB of zipped email files available for downloading.

The search interfaces at Wikileaks may work for you, but if you want to get closer to the metal, you have Michael Best to thank for that opportunity!

Enjoy!

September 20, 2016

NSA: Being Found Beats Searching, Every Time

Filed under: Searching,Topic Maps — Patrick Durusau @ 4:41 pm

Equation Group Firewall Operations Catalogue by Mustafa Al-Bassam.

From the post:

This week someone auctioning hacking tools obtained from the NSA-based hacking group “Equation Group” released a dump of around 250 megabytes of “free” files for proof alongside the auction.

The dump contains a set of exploits, implants and tools for hacking firewalls (“Firewall Operations”). This post aims to be a comprehensive list of all the tools contained or referenced in the dump.

Mustafa’s post is a great illustration of why “being found beats searching, every time.”

Think of the cycles you would have to spend to duplicate this list. Multiple that by the number of people interested in this list. Assuming their time is not valueless, do you start to see the value-add of Mustafa’s post?

Mustafa found each of these items in the data dump and then preserved his finding for the use of others.

It’s not a very big step beyond this preservation to the creation of a container for each of these items, enabling the preservation of other material found on them or related to them.

Search is a starting place and not a destination.

Unless you enjoy repeating the same finding process over and over again.

Your call.

September 8, 2016

No Properties/No Structure – But, Subject Identity

Filed under: Category Theory,Subject Identity,Topic Maps — Patrick Durusau @ 8:08 pm

Jack Park has prodded me into following some category theory and data integration papers. More on that to follow but as part of that, I have been watching Bartosz Milewski’s lectures on category theory, reading his blog, etc.

In Category Theory 1.2, Mileski goes to great lengths to emphasize:

Objects are primitives with no properties/structure – a point

Morphism are primitives with no properties/structure, but do have a start and end point

Late in that lecture, Milewski says categories are the “ultimate in data hiding” (read abstraction).

Despite their lack of properties and structure, both objects and morphisms have subject identity.

Yes?

I think that is more than clever use of language and here’s why:

If I want to talk about objects in category theory as a group subject, what can I say about them? (assuming a scope of category theory)

  1. Objects have no properties
  2. Objects have no structure
  3. Objects mark the start and end of morphisms (distinguishes them from morphisms)
  4. Every object has an identity morphism
  5. Every pair of objects may have 0, 1, or many morphisms between them
  6. Morphisms may go in both directions, between a pair of morphisms
  7. An object can have multiple morphisms that start and end at it

Incomplete and yet a lot of things to say about something that has no properties and no structure. 😉

Bearing in mind, that’s just objects in general.

I can also talk about a specific object at a particular time point in the lecture and screen location, which itself is a subject.

Or an object in a paper or monograph.

We can declare primitives, like objects and morphisms, but we should always bear in mind they are declared to be primitives.

For other purposes, we can declare them to be otherwise.

September 6, 2016

Data Provenance: A Short Bibliography

Filed under: Data Aggregation,Data Provenance,Merging,Topic Maps,XQuery — Patrick Durusau @ 7:45 pm

The video Provenance for Database Transformations by Val Tannen ends with a short bibliography.

Links and abstracts for the items in Val’s bibliography:

Provenance Semirings by Todd J. Green, Grigoris Karvounarakis, Val Tannen. (2007)

We show that relational algebra calculations for incomplete databases, probabilistic databases, bag semantics and whyprovenance are particular cases of the same general algorithms involving semirings. This further suggests a comprehensive provenance representation that uses semirings of polynomials. We extend these considerations to datalog and semirings of formal power series. We give algorithms for datalog provenance calculation as well as datalog evaluation for incomplete and probabilistic databases. Finally, we show that for some semirings containment of conjunctive queries is the same as for standard set semantics.

Update Exchange with Mappings and Provenance by Todd J. Green, Grigoris Karvounarakis, Zachary G. Ives, Val Tannen. (2007)

We consider systems for data sharing among heterogeneous peers related by a network of schema mappings. Each peer has a locally controlled and edited database instance, but wants to ask queries over related data from other peers as well. To achieve this, every peer’s updates propagate along the mappings to the other peers. However, this update exchange is filtered by trust conditions — expressing what data and sources a peer judges to be authoritative — which may cause a peer to reject another’s updates. In order to support such filtering, updates carry provenance information. These systems target scientific data sharing applications, and their general principles and architecture have been described in [20].

In this paper we present methods for realizing such systems. Specifically, we extend techniques from data integration, data exchange, and incremental view maintenance to propagate updates along mappings; we integrate a novel model for tracking data provenance, such that curators may filter updates based on trust conditions over this provenance; we discuss strategies for implementing our techniques in conjunction with an RDBMS; and we experimentally demonstrate the viability of our techniques in the ORCHESTRA prototype system.

Annotated XML: Queries and Provenance by J. Nathan Foster, Todd J. Green, Val Tannen. (2008)

We present a formal framework for capturing the provenance of data appearing in XQuery views of XML. Building on previous work on relations and their (positive) query languages, we decorate unordered XML with annotations from commutative semirings and show that these annotations suffice for a large positive fragment of XQuery applied to this data. In addition to tracking provenance metadata, the framework can be used to represent and process XML with repetitions, incomplete XML, and probabilistic XML, and provides a basis for enforcing access control policies in security applications.

Each of these applications builds on our semantics for XQuery, which we present in several steps: we generalize the semantics of the Nested Relational Calculus (NRC) to handle semiring-annotated complex values, we extend it with a recursive type and structural recursion operator for trees, and we define a semantics for XQuery on annotated XML by translation into this calculus.

Containment of Conjunctive Queries on Annotated Relations by Todd J. Green. (2009)

We study containment and equivalence of (unions of) conjunctive queries on relations annotated with elements of a commutative semiring. Such relations and the semantics of positive relational queries on them were introduced in a recent paper as a generalization of set semantics, bag semantics, incomplete databases, and databases annotated with various kinds of provenance information. We obtain positive decidability results and complexity characterizations for databases with lineage, why-provenance, and provenance polynomial annotations, for both conjunctive queries and unions of conjunctive queries. At least one of these results is surprising given that provenance polynomial annotations seem “more expressive” than bag semantics and under the latter, containment of unions of conjunctive queries is known to be undecidable. The decision procedures rely on interesting variations on the notion of containment mappings. We also show that for any positive semiring (a very large class) and conjunctive queries without self-joins, equivalence is the same as isomorphism.

Collaborative Data Sharing with Mappings and Provenance by Todd J. Green, dissertation. (2009)

A key challenge in science today involves integrating data from databases managed by different collaborating scientists. In this dissertation, we develop the foundations and applications of collaborative data sharing systems (CDSSs), which address this challenge. A CDSS allows collaborators to define loose confederations of heterogeneous databases, relating them through schema mappings that establish how data should flow from one site to the next. In addition to simply propagating data along the mappings, it is critical to record data provenance (annotations describing where and how data originated) and to support policies allowing scientists to specify whose data they trust, and when. Since a large data sharing confederation is certain to evolve over time, the CDSS must also efficiently handle incremental changes to data, schemas, and mappings.

We focus in this dissertation on the formal foundations of CDSSs, as well as practical issues of its implementation in a prototype CDSS called Orchestra. We propose a novel model of data provenance appropriate for CDSSs, based on a framework of semiring-annotated relations. This framework elegantly generalizes a number of other important database semantics involving annotated relations, including ranked results, prior provenance models, and probabilistic databases. We describe the design and implementation of the Orchestra prototype, which supports update propagation across schema mappings while maintaining data provenance and filtering data according to trust policies. We investigate fundamental questions of query containment and equivalence in the context of provenance information. We use the results of these investigations to develop novel approaches to efficiently propagating changes to data and mappings in a CDSS. Our approaches highlight unexpected connections between the two problems and with the problem of optimizing queries using materialized views. Finally, we show that semiring annotations also make sense for XML and nested relational data, paving the way towards a future extension of CDSS to these richer data models.

Provenance in Collaborative Data Sharing by Grigoris Karvounarakis, dissertation. (2009)

This dissertation focuses on recording, maintaining and exploiting provenance information in Collaborative Data Sharing Systems (CDSS). These are systems that support data sharing across loosely-coupled, heterogeneous collections of relational databases related by declarative schema mappings. A fundamental challenge in a CDSS is to support the capability of update exchange — which publishes a participant’s updates and then translates others’ updates to the participant’s local schema and imports them — while tolerating disagreement between them and recording the provenance of exchanged data, i.e., information about the sources and mappings involved in their propagation. This provenance information can be useful during update exchange, e.g., to evaluate provenance-based trust policies. It can also be exploited after update exchange, to answer a variety of user queries, about the quality, uncertainty or authority of the data, for applications such as trust assessment, ranking for keyword search over databases, or query answering in probabilistic databases.

To address these challenges, in this dissertation we develop a novel model of provenance graphs that is informative enough to satisfy the needs of CDSS users and captures the semantics of query answering on various forms of annotated relations. We extend techniques from data integration, data exchange, incremental view maintenance and view update to define the formal semantics of unidirectional and bidirectional update exchange. We develop algorithms to perform update exchange incrementally while maintaining provenance information. We present strategies for implementing our techniques over an RDBMS and experimentally demonstrate their viability in the ORCHESTRA prototype system. We define ProQL, iv a query language for provenance graphs that can be used by CDSS users to combine data querying with provenance testing as well as to compute annotations for their data, based on their provenance, that are useful for a variety of applications. Finally, we develop a prototype implementation ProQL over an RDBMS and indexing techniques to speed up provenance querying, evaluate experimentally the performance of provenance querying and the benefits of our indexing techniques.

Provenance for Aggregate Queries by Yael Amsterdamer, Daniel Deutch, Val Tannen. (2011)

We study in this paper provenance information for queries with aggregation. Provenance information was studied in the context of various query languages that do not allow for aggregation, and recent work has suggested to capture provenance by annotating the different database tuples with elements of a commutative semiring and propagating the annotations through query evaluation. We show that aggregate queries pose novel challenges rendering this approach inapplicable. Consequently, we propose a new approach, where we annotate with provenance information not just tuples but also the individual values within tuples, using provenance to describe the values computation. We realize this approach in a concrete construction, first for “simple” queries where the aggregation operator is the last one applied, and then for arbitrary (positive) relational algebra queries with aggregation; the latter queries are shown to be more challenging in this context. Finally, we use aggregation to encode queries with difference, and study the semantics obtained for such queries on provenance annotated databases.

Circuits for Datalog Provenance by Daniel Deutch, Tova Milo, Sudeepa Roy, Val Tannen. (2014)

The annotation of the results of database queries with provenance information has many applications. This paper studies provenance for datalog queries. We start by considering provenance representation by (positive) Boolean expressions, as pioneered in the theories of incomplete and probabilistic databases. We show that even for linear datalog programs the representation of provenance using Boolean expressions incurs a super-polynomial size blowup in data complexity. We address this with an approach that is novel in provenance studies, showing that we can construct in PTIME poly-size (data complexity) provenance representations as Boolean circuits. Then we present optimization techniques that embed the construction of circuits into seminaive datalog evaluation, and further reduce the size of the circuits. We also illustrate the usefulness of our approach in multiple application domains such as query evaluation in probabilistic databases, and in deletion propagation. Next, we study the possibility of extending the circuit approach to the more general framework of semiring annotations introduced in earlier work. We show that for a large and useful class of provenance semirings, we can construct in PTIME poly-size circuits that capture the provenance.

Incomplete but a substantial starting point exploring data provenance and its relationship/use with topic map merging.

To get a feel for “data provenance” just prior to the earliest reference here (2007), consider A Survey of Data Provenance Techniques by Yogesh L. Simmhan, Beth Plale, Dennis Gannon, published in 2005.

Data management is growing in complexity as large-scale applications take advantage of the loosely coupled resources brought together by grid middleware and by abundant storage capacity. Metadata describing the data products used in and generated by these applications is essential to disambiguate the data and enable reuse. Data provenance, one kind of metadata, pertains to the derivation history of a data product starting from its original sources.

The provenance of data products generated by complex transformations such as workflows is of considerable value to scientists. From it, one can ascertain the quality of the data based on its ancestral data and derivations, track back sources of errors, allow automated re-enactment of derivations to update a data, and provide attribution of data sources. Provenance is also essential to the business domain where it can be used to drill down to the source of data in a data warehouse, track the creation of intellectual property, and provide an audit trail for regulatory purposes.

In this paper we create a taxonomy of data provenance techniques, and apply the classification to current research efforts in the field. The main aspect of our taxonomy categorizes provenance systems based on why they record provenance, what they describe, how they represent and store provenance, and ways to disseminate it. Our synthesis can help those building scientific and business metadata-management systems to understand existing provenance system designs. The survey culminates with an identification of open research problems in the field.

Another rich source of reading material!
September 5, 2016

Merge 5 Proxies, Take Away 1 Proxy = ? [Data Provenance]

Filed under: Annotation,Data Provenance,Merging,Topic Maps — Patrick Durusau @ 6:45 pm

Provenance for Database Transformations by Val Tannen. (video)

Description:

Database transformations (queries, views, mappings) take apart, filter,and recombine source data in order to populate warehouses, materialize views,and provide inputs to analysis tools. As they do so, applications often need to track the relationship between parts and pieces of the sources and parts and pieces of the transformations’ output. This relationship is what we call database provenance.

This talk presents an approach to database provenance that relies on two observations. First, provenance is a kind of annotation, and we can develop a general approach to annotation propagation that also covers other applications, for example to uncertainty and access control. In fact, provenance turns out to be the most general kind of such annotation,in a precise and practically useful sense. Second, the propagation of annotation through a broad class of transformations relies on just two operations: one when annotations are jointly used and one when they are used alternatively.This leads to annotations forming a specific algebraic structure, a commutative semiring.

The semiring approach works for annotating tuples, field values and attributes in standard relations, in nested relations (complex values), and for annotating nodes in (unordered) XML. It works for transformations expressed in the positive fragment of relational algebra, nested relational calculus, unordered XQuery, as well as for Datalog, GLAV schema mappings, and tgd constraints. Finally, when properly extended to semimodules it works for queries with aggregates. Specific semirings correspond to earlier approaches to provenance, while others correspond to forms of uncertainty, trust, cost, and access control.

What does happen when you subtract from a merge? (Referenced here as an “aggregation.”)

Although possible to paw through logs to puzzle out a result, Val suggests there are more robust methods at our disposal.

I watched this over the weekend and be forewarned, heavy sledding ahead!

This is an active area of research and I have only begun to scratch the surface for references.

I may discover differently, but the “aggregation” I have seen thus far relies on opaque strings.

Not that all uses of opaque strings are inappropriate, but imagine the power of treating a token as an opaque string for one use case and exploding that same token into key/value pairs for another.

Enjoy!

August 30, 2016

The rich are getting more secretive with their money [Calling All Cybercriminals]

Filed under: Government,Politics,Topic Maps — Patrick Durusau @ 4:52 pm

The rich are getting more secretive with their money by Rachael Levy.

From the post:

You might think the Panama Papers leak would cause the ultrarich to seek more transparent tax havens.

Not so, according to Jordan Greenaway, a consultant based in London who caters to the ultrawealthy.

Instead, they are going further underground, seeking walled-up havens such as the Marshall Islands, Lebanon, and Antigua, Greenaway, who works for the PR agency Right Angles, told Business Insider.

The Panama Papers leak around Mossack Fonseca, a law firm that helped politicians and businesspeople hide their money, has increased anxiety among the rich over being exposed, Greenaway told New York reporters in a meeting last week.

“The Panama Papers sent them to the ground,” he said

I should hope so.

The Panama Papers leak, what we know of it (hint, hint to data hoarders), was like giants capturing dwarfs in a sack. It takes some effort but not a lot.

Especially when someone dumps the Panama Papers data in your lap. News organizations have labored to make sense of that massive trove of data but its acquisition wasn’t difficult.

From Rachael’s report, the rich want to up their game on data acquisition. Fair enough.

But 2016 cybersecurity reports leave you agreeing that “sieve” is a generous description of current information security.

Cybercriminals are reluctant to share their exploits, but after exploiting data fully, they should dump their data to public repositories.

That will protect their interests (I didn’t say legitimate) in their exploits and at the same time, enable others to track the secrets of the wealthy, albeit with a time delay.

The IRS and EU tax authorities will both subscribe to RSS feeds for such data.

July 6, 2016

The Iraq Inquiry (Chilcot Report) [4.5x longer than War and Peace]

Filed under: ElasticSearch,Lucene,Search Algorithms,Search Interface,Solr,Topic Maps — Patrick Durusau @ 2:41 pm

The Iraq Inquiry

To give a rough sense of the depth of the Chilcot Report, the executive summary runs 150 pages. The report appears in twelve (12) volumes, not including video testimony, witness transcripts, documentary evidence, contributions and the like.

Cory Doctorow reports a Guardian project to crowd source collecting facts from the 2.6 million word report. The Guardian observes the Chilcot report is “…almost four-and-a-half times as long as War and Peace.”

Manual reading of the Chilcot report is doable, but unlikely to yield all of the connections that exist between participants, witnesses, evidence, etc.

How would you go about making the Chilcot report and its supporting evidence more amenable to navigation and analysis?

The Report

The Evidence

Other Material

Unfortunately, sections within volumes were not numbered according to their volume. In other words, volume 2 starts with section 3.3 and ends with 3.5, whereas volume 4 only contains sections beginning with “4.,” while volume 5 starts with section 5 but also contains sections 6.1 and 6.2. Nothing can be done for it but be aware that section numbers don’t correspond to volume numbers.

June 28, 2016

Functor Fact @FunctorFact [+ Tip for Selling Topic Maps]

Filed under: Category Theory,Functional Programming,Marketing,Topic Maps — Patrick Durusau @ 2:58 pm

JohnDCook has started @FunctorFact, tweets “..about category theory and functional programming.”

John has a page listing his Twitter accounts. It needs to be updated to reflect the addition of @FunctorFact.

BTW, just by accident I’m sure, John’s blog post for today is titled: Category theory and Koine Greek. It has the following lesson for topic map practitioners and theorists:


Another lesson from that workshop, the one I want to focus on here, is that you don’t always need to convey how you arrived at an idea. Specifically, the leader of the workshop said that if you discover something interesting from reading the New Testament in Greek, you can usually present your point persuasively using the text in your audience’s language without appealing to Greek. This isn’t always possible—you may need to explore the meaning of a Greek word or two—but you can use Greek for your personal study without necessarily sharing it publicly. The point isn’t to hide anything, only to consider your audience. In a room full of Greek scholars, bring out the Greek.

This story came up in a recent conversation about category theory. You might discover something via category theory but then share it without discussing category theory. If your audience is well versed in category theory, then go ahead and bring out your categories. But otherwise your audience might be bored or intimidated, as many people would be listening to an argument based on the finer points of Koine Greek grammar. Microsoft’s LINQ software, for example, was inspired by category theory principles, but you’d be hard pressed to find any reference to this because most programmers don’t want to know or need to know where it came from. They just want to know how to use it.

Sure, it is possible to recursively map subject identities in order to arrive at a useful and maintainable mapping between subject domains, but the people with the checkbook are only interested in a viable result.

How you got there could involve enslaved pixies for all they care. They do care about negative publicity so keep your use of pixies to yourself.

Looking forward to tweets from @FunctorFact!

June 9, 2016

Record Linkage (Think Topic Maps) In War Crimes Investigations

Filed under: Record Linkage,Social Sciences,Topic Maps — Patrick Durusau @ 4:28 pm

Machine learning for human rights advocacy: Big benefits, serious consequences by Megan Price.

Megan is the executive director of the Human Rights Data Analysis Group (HRDAG), an organization that applies data science techniques to documenting violence and potential human rights abuses.

I watched the video expecting extended discussion of machine learning, only to find that our old friend, record linkage, was mentioned repeatedly during the presentation. Along with some description of the difficulty of reconciling lists of identified casualties in war zones.

Not to mention the task of estimating casualties that will never appear by any type of reporting.

When Megan mentioned record linkage I was hooked and stayed for the full presentation. If you follow the link to Human Rights Data Analysis Group (HRDAG), you will find a number of publications, concerning the scientific side of their work.

Oh, record linkage is a technique used originally in epidemiology to “merge*” records from different authorities in order to study the transmission of disease. It dates from the late 1950’s and has been actively developed since then.

Including two complete and independent mathematical models, which arose because terminology differences prevented the second one from discovering the first. There’s a topic map example for you!

Certainly an area where the multiple facets (non-topic map sense) of subject identity would come into play. Not to mention making the merging of lists auditable. (They may already have that capability and I am unaware of it.)

It’s an interesting video and the website even more so.

Enjoy!

* One difference between record linkage and topic maps is that the usual record linkage technique maps diverse data into a single representation for processing. That technique loses the semantics associated with the terminology in the original records. Preservation of those semantics may not be your use case, but be aware you are losing data in such a process.

May 23, 2016

Balisage 2016 Program Posted! (Newcomers Welcome!)

Filed under: Conferences,Topic Maps,XML,XML Schema,XPath,XProc,XQuery,XSLT — Patrick Durusau @ 8:03 pm

Tommie Usdin wrote today to say:

Balisage: The Markup Conference
2016 Program Now Available
http://www.balisage.net/2016/Program.html

Balisage: where serious markup practitioners and theoreticians meet every August.

The 2016 program includes papers discussing reducing ambiguity in linked-open-data annotations, the visualization of XSLT execution patterns, automatic recognition of grant- and funding-related information in scientific papers, construction of an interactive interface to assist cybersecurity analysts, rules for graceful extension and customization of standard vocabularies, case studies of agile schema development, a report on XML encoding of subtitles for video, an extension of XPath to file systems, handling soft hyphens in historical texts, an automated validity checker for formatted pages, one no-angle-brackets editing interface for scholars of German family names and another for scholars of Roman legal history, and a survey of non-XML markup such as Markdown.

XML In, Web Out: A one-day Symposium on the sub rosa XML that powers an increasing number of websites will be held on Monday, August 1. http://balisage.net/XML-In-Web-Out/

If you are interested in open information, reusable documents, and vendor and application independence, then you need descriptive markup, and Balisage is the conference you should attend. Balisage brings together document architects, librarians, archivists, computer
scientists, XML practitioners, XSLT and XQuery programmers, implementers of XSLT and XQuery engines and other markup-related software, Topic-Map enthusiasts, semantic-Web evangelists, standards developers, academics, industrial researchers, government and NGO staff, industrial developers, practitioners, consultants, and the world’s greatest concentration of markup theorists. Some participants are busy designing replacements for XML while other still use SGML (and know why they do).

Discussion is open, candid, and unashamedly technical.

Balisage 2016 Program: http://www.balisage.net/2016/Program.html

Symposium Program: http://balisage.net/XML-In-Web-Out/symposiumProgram.html

Even if you don’t eat RELAX grammars at snack time, put Balisage on your conference schedule. Even if a bit scruffy looking, the long time participants like new document/information problems or new ways of looking at old ones. Not to mention they, on occasion, learn something from newcomers as well.

It is a unique opportunity to meet the people who engineered the tools and specs that you use day to day.

Be forewarned that most of them have difficulty agreeing what controversial terms mean, like “document,” but that to one side, they are a good a crew as you are likely to meet.

Enjoy!

Older Posts »

Powered by WordPress