Another Word For It Patrick Durusau on Topic Maps and Semantic Diversity

July 30, 2018

Introducing VizHub

Filed under: D3,SVG,Visualization — Patrick Durusau @ 3:53 pm

Introducing VizHub by Curran Kelleher.

From the post:

I’d like to tell you a bit about VizHub, the next generation of Datavis.tech, a data visualization platform I worked on for about a year, and from which I learned how I wanted to develop VizHub.

VizHub is still early work in progress (alpha software), but the beta release should be ready by September, at which time I plan to use it as the platform for teaching (creating example code) and learning (students doing homework assignments) data visualization with D3.js and SVG in an online course this Fall at @WPI ! Many students are remote and transfer credit from WPI to other universities. If you’re a graduate student in Computer Science anywhere, you can register (see enrollment details). Here’s a taste of what my students made last year.

Difficulties with WordPress accepting images at the moment but here are links to three of the more impressive visualizations from Kelleher’s class:

If your visualization isn’t working, it’s unlikely its the tool. 😉

PS: CS 573 Data Visualization:

This course exposes students to the field of data visualization, i.e., the graphical communication of data and information for the purposes of presentation, confirmation, and exploration. The course introduces the stages of the visualization pipeline. This includes data modeling, mapping data attributes to graphical attributes, visual display techniques, tools, paradigms, and perceptual issues. Students learn to evaluate the effectiveness of visualizations for specific data, task, and user types. Students implement visualization algorithms and undertake projects involving the use of commercial and public-domain visualization tools. Students also read papers from the current visualization literature and do classroom presentations. Prerequisite: a graduate or undergraduate course in computer graphics.
September 17, 2016

Scalable Vector Graphics (SVG) 2

Filed under: Graphics,SVG — Patrick Durusau @ 8:32 pm

Scalable Vector Graphics (SVG) 2: W3C Candidate Recommendation 15 September 2016

Abstract:

This specification defines the features and syntax for Scalable Vector Graphics (SVG) Version 2. SVG is a language based on XML for describing two-dimensional vector and mixed vector/raster graphics. SVG content is stylable, scalable to different display resolutions, and can be viewed stand-alone, mixed with HTML content, or embedded using XML namespaces within other XML languages. SVG also supports dynamic changes; script can be used to create interactive documents, and animations can be performed using declarative animation features or by using script.

Comments:

Comments on this Candidate Recommendation are welcome. Comments can be sent to www-svg@w3.org, the public email list for issues related to vector graphics on the Web. This list is archived and senders must agree to have their message publicly archived from their first posting. To subscribe send an email to www-svg-request@w3.org with the word subscribe in the subject line.

W3C publishes a Candidate Recommendation to indicate that the document is believed to be stable and to encourage implementation by the developer community. This Candidate Recommendation is expected to advance to Proposed Recommendation no earlier than 15 July 2017, but we encourage early review, and requests for normative changes after 15 November 2016 may be deferred to SVG 3.

15 November 2016 will be here sooner than you realize. Read and comment early and often.

Enjoy!

April 26, 2016

SVGs beyond mere shapes

Filed under: D3,SVG,Visualization — Patrick Durusau @ 8:23 am

SVGs beyond mere shapes by Nadieh Bremer

From the post:

I was exhilarated (and honored) to have my talk accepted for OpenVis 2016. Yesterday April 25th, 2016, I was on the stage of the Simons IMAX Theatre in Boston’s New England Aquarium to inspire the audience with some dataviz eye candy. My talk was titled SVGs beyond mere shapes:

SVG can do much more than create nice shapes and paths. In my talk I discuss several techniques and demonstrate how to implement them in D3: from dynamic gradients based on data, to SVG filters, to creating glow, gooey, and fuzzy effects that brighten up any visual.

My eventual goal was to give people a whole bunch of effective or fun examples but to also show them that, even if I focus on a subject as narrow as SVG gradient and filters, if you try to experiment and use things in an unconventional manner you can create some very interesting results. I hope I’ve managed to inspire the audience to show a dedication to the details, to go beyond the norm, so they have to make as few concessions to the computer as possible to recreate the image that they have in their mind.

I’ve received so many wonderful reactions, it was really an amazing experience and well worth the time invested and the nerves I’ve had building up inside of me since hearing I’d been accepted last November 🙂

Are you ready to take SVG beyond shapes?

The start of a series so check back often and/or follow @NadiehBremer.

April 16, 2015

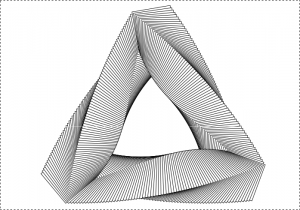
Eye Candy: Spiral Triangle

Filed under: D3,SVG,Visualization — Patrick Durusau @ 5:41 pm

spiral-triangle

Mike Bostock unpacked this impossible gif.

See Spiral Triangle for all its moving glory and code.

February 11, 2014

Scalable Vector Graphics (SVG) 2

Filed under: Graphics,SVG — Patrick Durusau @ 1:46 pm

Scalable Vector Graphics (SVG) 2

Abstract:

This specification defines the features and syntax for Scalable Vector Graphics (SVG) Version 2, a language for describing two-dimensional vector and mixed vector/raster graphics. Although an XML serialization is given, processing is defined in terms of a DOM.

Changes from SVG 1.1 Second Edition.

No time like the present to start learning about the next version of SVG!

Not to mention that your comments may contribute to the style and/or substance of a standard we will all be using sooner than later.

November 23, 2013

Frameless

Filed under: Interface Research/Design,Javascript,SVG,XPath,XSLT — Patrick Durusau @ 2:39 pm

Frameless

From the webpage:

Frameless is an XSLT 2 processor running in the browser, directly written in JavaScript. It includes an XPath 2 query engine for simple, powerful querying. It works cross-browser, we have even reached compatibility with IE6 and Firefox 1.

With Frameless you’ll be able to do things the browsers won’t let you, such as using $variables and adding custom functions to XPath. What’s more, XPath 2 introduces if/else and for-loops. We’ll even let you use some XPath 3 functionality! Combine data into a string using the brand new string concatenation operator.

Use way overdue math functions such as sin() and cos(), essential when generating data-powered SVG graphics. And use Frameless.select() to overcome the boundaries between XSLT and JavaScript.

When to use Frameless?

Frameless is created to simplify application development and is, due to its API, great for writing readable code.

It will make application development a lot easier and it’s a good fit for all CRUD applications and applications with tricky DOM manipulation.

Who will benefit by using it?

  • Designers and managers will be able to read the code and even fix some bugs.
  • Junior developers will get up to speed in no time and write code with a high level of abstraction, and they will be able to create prototypes that’ll be shippable.
  • Senior developers will be able to create complicated webapplications for all browsers and write them declaratively

What it’s not

Frameless doesn’t intend to fully replace functional DOM manipulation libraries like jQuery. If you like you can use such libraries and Frameless at the same time.

Frameless doesn’t provide a solution for cross-browser differences in external CSS stylesheets. We add prefixes to some inline style attributes, but you should not write your styles inline only for this purpose. We do not intend to replace any CSS extension language, such as for example Sass.

Frameless is very sparse on documentation but clearly the potential for browser-based applications is growing.

I first saw this in a tweet by Michael Kay.

April 4, 2013

Visualizing Biological Data Using the SVGmap Browser

Filed under: Biology,Biomedical,Graphics,Mapping,Maps,SVG,Visualization — Patrick Durusau @ 1:26 pm

Visualizing Biological Data Using the SVGmap Browser by Casey Bergman.

From the post:

Early in 2012, Nuria Lopez-Bigas‘ Biomedical Genomics Group published a paper in Bioinformatics describing a very interesting tool for visualizing biological data in a spatial context called SVGmap. The basic idea behind SVGMap is (like most good ideas) quite straightforward – to plot numerical data on a pre-defined image to give biological context to the data in an easy-to-interpret visual form.

To do this, SVGmap takes as input an image in Scalable Vector Graphics (SVG) format where elements of the image are tagged with an identifier, plus a table of numerical data with values assigned to the same identifier as in the elements of the image. SVGMap then integrates these files using either a graphical user interface that runs in standard web browser or a command line interface application that runs in your terminal, allowing the user to display color-coded numerical data on the original image. The overall framework of SVGMap is shown below in an image taken from a post on the Biomedical Genomics Group blog.

svgmap image

We’ve been using SVGMap over the last year to visualize tissue-specific gene expression data in Drosophila melanogaster from the FlyAtlas project, which comes as one of the pre-configured “experiments” in the SVGMap web application.

More recently, we’ve been also using the source distribution of SVGMap to display information about the insertion preferences of transposable elements in a tissue-specific context, which as required installing and configuring a local instance of SVGMap and run it via the browser. The documentation for SVGMap is good enough to do this on your own, but it took a while for us to get a working instance the first time around. We ran into the same issues again the second time, so I thought I write up my notes for future reference and to help others get SVGMap up and running as fast as possible.

Topic map interfaces aren’t required to take a particular form.

A drawing of a fly could be topic map interface.

Useful for people studying flies, less useful (maybe) if you are mapping Lady Gaga discography.

What interface do you want to create for a topic map?

December 12, 2012

d3js/SVG Export demo

Filed under: D3,Graphics,SVG,Visualization — Patrick Durusau @ 8:20 pm

d3js/SVG Export demo

From the post:

d3js is a JavaScript library for manipulating documents based on data. The library enables stunning client-side visualization inside the webbrowser.

Commonly in science-related websites (and possibly many others), users need to save the generated visualization in vectorized format (e.g. PDF), to be able to incorporate the graphics in presentation or publications.

This website demonstate one possible method of saving d3js graphics to PDF.

See below for more technical details.

I can’t imagine anyone wanting a static image of a topic map but you never know. 😉

I first saw this in a tweet by Christophe Viau.

July 4, 2012

JQVMap

Filed under: JQuery,Mapping,Maps,SVG — Patrick Durusau @ 7:35 pm

JQVMap

From the post:

JQVMap is a jQuery plugin that renders Vector Maps. It uses resizable Scalable Vector Graphics (SVG) for modern browsers like Firefox, Safari, Chrome, Opera and Internet Explorer 9. Legacy support for older versions of Internet Explorer 6-8 is provided via VML.

I saw this at Pete Warden’s Five Links, along with the Plane Networks.

Powered by WordPress