Another Word For It Patrick Durusau on Topic Maps and Semantic Diversity

March 31, 2013

Map Projection Transitions

Filed under: Mapping,Maps — Patrick Durusau @ 2:31 pm

Map Projection Transitions by Jason Davies.

A delightful world map that transitions between projections.

How many projections you ask?

  1. Aitoff
  2. August
  3. Baker
  4. Boggs
  5. Bromley
  6. Collignon
  7. Craster Parabolic
  8. Eckert I
  9. Eckert II
  10. Eckert III
  11. Eckert IV
  12. Eckert V
  13. Eckert VI
  14. Eisenlohr
  15. Equirectangular (Plate Carrée)
  16. Hammer
  17. Goode Homolosine
  18. Kavrayskiy VII
  19. Lambert cylindrical equal-area
  20. Lagrange
  21. Larrivée
  22. Laskowski
  23. Loximuthal
  24. Mercator
  25. Miller
  26. McBryde–Thomas Flat-Polar Parabolic
  27. McBryde–Thomas Flat-Polar Quartic
  28. McBryde–Thomas Flat-Polar Sinusoidal
  29. Mollweide
  30. Natural Earth
  31. Nell–Hammer
  32. Polyconic
  33. Robinson
  34. Sinusoidal
  35. Sinu-Mollweide
  36. van der Grinten
  37. van der Grinten IV
  38. Wagner IV
  39. Wagner VI
  40. Wagner VII
  41. Winkel Tripel

Far more than I would have guessed. And I suspect this listing isn’t complete.

By analogy, how would you construct a semantic projection for a topic map?

Varying by language or names of subjects would be one projection.

What about projecting entire semantic views?

Rather than displaying Cyprus from an EU view, why not display the Cyprus view as the frame of reference?

Or display the sovereignty of nations, where their borders are subject to violation at the whim and caprice of larger nations.

Or closer to home, projecting the views of departments in an enterprise.

You may be surprised at the departments that consider themselves the glue holding the operation together.

FrameNet

Filed under: Frames,Semantics — Patrick Durusau @ 2:08 pm

FrameNet

From the about page:

The FrameNet project is building a lexical database of English that is both human- and machine-readable, based on annotating examples of how words are used in actual texts. From the student’s point of view, it is a dictionary of more than 10,000 word senses, most of them with annotated examples that show the meaning and usage. For the researcher in Natural Language Processing, the more than 170,000 manually annotated sentences provide a unique training dataset for semantic role labeling, used in applications such as information extraction, machine translation, event recognition, sentiment analysis, etc. For students and teachers of linguistics it serves as a valence dictionary, with uniquely detailed evidence for the combinatorial properties of a core set of the English vocabulary. The project has been in operation at the International Computer Science Institute in Berkeley since 1997, supported primarily by the National Science Foundation, and the data is freely available for download; it has been downloaded and used by researchers around the world for a wide variety of purposes (See FrameNet users).

FrameNet is based on a theory of meaning called Frame Semantics, deriving from the work of Charles J. Fillmore and colleagues (Fillmore 1976, 1977, 1982, 1985, Fillmore and Baker 2001, 2010). The basic idea is straightforward: that the meanings of most words can best be understood on the basis of a semantic frame: a description of a type of event, relation, or entity and the participants in it. For example, the concept of cooking typically involves a person doing the cooking (Cook), the food that is to be cooked (Food), something to hold the food while cooking (Container) and a source of heat (Heating_instrument). In the FrameNet project, this is represented as a frame called Apply_heat, and the Cook, Food, Heating_instrument and Container are called frame elements (FEs) . Words that evoke this frame, such as fry, bake, boil, and broil, are called lexical units (LUs) of the Apply_heat frame. Other frames are more complex, such as Revenge, which involves more FEs (Offender, Injury, Injured_Party, Avenger, and Punishment) and others are simpler, such as Placing, with only an Agent (or Cause), a thing that is placed (called a Theme) and the location in which it is placed (Goal). The job of FrameNet is to define the frames and to annotate sentences to show how the FEs fit syntactically around the word that evokes the frame, as in the following examples of Apply_heat and Revenge:

At least for English based topic maps, possibly a rich source for roles in association and even templates for associations.

To say nothing of using associations (frames) as scopes.

Recalling that the frames themselves do not stand outside of semantics but have semantics of their own.

Suggestions of similar resources in other languages?

Embedding Pubmed, Graphviz and a remote image in #LaTeX

Filed under: Graphs,Networks,TeX/LaTeX — Patrick Durusau @ 1:08 pm

Embedding Pubmed, Graphviz and a remote image in #LaTeX by Pierre Lindenbaum.

Pierre demonstrates how to use:

\newcommand{name}[num]{definition}

to load a remote picture, a graphviz result and retrieving a PubMed record for embedding in a LaTeX document.

From the LaTeX Macro page Pierre cites:

The num argument in square brackets is optional and specifies the number of arguments the new command takes (up to 9 are possible). If missing it defaults to 0, i.e. no argument allowed.

I caught myself wondering about that argument.

The graphviz command looks particularly interesting for topic map illustrations.

Semantics for Big Data [W3C late to semantic heterogeneity party]

Filed under: BigData,Conferences,Heterogeneous Data,Semantics — Patrick Durusau @ 12:50 pm

Semantics for Big Data

Dates:

Submission due: May 24, 2013

Acceptance Notification: June 21, 2013

Camera-ready Copies: June 28, 2013

Symposium: November 15-17, 2013

From the webpage:

AAAI 2013 Fall Symposium; Westin Arlington Gateway in Arlington, Virginia, November 15-17, 2013.

Workshop Description and Scope

One of the key challenges in making use of Big Data lies in finding ways of dealing with heterogeneity, diversity, and complexity of the data, while its volume and velocity forbid solutions available for smaller datasets as based, e.g., on manual curation or manual integration of data. Semantic Web Technologies are meant to deal with these issues, and indeed since the advent of Linked Data a few years ago, they have become central to mainstream Semantic Web research and development. We can easily understand Linked Data as being a part of the greater Big Data landscape, as many of the challenges are the same. The linking component of Linked Data, however, puts an additional focus on the integration and conflation of data across multiple sources.

Workshop Topics

In this symposium, we will explore the many opportunities and challenges arising from transferring and adapting Semantic Web Technologies to the Big Data quest. Topics of interest focus explicitly on the interplay of Semantics and Big Data, and include:

  • the use of semantic metadata and ontologies for Big Data,
  • the use of formal and informal semantics,
  • the integration and interplay of deductive (semantic) and statistical methods,
  • methods to establish semantic interoperability between data sources
  • ways of dealing with semantic heterogeneity,
  • scalability of Semantic Web methods and tools, and
  • semantic approaches to the explication of requirements from eScience applications.

The W3C is late to the party as evidenced by semantic heterogeneity becoming “…central to mainstream Semantic Web research and development” after the advent of Linked Data.

I suppose better late than never.

At least if they remember that:

Users experience semantic heterogeneity in data and in the means used to describe and store data.

Whatever solution is crafted, its starting premise must be to capture semantics as seen by some defined user.

Otherwise, it is capturing the semantics of designers, authors, etc., which may or may not be valuable to some particular user.

RDF is a good example of capturing someone else’s semantics.

As its uptake is evidence of the interest in someone else’s semantics. (Simple Web Semantics – The Semantic Web Is Failing — But Why?)

Opening Standards: The Global Politics of Interoperability

Filed under: Data Silos,Interoperability,Silos,Standards — Patrick Durusau @ 10:26 am

Opening Standards: The Global Politics of Interoperability Edited by Laura DeNardis.

Overview:

Openness is not a given on the Internet. Technical standards–the underlying architecture that enables interoperability among hardware and software from different manufacturers–increasingly control individual freedom and the pace of innovation in technology markets. Heated battles rage over the very definition of “openness” and what constitutes an open standard in information and communication technologies. In Opening Standards, experts from industry, academia, and public policy explore just what is at stake in these controversies, considering both economic and political implications of open standards. The book examines the effect of open standards on innovation, on the relationship between interoperability and public policy (and if government has a responsibility to promote open standards), and on intellectual property rights in standardization–an issue at the heart of current global controversies. Finally, Opening Standards recommends a framework for defining openness in twenty-first-century information infrastructures.

Contributors discuss such topics as how to reflect the public interest in the private standards-setting process; why open standards have a beneficial effect on competition and Internet freedom; the effects of intellectual property rights on standards openness; and how to define standard, open standard, and software interoperability.

If you think “open standards” have impact, what would you say about “open data?”

At a macro level, “open data” has many of the same issues as “open standards.”

At a micro level, “open data” has unique social issues that drive the creation of silos for data.

So far as I know, a serious investigation of the social dynamics of data silos has yet to be written.

Understanding the dynamics of data silos might, no guarantees, lead to better strategies for dismantling them.

Suggestions for research/reading on the social dynamics of data silos?

Delta-flora for IntelliJ

Filed under: Graphs,Versioning — Patrick Durusau @ 9:54 am

Delta-flora for IntelliJ

From the webpage:

What is this?

This is a plugin for IntelliJ to analyze project source code history. It has two parts:

  • transforming VCS history into .csv format (csv because it’s easy to read and analyze afterwards)
  • analyzing history and displaying results using d3.js (requires a browser). This is currently done in a separate Groovy script.

Originally inspired by Delta Flora by Michael Feathers. It has now diverged into something a bit different.

WARNING: this is work-in-progress.

Why?

There seems to be a lot of interesting data captured in version control systems, yet we don’t tend to use it that much. This is an attempt to make looking at project history easier.

Interesting for visualization of project version control but I mention it as relevant to data versioning.

What if in addition to being in narrative prose, “facts,” such as claims about “yellow cake” uranium, were tracked by data versioning?

So that each confirmation or uncertainty is liked to a particular fact. Who confirmed? Who questioned?

There is a lot of data but limiting to to narrative structures means reduced access to track, re-structure and re-purpose that data.

A step in the right direction would be to produce both narrative and more granular forms of the same data.

Are there lessons we can draw from project source control?

InfiniteGraph Tutorial: Getting Started With Flight Plan

Filed under: Graphs,InfiniteGraph — Patrick Durusau @ 9:38 am

InfiniteGraph Tutorial: Getting Started With Flight Plan

From the post:

Now that you have downloaded Objectivity’s free version of InfiniteGraph, get started with this step by step tutorial using the Flight Plan application to find the fastest and most cost-effective air travel routes available, one of many free applications provided on our InfiniteGraph Developer Wiki site. Download your free version of InfiniteGraph by visiting http://www.Objectivity.com and follow us on Twitter for the latest updates @InfiniteGraph and get started on building your next generation application today!

The video tutorial illustrates the use of InfiniteGraph but isn’t very accurate in terms of air travel.

I say that because Atlanta was not show as a node on the graph.

“To get to Hell you have to connect through Atlanta.” 😉

Amazon S3 clone open-sourced by Riak devs [Cloud of Tomorrow?]

Filed under: Cloud Computing,Riak CS — Patrick Durusau @ 9:20 am

Amazon S3 clone open-sourced by Riak devs by Elliot Bentley.

From the post:

The developers of NoSQL database Riak have open-sourced their new project, an Amazon S3 clone called Riak CS.

In development for a year, Riak CS provides highly-available, fault-tolerant storage able to manage files as large as 5GB, with an API and authentication system compatible with Amazon S3. In addition, today’s open-source release introduces multipart upload and a new web-based admin tool.

Riak CS is built on top of Basho’s flagship product Riak, a decentralised key/value store NoSQL database. Riak was also based on an existing Amazon creation – in this case, Dynamo, which also served as the inspiration for Apache Cassandra.

In December’s issue of JAX Magazine, Basho EMEA boss Matt Heitzenroder (who has since left the company) explained that Riak CS was initially conceived as an exercise in “dogfooding” their own database product. “It was a goal of engineers to gain insight into use cases themselves and also to have something we can go out there and sell,” he said.

See also: The Riak CS Fast Track.

You may have noticed that files stored on/in (?) clouds are just like files on your local hard drive.

They can be copied, downloaded, pipelined, subjected to ETL, processed and transferred.

The cloud of your choice provides access to greater computing power and storage than before, but that’s a different of degree, not in kind.

A difference in kind would be the ability to find and re-use data based upon its semantics and not on happenstance of file or field names.

Riak CS isn’t that cloud today but in the competition to be the cloud of tomorrow, who knows?

Data accounts for up to 75 percent of value in half of businesses

Filed under: BigData,Hadoop — Patrick Durusau @ 9:05 am

Data accounts for up to 75 percent of value in half of businesses

From the post:

As the volume of data stored in the enterprise continues to grow, organizations see this information as representing a substantial portion of their assets. With tools such as Hadoop for Windows, businesses are unlocking the value of this data, Anthony Saxby, Microsoft U.K.’s data platform product marketing manager, said in a recent talk at Computing’s Big Data Summit 2013. According to Microsoft’s research, half of all organizations think their data represents 50 to 75 percent of their total value.

The challenge in unlocking this value is technology, Saxby said, according to Computing. Much of this information is internally siloed or separated from the external data sources that it could be combined with to create more effective, monetized results. Today’s businesses want to bring together unstructured and structured data to create new insights. With tools such as Hadoop, this type of analysis is increasingly possible. For instance, record label EMI uses a variety of data types across 25 countries to determine how to market music artists in different geographies.

The headline reminded me of Bilbo Baggins:

I don’t know half of you half as well as I should like; and I like less than half of you half as well as you deserve.

As the narrator notes:

This was unexpected and rather difficult.

I don’t follow the WSJ as closely as some but what of inventories, brick and mortar assets, accounts receivable, employees, IP, etc.?

Not that I doubt the value of data.

I do doubt the ability of businesses that manage by catch phrases like “big data,” “silos,” “unstructured and structured data,” Hadoop,” to realize its value.

Hadoop will figure in successful projects to “unlock data,” but only where it is used as a tool and not a magic bullet.

A clear understanding of data and its sources, how to measure ROI from its use, are only two of the keys to successful use of any data tool.

Pilling up data freed from internal silos upon data from external sources results in a big heap of data.

Impressive to the uninformed but it won’t increase your bottom line.

The new analytic stack…

Filed under: Analytics,Transparency — Patrick Durusau @ 5:00 am

The new analytic stack is all about management, transparency and users by George Mathew.

On transparency:

Predictive analytics are essential for data-driven leaders to craft their next best decision. There are a variety of techniques across the predictive and statistical spectrums that help businesses better understand the not too distant future. Today’s biggest challenge for predictive analytics is that it is delivered in a very black-box fashion. As business leaders rely more on predictive techniques to make great data-driven decisions, there needs to be much more of a clear-box approach.

Analytics need to be packaged with self-description of data lineage, derivation of how calculations were made and an explanation of the underlying math behind any embedded algorithms. This is where I think analytics need to shift in the coming years; quickly moving away from black-box capabilities, while deliberately putting decision makers back in the driver’s seat. That’s not just about analytic output, but how it was designed, its underlying fidelity and its inherent lineage — so that trusting in analytics isn’t an act of faith.

Now there’s an opportunity for topic maps.

Data lineage, derivations, math, etc. all have their own “logics” and the “logic” of how they are assembled for a particular use.

Could debate how to formalize those logics and might eventually reach agreement years after the need has passed.

Or, you could use a topic map to declare the subjects and relationships important for your analytics today.

And merge them with the logics you devise for tomorrows analytics.

March 30, 2013

Parallel and Concurrent Programming in Haskell

Filed under: Concurrent Programming,Haskell,Parallel Programming — Patrick Durusau @ 6:48 pm

Parallel and Concurrent Programming in Haskell by Simon Marlow.

From the introduction:

While most programming languages nowadays provide some form of concurrent or parallel programming facilities, very few provide as wide a range as Haskell. Haskell prides itself on having the right tool for the job, for as many jobs as possible. If a job is discovered for which there isn’t already a good tool, Haskell’s typical response is to invent a new tool. Haskell’s abstraction facilities provide a fertile ground on which to experiment with different programming idioms, and that is exactly what has happened in the space of concurrent and parallel programming.

Is this a good or a bad thing? You certainly can get away with just one way of writing concurrent programs: threads and locks are in principle all you need. But as the programming community has begun to realise over the last few years, threads and locks are not the right tool for most jobs. Programming with them requires a high degree of expertise even for simple tasks, and leads to programs that have hard-to-diagnose faults.

So in Haskell we embrace the idea that different problems require different tools, and we provide the programmer with a rich selection to choose from. The inevitable downside is that there is a lot to learn, and that is what this book is all about.

In this book I will discuss how to write parallel and concurrent programs in Haskell, ranging from the simple uses of parallelism to speed up computation-heavy programs, to the use of lightweight threads for writing high-speed concurrent network servers. Along the way we’ll see how to use Haskell to write programs that run on the powerful processor in a modern graphics card (GPU), and to write programs that can run on multiple machines in a network (distributed programming).

In O’Reilly’s Open Feedback Publishing System.

If you really want to learn something, write a book about it, edit a book about it or teach a class about it.

Here’s your chance for #2.

Read carefully!

I first saw this in Christophe Lalanne’s A bag of tweets / March 2013.

Using R For Statistical Analysis – Two Useful Videos

Filed under: Data Mining,R,Statistics — Patrick Durusau @ 6:29 pm

Using R For Statistical Analysis – Two Useful Videos by Bruce Berriman.

Bruce has uncovered two interesting videos on using R:

Introduction to R – A Brief Tutorial for R (Software for Statistical Analysis), and,

An Introduction to R for Data Mining by Joseph Rickert. (Recording of the webinar by the same name.)

Bruce has additional links that will be useful with the videos.

Enjoy!

ElasticSearch: Text analysis for content enrichment

Filed under: ElasticSearch,Indexing,Search Engines,Searching — Patrick Durusau @ 6:15 pm

ElasticSearch: Text analysis for content enrichment by Jaibeer Malik.

From the post:

Taking an example of a typical eCommerce site, serving the right content in search to the end customer is very important for the business. The text analysis strategy provided by any search solution plays very big role in it. As a search user, I would prefer some of typical search behavior for my query to automatically return,

  • should look for synonyms matching my query text
  • should match singluar and plural words or words sounding similar to enter query text
  • should not allow searching on protected words
  • should allow search for words mixed with numberic or special characters
  • should not allow search on html tags
  • should allow search text based on proximity of the letters and number of matching letters

Enriching the content here would be to add above search capabilities to you content while indexing and searching for the content.

I thought the “…look for synonyms matching my query text…” might get your attention. 😉

Not quite a topic map because there isn’t any curation of the search results, saving the next searcher time and effort.

But in order to create and maintain a topic map, you are going to need expansion of your queries by synonyms.

You will take the results of those expanded queries and fashion them into a topic map.

Think of it this way:

Machines can rapidly harvest, even sort content at your direction.

What they can’t do is curate the results of their harvesting.

That requires a secret ingredient.

That would be you.

I first saw this at DZone.

Probabilistic Programming and Bayesian Methods for Hackers

Probabilistic Programming and Bayesian Methods for Hackers

From the webpage:

Bayesian method is the natural approach to inference, yet it is hidden from readers behind chapters of slow, mathematical analysis. The typical text on Bayesian inference involves two to three chapters on probability theory, then enters what Bayesian inference is. Unfortunately, due to mathematical intractability of most Bayesian models, the reader is only shown simple, artificial examples. This can leave the user with a so-what feeling about Bayesian inference. In fact, this was the author’s own prior opinion.

After some recent success of Bayesian methods in machine-learning competitions, I decided to investigate the subject again. Even with my mathematical background, it took me three straight-days of reading examples and trying to put the pieces together to understand the methods. There was simplely not enough literature bridging theory to practice. The problem with my misunderstanding was the disconnect between Bayesian mathematics and probabilistic programming. That being said, I suffered then so the reader would not have to now. This book attempts to bridge the gap.

DARPA (Logic and Probabilistic Programming) should be glad that someone else is working on probabilistic programming.

I first saw this at Nat Torkington’s Four short links: 29 March 2103.

2012 IPAM Graduate Summer School: Deep Learning, Feature Learning

Filed under: Deep Learning,Feature Learning,Machine Learning — Patrick Durusau @ 2:43 pm

2012 IPAM Graduate Summer School: Deep Learning, Feature Learning

OK, so they skipped the weekends!

Still have fifteen (15) days of video.

So if you don’t have a date for movie night…., 😉

Permission Resolution with Neo4j – Part 1

Filed under: Cybersecurity,Graphs,Neo4j,Networks,Security — Patrick Durusau @ 2:17 pm

Permission Resolution with Neo4j – Part 1 by Max De Marzi.

From the post:

People produce a lot of content. Messages, text files, spreadsheets, presentations, reports, financials, etc, the list goes on. Usually organizations want to have a repository of all this content centralized somewhere (just in case a laptop breaks, gets lost or stolen for example). This leads to some kind of grouping and permission structure. You don’t want employees seeing each other’s HR records, unless they work for HR, same for Payroll, or unreleased quarterly numbers, etc. As this data grows it no longer becomes easy to simply navigate and a search engine is required to make sense of it all.

But what if your search engine returns 1000 results for a query and the user doing the search is supposed to only have access to see 4 things? How do you handle this? Check the user permissions on each file realtime? Slow. Pre-calculate all document permissions for a user on login? Slow and what if new documents are created or permissions change between logins? Does the system scale at 1M documents, 10M documents, 100M documents?

Search is one example of a need to restrict viewing results but browsing raises the same issues. Or display of information along side other information.

As I recall, Netware 4.1 (other versions as well no doubt) had the capability for a sysadmin to create sub-sysadmins, say for accounting or HR, that could hide information from the sysadmin. That was prior to search being commonly available.

What other security for search result schemes are out there?

gvSIG

gvSIG

I encountered the gvSIG site while tracking down the latest release of i3Geo.

From its mission statement:

The gvSIG project was born in 2004 within a project that consisted in a full migration of the information technology systems of the Regional Ministry of Infrastructure and Transport of Valencia (Spain), henceforth CIT, to free software. Initially, It was born with some objectives according to CIT needs. These objectives were expanded rapidly because of two reasons principally: on the one hand, the nature of free software, which greatly enables the expansion of technology, knowledge, and lays down the bases on which to establish a community, and, on the other hand, a project vision embodied in some guidelines and a plan appropriate to implement it.

Some of the software projects you will find at gvSIG are:

gvSIG Desktop

gvSIG is a Geographic Information System (GIS), that is, a desktop application designed for capturing, storing, handling, analyzing and deploying any kind of referenced geographic information in order to solve complex management and planning problems. gvSIG is known for having a user-friendly interface, being able to access the most common formats, both vector and raster ones. It features a wide range of tools for working with geographic-like information (query tools, layout creation, geoprocessing, networks, etc.), which turns gvSIG into the ideal tool for users working in the land realm.

gvSIG Mobile

gvSIG Mobile is a Geographic Information System (GIS) aimed at mobile devices, ideal for projects that capture and update data in the field. It’s known for having a user-friendly interface, being able to access the most common formats and a wide range of GIS and GPS tools which are ideal for working with geographic information.

gvSIG Mobile aims at broadening gvSIG Desktop execution platforms to a range of mobile devices, in order to give an answer to the needings of a growing number of mobile solutions users, who wish to use a GIS on different types of devices.

So far, gvSIG Mobile is a Geographic Information System, as well as a Spatial Data Infrastructures client for mobile devices. Such a client is also the first one licensed under open source.

I3Geo

i3Geo is an application for the development of interactive web maps. It integrates several open source applications into a single development platform, mainly Mapserver and OpenLayers. Developed in PHP and Javascript, it has functionalities that allows the user to have better control over the map output, allowing to modify the legend of layers, to apply filters, to perform analysis, etc.

i3Geo is completely customizable and can be tailor to the different users using the interactive map. Furthermore, the spatial data is organized in a catalogue that offers online access services such as WMS, WFS, KML or the download of files.

i3Geo was developed by the Ministry of the Environment of Brazil and it is actually part of the Brazilian Public Software Portal.

gvSIG Educa

What is gvSIG Educa?

“If I can’t picture it, I can’t understand it (A. Einstein)”

gvSIG Educa is a customization of the gvSIG Desktop Open Source GIS, adapted as a tool for the education of issues that have a geographic component.

The aim of gvSIG Educa is to provide educators with a tool that helps students to analyse and understand space, and which can be adapted to different levels or education systems.

gvSIG Educa is not only useful for the teaching of geographic material, but can also be used for learning any subject that contains a spatial component such as history, economics, natural science, sociology…

gvSIG Educa facilitates learning by letting students interact with the information, by adding a spatial component to the study of the material, and by facilitating the assimilation of concepts through visual tools such as thematic maps.

gvSIG Educa provides analysis tools that help to understand spatial relationships.

Definitely a site to visit if you are interested in open source GIS software and/or projects.

i3Geo

Filed under: Geographic Data,Geographic Information Retrieval,Geography,GIS,Mapping,Maps — Patrick Durusau @ 1:08 pm

i3Geo

From the homepage:

i3Geo is an application for the development of interactive web maps. It integrates several open source applications into a single development platform, mainly Mapserver and OpenLayers. Developed in PHP and Javascript, it has functionalities that allows the user to have better control over the map output, allowing to modify the legend of layers, to apply filters, to perform analysis, etc.

i3Geo is completely customizable and can be tailor to the different users using the interactive map. Furthermore, the spatial data is organized in a catalogue that offers online access services such as WMS, WFS, KML or the download of files.

i3Geo was developed by the Ministry of the Environment of Brazil and it is actually part of the Brazilian Public Software Portal.

I followed an announcement about i3Geo 4.7 being available when the line “…an application for the development of interactive web maps,” caught my eye.

Features include:

  • Basic display: fix zoom, zoom by rectangle, panning, etc.
  • Advanced display: locator by attribute, zoom to point, zoom by geographical area, zoom by selection, zoom to layer
  • Integrated display: Wikipedia, GoogleMaps, Panoramio and Confluence
  • Integration with the OpenLayers, GoogleMaps and GoogleEarth APIs
  • Loading of WMS, KML, GeoRSS, shapefile, GPX and CSV layers
  • Management of independent databases
  • Layer catalog management system
  • Management of layers in maps: Change of the layers order, opacity change, title change, filters, thematic classification, legend and symbology changing
  • Analysis tools: buffers, regular grids, points distribution analysis, layer intersection, centroid calculation, etc.
  • Digitalization: vector editing that allows to create new geometries or edit xisting data.
  • Superposition of existing data at the data of the Google Maps and GoogleEarth catalogs.

Unless you want to re-invent mapping software, this could be quite useful for location relevant topic map data.

I first saw this at New final version of i3Geo available: i3Geo 4.7.

HCIR [Human-Computer Information Retrieval] site gets publication page

Filed under: Information Retrieval,Interface Research/Design,Searching — Patrick Durusau @ 12:51 pm

HCIR site gets publication page by Gene Golovchinsky.

From the post:

Over the past six years of the HCIR series of meetings, we’ve accumulated a number of publications. We’ve had a series of reports about the meetings, papers published in the ACM Digital Library, and an up-coming Special Issue of IP&M. In the run-up to this year’s event (stay tuned!), I decided it might be useful to consolidate these publications in one place. Hence, we now have the HCIR Publications page.

Human-Computer Information Retrieval (HCIR) if the lingo is unfamiliar.

Will ease access to a great set of papers, at least in one respect.

One small improvement:

Do no rely upon the ACM Digital Library as the sole repository for these papers.

Access isn’t an issue for me but I suspect it may be for a number of others.

Hiding information behind a paywall diminishes its impact.

When Presenting Your Data…

Filed under: Communication,Graphics,Presentation,Visualization — Patrick Durusau @ 10:46 am

When Presenting Your Data, Get to the Point Fast by Nancy Duarte.

From the post:

Projecting your data on slides puts you at an immediate disadvantage: When you’re giving a presentation, people can’t pull the numbers in for a closer look or take as much time to examine them as they can with a report or a white paper. That’s why you need to direct their attention. What do you want people to get from your data? What’s the message you want them to take away?

Data slides aren’t really about the data. They’re about the meaning of the data. And it’s up to you to make that meaning clear before you click away. Otherwise, the audience won’t process — let alone buy — your argument.

Nancy starts off with a fairly detailed table full of numbers, that is less complex than some topic map diagrams I have seen. 😉

Moves onto the infamous pie chart* and then to a bar chart.

The lesson being to present information in a way it can be immediately comprehended by your audience.

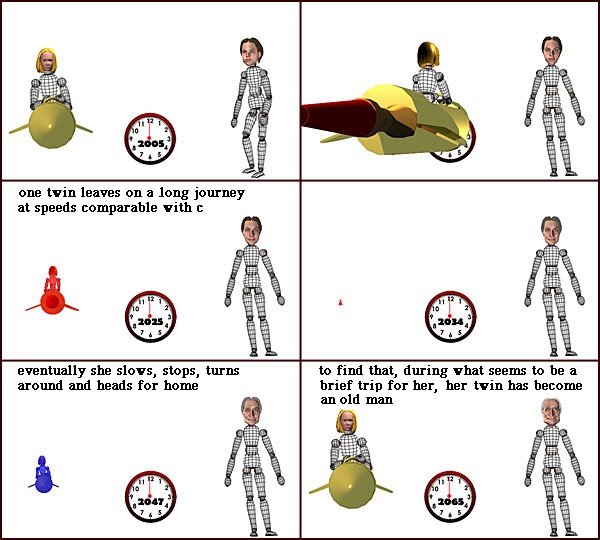
Here’s a non-topic map illustration, explaining time dilation:

Time Dilation

Here’s another explanation of time dilation:

Time Dilation

Both “explain” time dilation but one to c-suite types and the other to techies.

Problem: C-suite types control the purse strings.

Question: What issues do c-suite types see that topic maps can address?


*Leland Wilkinson in The Grammar of Graphics, 2nd ed., writes of pie charts:

A pie chart is perhaps the most ubiquitous of modern graphics. It has been reviled by statisticians (unjustifiably) and adored by managers (unjustifiably).

So far (I am at chapter 3), Wilkinson doesn’t elaborate on his response to criticisms of pie charts by statisticians.

Not important for this discussion but one of those tidbits that livens up a classroom discussion.

I first saw this in a tweet by Gregory Piatetsky.

March 29, 2013

Writing Effective Requirement Documents – An Overview

Filed under: Design,Interface Research/Design,Requirements,Use Cases — Patrick Durusau @ 5:08 pm

Writing Effective Requirement Documents – An Overview

From the post:

In every UX Design project, the most important part is the requirements gathering process. This is an overview of some of the possible methods of requirements gathering.

Good design will take into consideration all business, user and functional requirements and even sometimes inform new functionality & generate new requirements, based on user comments and feedback. Without watertight requirements specification to work from, much of the design is left to assumptions and subjectivity. Requirements put a project on track & provide a basis for the design. A robust design always ties back to its requirements at every step of the design process.

Although there are many ways to translate project requirements, Use cases, User Stories and Scenarios are the most frequently used methods to capture them. Some elaborate projects may have a comprehensive Business Requirements Document (BRD), which forms the absolute basis for all deliverables for that project.

I will get a bit deeper into what each of this is and in which context each one is used…

Requirements are useful for any project. Especially useful for software projects. But critical for a successful topic map project.

Topic maps can represent or omit any subject of conversation, any relationship between subjects or any other information about a subject.

Not a good practice to assume others will make the same assumptions as you about the subjects to include or what information to include about them.

They might and they might not.

For any topic maps project, insist on a requirements document.

A good requirements document results in accountability for both sides.

The client for specifying what was desired and being responsible for changes and their impacts. The topic map author for delivering on the terms and detail specified in the requirements document.

Countering Weapons of Mass Destruction

Filed under: Funding,Military,Security — Patrick Durusau @ 4:40 pm

The Project on Advanced Systems and Concepts for Countering Weapons of Mass Destruction (PASCC) at the Naval Postgraduate School

From opportunity:

This BAA’s primary objective is to attract outstanding researchers and scholars who will research topics of interest to the security studies community. Research will focus on expanding knowledge related to countering weapons of mass destruction and weapons of mass effect (WMD/WME). The program solicits innovative proposals for research on WMD/WME counter proliferation, nonproliferation, and strategy to be conducted mainly during the January 2014 through September 2015 timeframe. In this BAA, the phrase “security studies research” refers to research in all disciplines, fields, and domains that (1) are involved in expanding knowledge for national defense, and (2) could potentially improve policy and international relations for combating WMD. Disciplines include, but are not limited to: Political science, sociology, history, biology, chemistry, economics, homeland defense, and public policy.

Applications don’t close until March 31, 2014 but there isn’t any reason to wait until the last minute to apply. 😉

Don’t know but information sharing across agencies could be an issue, along with other areas where topic maps would really shine.


BTW, some representative research from this program.

Logic and Probabilistic Programming

Filed under: Logic,Probabilistic Programming — Patrick Durusau @ 4:28 pm

Programming Trends to Watch: Logic and Probabilistic Programming by Dean Wampler.

From the post:

I believe there are two other emerging trends in programming worth watching that will impact the data world.

Logic Programming, like FP, is actually not new at all, but it is seeing a resurgence of interest, especially in the Clojure community. Rules engines, like Drools, are an example category of logic programming that has been in use for a long time.

We’re on the verge of moving to the next level, probabilistic programming languages and systems that make it easier to build probabilistic models, where the modeling concepts are promoted to first-class primitives in new languages, with underlying runtimes that do the hard work of inferring answers, similar to the way that logic programming languages work already. The ultimate goal is to enable end users with limited programming skills, like domain experts, to build effective probabilistic models, without requiring the assistance of Ph.D.-level machine learning experts, much the way that SQL is widely used today.

DARPA, the research arm of the U.S. Department of Defense, considers this trend important enough that they are starting an initiative to promote it, called Probabilistic Programming for Advanced Machine Learning, which is also described in this Wired article.

Registration for the DARPA event (April 10, 2013) is closed but a video recording will be posted at: http://www.darpa.mil/Opportunities/Solicitations/I2O_Solicitations.aspx after April 10, 2013.

I suspect semantics are going to be at issue in any number of ways.

The ability to handle semantics robustly may be of value.

Titan 0.3.0 Released

Filed under: Graphs,Networks,Titan — Patrick Durusau @ 3:38 pm

Titan 0.3.0 Released

From the webpage:

Titan 0.3.0 has been released and is ready for download. This release provides a complete performance-driven redesign of many core components. Furthermore, the primary outward facing feature is advanced indexing. The new indexing features are itemized below:

  • Geo: Search for elements using shape primitives within a 2D plane.
  • Full-text: Search elements for matching string and text properties.
  • Numeric range: Search for elements with numeric property values using intervals.
  • Edge: Edges can be indexed as well as vertices.

The Titan tutorial demonstrates the new capabilities.

This should keep you busy over the weekend!

Learning Grounded Models of Meaning

Filed under: Linguistics,Meaning,Modeling,Semantics — Patrick Durusau @ 2:16 pm

Learning Grounded Models of Meaning

Schedule and readings for seminar by Katrin Erk and Jason Baldridge:

Natural language processing applications typically need large amounts of information at the lexical level: words that are similar in meaning, idioms and collocations, typical relations between entities,lexical patterns that can be used to draw inferences, and so on. Today such information is mostly collected automatically from large amounts of data, making use of regularities in the co-occurrence of words. But documents often contain more than just co-occurring words, for example illustrations, geographic tags, or a link to a date. Just like co-occurrences between words, these co-occurrences of words and extra-linguistic data can be used to automatically collect information about meaning. The resulting grounded models of meaning link words to visual, geographic, or temporal information. Such models can be used in many ways: to associate documents with geographic locations or points in time, or to automatically find an appropriate image for a given document, or to generate text to accompany a given image.

In this seminar, we discuss different types of extra-linguistic data, and their use for the induction of grounded models of meaning.

Very interesting reading that should keep you busy for a while! 😉

FLOPS Fall Flat for Intelligence Agency

Filed under: HPC,Intelligence,RFI-RFP,Semantics — Patrick Durusau @ 9:39 am

FLOPS Fall Flat for Intelligence Agency by Nicole Hemsoth.

From the post:

The Intelligence Advanced Research Projects Activity (IARPA) is putting out some RFI feelers in hopes of pushing new boundaries with an HPC program. However, at the core of their evaluation process is an overt dismissal of current popular benchmarks, including floating operations per second (FLOPS).

To uncover some missing pieces for their growing computational needs, IARPA is soliciting for “responses that illuminate the breadth of technologies” under the HPC umbrella, particularly the tech that “isn’t already well-represented in today’s HPC benchmarks.”

The RFI points to the general value of benchmarks (Linpack, for instance) as necessary metrics to push research and development, but argues that HPC benchmarks have “constrained the technology and architecture options for HPC system designers.” More specifically, in this case, floating point benchmarks are not quite as valuable to the agency as data-intensive system measurements, particularly as they relate to some of the graph and other so-called big data problems the agency is hoping to tackle using HPC systems.

Responses are due by Apr 05, 2013 4:00 pm Eastern.

Not that I expect most of you to respond to this RFI but I mention it as a step in the right direction for the processing of semantics.

Semantics are not native to vector fields and so every encoding of semantics in a vector field is a mapping.

As is every extraction of semantic from a vector field is the reverse of that mapping process.

The impact of this mapping/unmapping of semantics to and from a vector field on interpretation are unclear.

As mapping and unmapping decisions are interpretative, it seems reasonable to conclude there is some impact. How much isn’t known.

Vector fields are easy for high FLOPS systems to process but do you want a fast inaccurate answer or one that bears some resemblance to reality as experienced by others?

Graph databases, to name one alternative, are the current rage, at least according to graph database vendors.

But saying “graph database,” isn’t the same as usefully capturing semantics with a graph database.

Or processing semantics once captured.

What we need is an alternative to FLOPS that represents effective processing of semantics.

Suggestions?

The Artful Business of Data Mining…

Filed under: Data Mining,Software,Statistics — Patrick Durusau @ 8:25 am

David Coallier has two presentations under that general title:

Distributed Schema-less Document-Based Databases

and,

Computational Statistics with Open Source Tools

Neither one of which is a “…death by powerpoint…” type presentation where the speaker reads text you can read for yourself.

Which is good, except that with minimal slides, you get an occasional example, names of software/techniques, but you have to fill in a lot of context.

A pointer to videos of either of these presentations would be greatly appreciated!

Mathematics Cannot Be Patented. Case Dismissed.

Filed under: Law,Mathematics,Patents — Patrick Durusau @ 4:48 am

Mathematics Cannot Be Patented. Case Dismissed. by Alan Schoenbaum.

From the post:

Score one for the good guys. Rackspace and Red Hat just defeated Uniloc, a notorious patent troll. This case never should have been filed. The patent never should have been issued. The ruling is historic because, apparently, it was the first time that a patent suit in the Eastern District of Texas has been dismissed prior to filing an answer in the case, on the grounds that the subject matter of the patent was found to be unpatentable. And was it ever unpatentable.

Red Hat indemnified Rackspace in the case. This is something that Red Hat does well, and kudos to them. They stand up for their customers and defend these Linux suits. The lawyers who defended us deserve a ton of credit. Bill Lee and Cynthia Vreeland of Wilmer Hale were creative and persuasive, and their strategy to bring the early motion to dismiss was brilliant.

The patent at issue is a joke. Uniloc alleged that a floating point numerical calculation by the Linux operating system violated U.S. Patent 5,892,697 – an absurd assertion. This is the sort of low quality patent that never should have been granted in the first place and which patent trolls buy up by the bushel full, hoping for fast and cheap settlements. This time, with Red Hat’s strong backing, we chose to fight.

The outcome was just what we had in mind. Chief Judge Leonard Davis found that the subject matter of the software patent was unpatentable under Supreme Court case law and, ruling from the bench, granted our motion for an early dismissal. The written order, which was released yesterday, is excellent and well-reasoned. It’s refreshing to see that the judiciary recognizes that many of the fundamental operations of a computer are pure mathematics and are not patentable subject matter. We expect, and hope, that many more of these spurious software patent lawsuits are dismissed on similar grounds.

A potential use case for a public topic map on patents?

At least on software patents?

Thinking that a topic map could be constructed of all the current patents that address mathematical operations, enabling academics and researchers to focus on factual analysis of the processes claimed by those patents.

From the factual analysis, other researchers, primarily lawyers and law students, could outline legal arguments, tailored for each patent, as to its invalidity.

A community resource, not unlike a patent bank, that would strengthen the community’s hand when dealing with patent trolls.

PS: I guess this means I need to stop working on my patent for addition. 😉

Speaking of Business Cases

Filed under: Marketing,Topic Maps — Patrick Durusau @ 4:35 am

The Telenor post reminded me about my arguments about topic maps saving users time by not (re)searching for information already found.

In Telenor’s case, there was someone, customers in fact, who wanted faster and more accurate information.

Is there a business case for avoiding (re)searching for information already found?

Say where research is being billed to a client by the hour?

The more attorneys, CPAs, paralegals, etc. that find the same information = more billable hours.

Where a topic map = fewer billable hours.

And where billable hours aren’t an issue, what do users do with the time they used to spend on the appearance of working by searching?

I am reminded of a then department manager who described themselves as “…doing market research…” by reading the latest issue of Computer Shopper. Nearly twenty (20) years ago now but even then there were more effective means of such research.

On the other hand, there may be cases where use of topic maps by one side may force others to improve their game.

Intelligence gathering and processing for example.

Topic maps need not disrupt current layers of contracting, feathered nests and revolving doors, to say nothing of the turf guardians.

But topic maps could envelope such systems, in place, to provide access to integrated inter-agency intelligence, long before agreement is reached (if ever) on what intelligence to share.

How NoSQL Paid Off for Telenor

Filed under: Lucene,Marketing,Neo4j,Solr — Patrick Durusau @ 4:07 am

How NoSQL Paid Off for Telenor by Sebastian Verheughe and Katrina Sponheim.

A presentation I encountered while searching for something else.

Makes a business case for Lucene/Solr and Neo4j solutions to improve customer access to data.

As opposed to the world being a better place case.

What information process/need have you encountered where you can make a business case for topic maps?

Older Posts »

Powered by WordPress