Another Word For It Patrick Durusau on Topic Maps and Semantic Diversity

March 23, 2020

#DontRiotAtHome

Filed under: Politics,Protests,Social Sciences — Patrick Durusau @ 1:53 pm

Race Troubles: 109 U.S. Cities Faced Violence in 1967 Over fifty years ago U.S. News and World Report wrote:

More than 100 cities of the U. S. have been hit by Negro violence this year. At least 177 persons have been killed, thousands injured. Property damage has approached 1 billion dollars.

I remember the summer the cities burned. I was puzzled at the time, being 13 years old, why the rioters didn’t attack wealthy sections of town, instead of burning their own?

One explanation of the riots identified this recurrent pattern:

A particular pattern emerged: What usually ignited the powder keg of resentments was police brutality or abuse. Triggering the rioting in Newark was an incident on the hot summer night of July 12 in which police arrested John Smith, an African-American taxi driver, pulling him roughly from his cab during a traffic stop. The cops beat Smith and dragged him into the nearby Fourth Precinct station. Hundreds of residents watched from a large public housing project and an angry crowd quickly gathered outside the police building. A false rumor swirled through the streets that Smith had been killed, adding to the outrage.


The location of riots looks like happenstance, people riot where they are located when a triggering event takes place. In the 1967 riots, those locations were the ghettos where so many Black Americans were imprisoned and remain so to this day.

Data question: What if oppressed people assembled (not marched to) at locations frequented by the owners of government? Say gated communities for instance. If those assemblies were met with police brutality or abuse, would people riot? Any empirical evidence on that question? Asking for a friend.

January 11, 2018

W. E. B. Du Bois as Data Scientist

Filed under: Data Science,Social Sciences,Socioeconomic Data,Visualization — Patrick Durusau @ 3:51 pm

W. E. B. Du Bois’s Modernist Data Visualizations of Black Life by Allison Meier.

From the post:

For the 1900 Exposition Universelle in Paris, African American activist and sociologist W. E. B. Du Bois led the creation of over 60 charts, graphs, and maps that visualized data on the state of black life. The hand-drawn illustrations were part of an “Exhibit of American Negroes,” which Du Bois, in collaboration with Thomas J. Calloway and Booker T. Washington, organized to represent black contributions to the United States at the world’s fair.

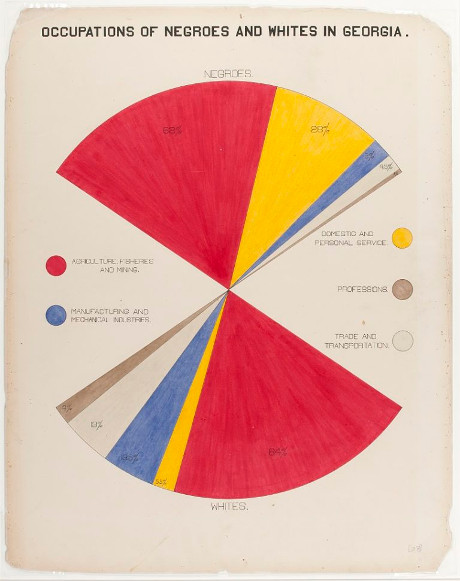
This was less than half a century after the end of American slavery, and at a time when human zoos displaying people from colonized countries in replicas of their homes were still common at fairs (the ruins of one from the 1907 colonial exhibition in Paris remain in the Bois de Vincennes). Du Bois’s charts (recently shared by data artist Josh Begley on Twitter) focus on Georgia, tracing the routes of the slave trade to the Southern state, the value of black-owned property between 1875 and 1889, comparing occupations practiced by blacks and whites, and calculating the number of black students in different school courses (2 in business, 2,252 in industrial).

Ellen Terrell, a business reference specialist at the Library of Congress, wrote a blog post in which she cites a report by Calloway that laid out the 1900 exhibit’s goals:

It was decided in advance to try to show ten things concerning the negroes in America since their emancipation: (1) Something of the negro’s history; (2) education of the race; (3) effects of education upon illiteracy; (4) effects of education upon occupation; (5) effects of education upon property; (6) the negro’s mental development as shown by the books, high class pamphlets, newspapers, and other periodicals written or edited by members of the race; (7) his mechanical genius as shown by patents granted to American negroes; (8) business and industrial development in general; (9) what the negro is doing for himself though his own separate church organizations, particularly in the work of education; (10) a general sociological study of the racial conditions in the United States.

Georgia was selected to represent these 10 points because, according to Calloway, “it has the largest negro population and because it is a leader in Southern sentiment.” Rebecca Onion on Slate Vault notes that Du Bois created the charts in collaboration with his students at Atlanta University, examining everything from the value of household and kitchen furniture to the “rise of the negroes from slavery to freedom in one generation.”

The post is replete with images created by Du Bois for the exposition, of which this is an example:

As we all know, but rarely say in public, data science and visualization of data isn’t a new discipline.

The data science/visualization by Du Bois merits notice during Black History month (February) but the rest of the year as well. It’s part of our legacy in data science and we should be proud of it.

November 3, 2017

Academic Torrents Update

Filed under: Data,Humanities,Open Access,Open Data,Social Sciences — Patrick Durusau @ 7:06 am

When I last mentioned Academic Torrents, in early 2014, it had 1.67TB of research data.

I dropped by Academic Torrents this week to find it now has 25.53TB of research data!

Some arbitrary highlights:

Richard Feynman’s Lectures on Physics (The Messenger Lectures)

A collection of sport activity datasets for data analysis and data mining 2017a

[Coursera] Machine Learning (Stanford University) (ml)

UC Berkeley Computer Science Courses (Full Collection)

[Coursera] Mining Massive Datasets (Stanford University) (mmds)

Wikilinks: A Large-scale Cross-Document Coreference Corpus Labeled via Links to Wikipedia (Original Dataset)

Your arbitrary highlights are probably different than mine so visit Academic Torrents to see what data captures your eye.

Enjoy!

February 1, 2017

Digital Humanities / Studies: U.Pitt.Greenberg

Filed under: Digital Research,Humanities,Literature,Social Sciences,XML,XQuery — Patrick Durusau @ 9:13 pm

Digital Humanities / Studies: U.Pitt.Greenberg maintained by Elisa E. Beshero-Bondar.

I discovered this syllabus and course materials by accident when one of its modules on XQuery turned up in a search. Backing out of that module I discovered this gem of a digital humanities course.

The course description:

Our course in “digital humanities” and “digital studies” is designed to be interdisciplinary and practical, with an emphasis on learning through “hands-on” experience. It is a computer course, but not a course in which you learn programming for the sake of learning a programming language. It’s a course that will involve programming, and working with coding languages, and “putting things online,” but it’s not a course designed to make you, in fifteen weeks, a professional website designer. Instead, this is a course in which we prioritize what we can investigate in the Humanities and related Social Sciences fields about cultural, historical, and literary research questions through applications in computer coding and programming, which you will be learning and applying as you go in order to make new discoveries and transform cultural objects—what we call “texts” in their complex and multiple dimensions. We think of “texts” as the transmittable, sharable forms of human creativity (mainly through language), and we interface with a particular text in multiple ways through print and electronic “documents.” When we refer to a “document,” we mean a specific instance of a text, and much of our work will be in experimenting with the structures of texts in digital document formats, accessing them through scripts we write in computer code—scripts that in themselves are a kind of text, readable both by humans and machines.

Your professors are scholars and teachers of humanities, not computer programmers by trade, and we teach this course from our backgrounds (in literature and anthropology, respectively). We teach this course to share coding methods that are highly useful to us in our fields, with an emphasis on working with texts as artifacts of human culture shaped primarily with words and letters—the forms of “written” language transferable to many media (including image and sound) that we can study with computer modelling tools that we design for ourselves based on the questions we ask. We work with computers in this course as precision instruments that help us to read and process great quantities of information, and that lead us to make significant connections, ask new kinds of questions, and build models and interfaces to change our reading and thinking experience as people curious about human history, culture, and creativity.

Our focus in this course is primarily analytical: to apply computer technologies to represent and investigate cultural materials. As we design projects together, you will gain practical experience in editing and you will certainly fine-tune your precision in writing and thinking. We will be working primarily with eXtensible Markup Language (XML) because it is a powerful tool for modelling texts that we can adapt creatively to our interests and questions. XML represents a standard in adaptability and human-readability in digital code, and it works together with related technologies with which you will gain working experience: You’ll learn how to write XPath expressions: a formal language for searching and extracting information from XML code which serves as the basis for transforming XML into many publishable forms, using XSLT and XQuery. You’ll learn to write XSLT: a programming “stylesheet” transforming language designed to convert XML to publishable formats, as well as XQuery, a query (or search) language for extracting information from XML files bundled collectively. You will learn how to design your own systematic coding methods to work on projects, and how to write your own rules in schema languages (like Schematron and Relax-NG) to keep your projects organized and prevent errors. You’ll gain experience with an international XML language called TEI (after the Text Encoding Initiative) which serves as the international standard for coding digital archives of cultural materials. Since one of the best and most widely accessible ways to publish XML is on the worldwide web, you’ll gain working experience with HTML code (a markup language that is a kind of XML) and styling HTML with Cascading Stylesheets (CSS). We will do all of this with an eye to your understanding how coding works—and no longer relying without question on expensive commercial software as the “only” available solution, because such software is usually not designed with our research questions in mind.

We think you’ll gain enough experience at least to become a little dangerous, and at the very least more independent as investigators and makers who wield computers as fit instruments for your own tasks. Your success will require patience, dedication, and regular communication and interaction with us, working through assignments on a daily basis. Your success will NOT require perfection, but rather your regular efforts throughout the course, your documenting of problems when your coding doesn’t yield the results you want. Homework exercises are a back-and-forth, intensive dialogue between you and your instructors, and we plan to spend a great deal of time with you individually over these as we work together. Our guiding principle in developing assignments and working with you is that the best way for you to learn and succeed is through regular practice as you hone your skills. Our goal is not to make you expert programmers (as we are far from that ourselves)! Rather, we want you to learn how to manipulate coding technologies for your own purposes, how to track down answers to questions, how to think your way algorithmically through problems and find good solutions.

Skimming the syllabus rekindles an awareness of the distinction between the “hard” sciences and the “difficult” ones.

Enjoy!

Update:

After yesterday’s post, Elisa Beshero-Bondar tweeted this one course is now two:

At a new homepage: newtFire {dh|ds}!

Enjoy!

November 8, 2016

We Should Feel Safer Than We Do

Filed under: Data Mining,R,Social Sciences — Patrick Durusau @ 5:38 pm

We Should Feel Safer Than We Do by Christian Holmes.

Christian’s Background and Research Goals:

Background

Crime is a divisive and important issue in the United States. It is routinely ranked as among the most important issue to voters, and many politicians have built their careers around their perceived ability to reduce crime. Over 70% of Americans believe that crime is increasing, according to a recent Gallup poll, but is that really the case? I seek to answer this question in this post, as well as determine if there is any clear correlation between government spending and crime.

Research Goals

-Is crime increasing or decreasing in this country?
-Is there a clear link between government spending and crime?

provide an interesting contrast with his conclusions:

From the crime data, it is abundantly clear that crime is on the decline, and has been for around 20 years. The reasons behind this decrease are quite nuanced, though, and I found no clear link between either increased education or police spending and decreasing crime rates. This does not mean that such a relationship does not exist. Rather, it merely means that there is no obvious correlation between the two variables over this specific time frame.

In his background, Christian says:

Over 70% of Americans believe that crime is increasing, according to a recent Gallup poll, but is that really the case? I seek to answer this question in this post,…

Christian presumes, without proof, a relationship between: public beliefs about crime rates (rising or falling) and crime rates as recorded by government agencies.

Which also presumes:

  1. The public is aware that government collects crime statistics.
  2. The public is aware of current crime statistics.
  3. Current crime statistics influence public beliefs about the incidence of crime.

If the central focus of the paper is a comparison of “crime rates” as measured by government with other data on government spending, why even mention the disparity between public “belief” about crime and crime statistics?

I suspect, just as a rhetorical move, Christian is attempting to draw a favorable inference for his “evidence” by contrasting it with “public belief.” “Public belief” that is contrary to the “evidence” in this instance.

Christian doesn’t offer us any basis for judgments about public opinion on crime one way or the other. Any number of factors could be influencing public opinion on that issue, the crime rate as measured by government being only one of those.

The violent crime rate may be very low, statistically speaking, but if you are the victim of a violent crime, from your perspective crime is very prevalent.

Of R and Relationships

Christian uses R to compare crime date with government spending on education and policing.

The unhappy result is that no relationship is evidenced between government spending and a reduction in crime so Christian cautions:

…This does not mean that such a relationship does not exist. Rather, it merely means that there is no obvious correlation between the two variables over this specific time frame….

There is where we switch from relying on data and explore the realms of “the data didn’t prove I was wrong.”

Since it isn’t possible to prove the absence of a relationship between the “crime rate” and government spending on education/police, no, the evidence didn’t prove Christian to be wrong.

On the other hand, it clearly shows that Christopher has no evidence for that “relationship.”

The caution here is that using R and “reliable” data may lead to conclusions you would rather avoid.

PS: Crime and the public’s fear of crime are both extremely complex issues. Aggregate data can justify previously chosen positions, but little more.

October 23, 2016

Data Science for Political and Social Phenomena [Special Interest Search Interface]

Filed under: Data Science,Python,R,Social Sciences — Patrick Durusau @ 3:53 pm

Data Science for Political and Social Phenomena by Chris Albon.

From the webpage:

I am a data scientist and quantitative political scientist. I specialize in the technical and organizational aspects of applying data science to political and social issues.

Years ago I noticed a gap in the existing data literature. On one side was data science, with roots in mathematics and computer science. On the other side were the social sciences, with hard-earned expertise modeling and predicting complex human behavior. The motivation for this site and ongoing book project is to bridge that gap: to create a practical guide to applying data science to political and social phenomena.

Chris has organized three hundred and twenty-eight pages on Data Wrangling, Python, R, etc.

If you like learning from examples, this is the site for you!

Including this site, what other twelve (12) sites would you include in a Python/R Data Science search interface?

That is an interface that has indexed only that baker’s dozen of sites. So you don’t spend time wading through “the G that is not named” search results.

Serious question.

Not that I would want to maintain such a beast for external use, but having a local search engine tuned to your particular interests could be nice.

June 9, 2016

Record Linkage (Think Topic Maps) In War Crimes Investigations

Filed under: Record Linkage,Social Sciences,Topic Maps — Patrick Durusau @ 4:28 pm

Machine learning for human rights advocacy: Big benefits, serious consequences by Megan Price.

Megan is the executive director of the Human Rights Data Analysis Group (HRDAG), an organization that applies data science techniques to documenting violence and potential human rights abuses.

I watched the video expecting extended discussion of machine learning, only to find that our old friend, record linkage, was mentioned repeatedly during the presentation. Along with some description of the difficulty of reconciling lists of identified casualties in war zones.

Not to mention the task of estimating casualties that will never appear by any type of reporting.

When Megan mentioned record linkage I was hooked and stayed for the full presentation. If you follow the link to Human Rights Data Analysis Group (HRDAG), you will find a number of publications, concerning the scientific side of their work.

Oh, record linkage is a technique used originally in epidemiology to “merge*” records from different authorities in order to study the transmission of disease. It dates from the late 1950’s and has been actively developed since then.

Including two complete and independent mathematical models, which arose because terminology differences prevented the second one from discovering the first. There’s a topic map example for you!

Certainly an area where the multiple facets (non-topic map sense) of subject identity would come into play. Not to mention making the merging of lists auditable. (They may already have that capability and I am unaware of it.)

It’s an interesting video and the website even more so.

Enjoy!

* One difference between record linkage and topic maps is that the usual record linkage technique maps diverse data into a single representation for processing. That technique loses the semantics associated with the terminology in the original records. Preservation of those semantics may not be your use case, but be aware you are losing data in such a process.

October 8, 2015

Convenient Emacs Setup for Social Scientists

Filed under: Editor,Social Sciences — Patrick Durusau @ 9:48 am

Convenient Emacs Setup for Social Scientists Available, Thanks to RTC Team Member

From the post:

QSS consultant Ista Zahn has made work with Emacs a lot easier for social scientists with a package that is now available for users.

Ista Zahn, a member of the Institute’s Research Technology Consulting (RTC) team, became an Emacs user about 10 years ago, because it offered a convenient environment for literate programming and reproducible data analysis. “I quickly discovered,” he says, “as all Emacs users do, that Emacs is a strange creature.” Through nearly 40 years of continuous development, Emacs has accumulated a great many added features, which a user must comb through in order to choose which they need for their own work. Zahn explains how he came about the Emacs setup that is now available:

In the summer of 2014 Gary King asked for an Emacs configuration with a specific set of features, and I realized that my personal Emacs configuration already provided a lot of the features he was looking for. Since that time we’ve worked together to turn my personal Emacs configuration into something that can be useful to other Emacs users. The result is a well-documented Emacs initialization that focuses on configuring Emacs tools commonly used by social scientists, including LaTeX, git, and R.

Ista Zahn’s Emacs package for social scientists is available for download at https://github.com/izahn/dotemacs.

I stumbled over the word “convenient” in the title and not without cause.

Ista concedes as much when he says:

What the world needs now…

As of August 5th 2014 there are 2,960 github repositories named or mentioning ‘.emacs.d’, and another 627 named or mentioning “dotemacs”. Some of these are just personal emacs configurations, but many take pains to provide documentation and instruction for adopting them as your very own emacs configuration. And that’s not to mention the starter-kits, preludes and oh my emacs of the world! With all these options, does the world really need yet another emacs configuration?

No, the world does not need another emacs starter kit. Indeed the guy who started the original emacs starter-kit has concluded that the whole idea is unworkable, and that if you want to use emacs you’re better off configuring it yourself. I agree, and it’s not that hard, even if you don’t know emacs-lisp at all. You can copy code fragments from others’ configuration on github, from the emacs wiki, or from stackoverflow and build up your very own emacs configuration. And eventually it will be so perfect you will think “gee I could save people the trouble of configuring emacs, if they would just clone my configuration”. So you will put it on github, like everyone else (including me). Sigh.

On the other hand it may be that this emacs configuration is what you want after all. It turns on many nice features of emacs, and adds many more. Anyway it does not hurt to give it a try.

As he says, it won’t hurt to give it a try (but be sure to not step on your current Emacs installation/configuration).

How would you customize Emacs for authoring topic maps? What external programs would you call?

I first saw this in a tweet by Christophe Lalanne.

August 1, 2015

Things That Are Clear In Hindsight

Filed under: Social Sciences,Subject Identity,Subject Recognition — Patrick Durusau @ 12:10 pm

Sean Gallagher recently tweeted:

Oh look, the Triumphalism Trilogy is now a boxed set.

triumphalism-trilogy

In case you are unfamiliar with the series, The Tipping Point, Blink, Outliers.

Although entertaining reads, particularly The Tipping Point (IMHO), Gladwell does not describe how to recognize a tipping point in advance of it being a tipping point, nor how to make good decisions without thinking (Blink) or how to recognize human potential before success (Outliers).

Tipping points, good decisions and human potential can be recognized only when they are manifested.

As you can tell from Gladwell’s book sales, selling the hope of knowing the unknowable, remains a viable market.

May 31, 2015

The peer review drugs don’t work [Faith Based Science]

Filed under: Peer Review,Publishing,Science,Social Sciences — Patrick Durusau @ 10:44 am

The peer review drugs don’t work by Richard Smith.

From the post:

It is paradoxical and ironic that peer review, a process at the heart of science, is based on faith not evidence.

There is evidence on peer review, but few scientists and scientific editors seem to know of it – and what it shows is that the process has little if any benefit and lots of flaws.

Peer review is supposed to be the quality assurance system for science, weeding out the scientifically unreliable and reassuring readers of journals that they can trust what they are reading. In reality, however, it is ineffective, largely a lottery, anti-innovatory, slow, expensive, wasteful of scientific time, inefficient, easily abused, prone to bias, unable to detect fraud and irrelevant.

As Drummond Rennie, the founder of the annual International Congress on Peer Review and Biomedical Publication, says, “If peer review was a drug it would never be allowed onto the market.”

Cochrane reviews, which gather systematically all available evidence, are the highest form of scientific evidence. A 2007 Cochrane review of peer review for journals concludes: “At present, little empirical evidence is available to support the use of editorial peer review as a mechanism to ensure quality of biomedical research.”

We can see before our eyes that peer review doesn’t work because most of what is published in scientific journals is plain wrong. The most cited paper in Plos Medicine, which was written by Stanford University’s John Ioannidis, shows that most published research findings are false. Studies by Ioannidis and others find that studies published in “top journals” are the most likely to be inaccurate. This is initially surprising, but it is to be expected as the “top journals” select studies that are new and sexy rather than reliable. A series published in The Lancet in 2014 has shown that 85 per cent of medical research is wasted because of poor methods, bias and poor quality control. A study in Nature showed that more than 85 per cent of preclinical studies could not be replicated, the acid test in science.

I used to be the editor of the BMJ, and we conducted our own research into peer review. In one study we inserted eight errors into a 600 word paper and sent it 300 reviewers. None of them spotted more than five errors, and a fifth didn’t detect any. The median number spotted was two. These studies have been repeated many times with the same result. Other studies have shown that if reviewers are asked whether a study should be published there is little more agreement than would be expected by chance.

As you might expect, the humanities are lagging far behind the sciences in acknowledging that peer review is an exercise in social status rather than quality:


One of the changes I want to highlight is the way that “peer review” has evolved fairly quietly during the expansion of digital scholarship and pedagogy. Even though some scholars, such as Kathleen Fitzpatrick, are addressing the need for new models of peer review, recognition of the ways that this process has already been transformed in the digital realm remains limited. The 2010 Center for Studies in Higher Education (hereafter cited as Berkeley Report) comments astutely on the conventional role of peer review in the academy:

Among the reasons peer review persists to such a degree in the academy is that, when tied to the venue of a publication, it is an efficient indicator of the quality, relevance, and likely impact of a piece of scholarship. Peer review strongly influences reputation and opportunities. (Harley, et al 21)

These observations, like many of those presented in this document, contain considerable wisdom. Nevertheless, our understanding of peer review could use some reconsideration in light of the distinctive qualities and conditions associated with digital humanities.
…(Living in a Digital World: Rethinking Peer Review, Collaboration, and Open Access by Sheila Cavanagh.)

Can you think of another area where something akin to peer review is being touted?

What about internal guidelines of the CIA, NSA, FBI and secret courts reviewing actions by those agencies?

How do those differ from peer review, which is an acknowledged failure in science and should be acknowledged in the humanities?

They are quite similar in the sense that some secret group is empowered to make decisions that impact others and members of those groups, don’t want to relinquish those powers. Surprise, surprise.

Peer review should be scrapped across the board and replaced by tracked replication and use by others, both in the sciences and the humanities.

Government decisions should be open to review by all its citizens and not just a privileged few.

May 21, 2015

Twitter As Investment Tool

Filed under: Social Media,Social Networks,Social Sciences,Twitter — Patrick Durusau @ 12:44 pm

Social Media, Financial Algorithms and the Hack Crash by Tero Karppi and Kate Crawford.

Abstract:

@AP: Breaking: Two Explosions in the White House and Barack Obama is injured’. So read a tweet sent from a hacked Associated Press Twitter account @AP, which affected financial markets, wiping out $136.5 billion of the Standard & Poor’s 500 Index’s value. While the speed of the Associated Press hack crash event and the proprietary nature of the algorithms involved make it difficult to make causal claims about the relationship between social media and trading algorithms, we argue that it helps us to critically examine the volatile connections between social media, financial markets, and third parties offering human and algorithmic analysis. By analyzing the commentaries of this event, we highlight two particular currents: one formed by computational processes that mine and analyze Twitter data, and the other being financial algorithms that make automated trades and steer the stock market. We build on sociology of finance together with media theory and focus on the work of Christian Marazzi, Gabriel Tarde and Tony Sampson to analyze the relationship between social media and financial markets. We argue that Twitter and social media are becoming more powerful forces, not just because they connect people or generate new modes of participation, but because they are connecting human communicative spaces to automated computational spaces in ways that are affectively contagious and highly volatile.

Social sciences lag behind the computer sciences in making their publications publicly accessible as well as publishing behind firewalls so I can report on is the abstract.

On the other hand, I’m not sure how much practical advice you could gain from the article as opposed to the volumes of commentary following the incident itself.

The research reminds me of Malcolm Gladwell, author of The Tipping Point and similar works.

While I have greatly enjoyed several of Gladwell’s books, including the Tipping Point, it is one thing to look back and say: “Look, there was a tipping point.” It is quite another to be in the present and successfully say: “Look, there is a tipping point and we can make it tip this way or that.”

In retrospect, we all credit ourselves with near omniscience when our plans succeed and we invent fanciful explanations about what we knew or realized at the time. Others, equally skilled, dedicated and competent, who started at the same time, did not succeed. Of course, the conservative media (and ourselves if we are honest), invent narratives to explain those outcomes as well.

Of course, deliberate manipulation of the market with false information, via Twitter or not, is illegal. The best you can do is look for a pattern of news and/or tweets that result in downward changes in a particular stock, which then recovers and then apply that pattern more broadly. You won’t make $millions off of any one transaction but that is the sort of thing that draws regulatory attention.

May 9, 2015

Exposure to Diverse Information on Facebook [Skepticism]

Filed under: Facebook,News,Opinions,Social Media,Social Networks,Social Sciences — Patrick Durusau @ 3:06 pm

Exposure to Diverse Information on Facebook by Eytan Bakshy, Solomon Messing, Lada Adamicon.

From the post:

As people increasingly turn to social networks for news and civic information, questions have been raised about whether this practice leads to the creation of “echo chambers,” in which people are exposed only to information from like-minded individuals [2]. Other speculation has focused on whether algorithms used to rank search results and social media posts could create “filter bubbles,” in which only ideologically appealing content is surfaced [3].

Research we have conducted to date, however, runs counter to this picture. A previous 2012 research paper concluded that much of the information we are exposed to and share comes from weak ties: those friends we interact with less often and are more likely to be dissimilar to us than our close friends [4]. Separate research suggests that individuals are more likely to engage with content contrary to their own views when it is presented along with social information [5].

Our latest research, released today in Science, quantifies, for the first time, exactly how much individuals could be and are exposed to ideologically diverse news and information in social media [1].

We found that people have friends who claim an opposing political ideology, and that the content in peoples’ News Feeds reflect those diverse views. While News Feed surfaces content that is slightly more aligned with an individual’s own ideology (based on that person’s actions on Facebook), who they friend and what content they click on are more consequential than the News Feed ranking in terms of how much diverse content they encounter.

The Science paper: Exposure to Ideologically Diverse News and Opinion

The definition of an “echo chamber” is implied in the authors’ conclusion:


By showing that people are exposed to a substantial amount of content from friends with opposing viewpoints, our findings contrast concerns that people might “list and speak only to the like-minded” while online [2].

The racism of the Deep South existed in spite of interaction between whites and blacks. So “echo chamber” should not be defined as association of like with like, at least not entirely. The Deep South was a echo chamber of racism but not for a lack of diversity in social networks.

Besides lacking a useful definition of “echo chamber,” the author’s ignore the role of confirmation bias (aka “backfire effect”) when confronted with contrary thoughts or evidence. To some readers seeing a New York Times editorial disagreeing with their position, can make them feel better about being on the “right side.”

That people are exposed to diverse information on Facebook is interesting, but until there is a meaningful definition of “echo chambers,” the role Facebook plays in the maintenance of “echo chambers” remains unknown.

March 16, 2015

Bias? What Bias?

Filed under: Bias,Facebook,Social Media,Social Sciences,Twitter — Patrick Durusau @ 6:09 pm

Scientists Warn About Bias In The Facebook And Twitter Data Used In Millions Of Studies by Brid-Aine Parnell.

From the post:

Social media like Facebook and Twitter are far too biased to be used blindly by social science researchers, two computer scientists have warned.

Writing in today’s issue of Science, Carnegie Mellon’s Juergen Pfeffer and McGill’s Derek Ruths have warned that scientists are treating the wealth of data gathered by social networks as a goldmine of what people are thinking – but frequently they aren’t correcting for inherent biases in the dataset.

If folks didn’t already know that scientists were turning to social media for easy access to the pat statistics on thousands of people, they found out about it when Facebook allowed researchers to adjust users’ news feeds to manipulate their emotions.

Both Facebook and Twitter are such rich sources for heart pounding headlines that I’m shocked, shocked that anyone would suggest there is bias in the data! 😉

Not surprisingly, people participate in social media for reasons entirely of their own and quite unrelated to the interests or needs of researchers. Particular types of social media attract different demographics than other types. I’m not sure how you could “correct” for those biases, unless you wanted to collect better data for yourself.

Not that there are any bias free data sets but some are so obvious that it hardly warrants mentioning. Except that institutions like the Brookings Institute bump and grind on Twitter data until they can prove the significance of terrorist social media. Brookings knows better but terrorism is a popular topic.

Not to make data carry all the blame, the test most often applied to data is:

Will this data produce a result that merits more funding and/or will please my supervisor?

I first saw this in a tweet by Persontyle.

January 2, 2015

The Machines in the Valley Digital History Project

Filed under: Digital Research,History,Humanities,Social Sciences — Patrick Durusau @ 4:42 pm

The Machines in the Valley Digital History Project by Jason Heppler.

From the post:

I am excited to finally release the digital component of my dissertation, Machines in the Valley.

My dissertation, Machines in the Valley, examines the environmental, economic, and cultural conflicts over suburbanization and industrialization in California’s Santa Clara Valley–today known as Silicon Valley–between 1945 and 1990. The high technology sector emerged as a key component of economic and urban development in the postwar era, particularly in western states seeking to diversify their economic activities. Industrialization produced thousands of new jobs, but development proved problematic when faced with competing views about land use. The natural allure that accompanied the thousands coming West gave rise to a modern environmental movement calling for strict limitations on urban growth, the preservation of open spaces, and the reduction of pollution. Silicon Valley stood at the center of these conflicts as residents and activists criticized the environmental impact of suburbs and industry in the valley. Debates over the Santa Clara Valley’s landscape tells the story not only of Silicon Valley’s development, but Americans’ changing understanding of nature and the environmental costs of urban and industrial development.

A great example of a digital project in the humanities!

How does Jason’s dissertation differ from a collection of resources on the same topic?

A collection of resources requires each of us to duplicate Jason’s work to extract the same information. Jason has curated the data, that is he has separated out the useful from the not so useful, eliminated duplicate sources that don’t contribute to the story, and provided his own analysis as a value-add to the existing data that he has organized. That means we don’t have to duplicate Jason’s work, for which we are all thankful.

How does Jason’s dissertation differ from a topic map on the same topic?

Take one of the coming soon topics for comparison:

“The Stanford Land Machine has Gone Berserk!” Stanford University and the Stanford Industrial Park (Coming Soon)

Stanford University is the largest landholder on the San Francisco Peninsula, controlling nearly 9,000 acres. In the 1950s, Stanford started acting as a real estate developer, first with the establishment of the Stanford Industrial Park in 1953 and later through several additional land development programs. These programs, however, ran into conflict with surrounding neighborhoods whose ideas for the land did not include industrialization.

Universities are never short on staff and alumni that they would prefer being staff and/or alumni from some other university. Jason will be writing about one or more such individuals under this topic. In the process of curation, he will select known details about such individuals as are appropriate for his discussion. It isn’t possible to include every known detail about any person, location, event, artifact, etc. No one would have time to read the argument being made in the dissertation.

In addition to the curation/editing process, there will be facts that Jason doesn’t uncover and/or that are unknown to anyone at present. If the governor of California can conceal an illegitimate child for ten years, it won’t be surprising to find other details about the people Jason discusses in his dissertation.

When such new information comes out, how do we put that together with the information already collected in Jason’s dissertation?

Unless you are expecting a second edition of Jason’s dissertation, the quick answer is we’re not. Not today, not tomorrow, not ever.

The current publishing paradigm is designed for republication, not incremental updating of publications. If new facts do appear and more likely enough time has passes that Jason’s dissertation is no longer “new,” some new PhD candidate will add new data, dig out the same data as Jason, and fashion a new dissertation.

If instead of imprisoning his data in prose, if Jason had his prose presentation for the dissertation and topics (as in topic maps) for the individuals, deeds, events, etc., then as more information is discovered, it could be fitted into his existing topic map of that data. Unlike the prose, a topic map doesn’t require re-publication in order to add new information.

In twenty or thirty years when Jason is advising some graduate student who wants to extend his dissertation, Jason can give them the topic map that has up to date data (or to be updated), making the next round of scholarship on this issue cumulative and not episodic.
December 26, 2014

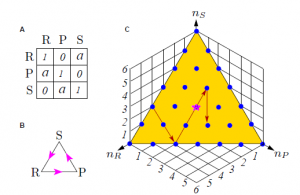
How to Win at Rock-Paper-Scissors

Filed under: Game Theory,Games,Science,Social Sciences — Patrick Durusau @ 4:40 pm

How to Win at Rock-Paper-Scissors

From the post:

The first large-scale measurements of the way humans play Rock-Paper-Scissors reveal a hidden pattern of play that opponents can exploit to gain a vital edge.

RPSgame

If you’ve ever played Rock-Paper-Scissors, you’ll have wondered about the strategy that is most likely to beat your opponent. And you’re not alone. Game theorists have long puzzled over this and other similar games in the hope of finding the ultimate approach.

It turns out that the best strategy is to choose your weapon at random. Over the long run, that makes it equally likely that you will win, tie, or lose. This is known as the mixed strategy Nash equilibrium in which every player chooses the three actions with equal probability in each round.

And that’s how the game is usually played. Various small-scale experiments that record the way real people play Rock-Paper-Scissors show that this is indeed the strategy that eventually evolves.

Or so game theorists had thought… (emphasis added)

No, I’m not going to give away the answer!

I will only say the answer isn’t what has been previously thought.

Why the different answer? Well, the authors speculate (with some justification) that the smallness of prior experiments resulted in the non-exhibition of a data pattern that was quite obvious when done on a larger scale.

Given that N < 100 in so many sociology, psychology, and other social science experiments, the existing literature offers a vast number of opportunities where repeating small experiments on large scale could produce different results. If you have any friends in a local social science department, you might want to suggest this to them as a way to be on the front end of big data in social science. PS: If you have access to a social science index, please search and post a rough count of participants < 100 in some subset of social science journals. Say since 1970. Thanks!

November 13, 2014

Computational Culture

Filed under: Computation,Computational Semantics,Cultural Anthropology,Social Sciences — Patrick Durusau @ 7:16 pm

Computational Culture: a journal of software studies

From the about page:

Computational Culture is an online open-access peer-reviewed journal of inter-disciplinary enquiry into the nature of the culture of computational objects, practices, processes and structures.

The journal’s primary aim is to examine the ways in which software undergirds and formulates contemporary life. Computational processes and systems not only enable contemporary forms of work and play and the management of emotional life but also drive the unfolding of new events that constitute political, social and ontological domains. In order to understand digital objects such as corporate software, search engines, medical databases or to enquire into the use of mobile phones, social networks, dating, games, financial systems or political crises, a detailed analysis of software cannot be avoided.

A developing form of literacy is required that matches an understanding of computational processes with those traditionally bound within the arts, humanities, and social sciences but also in more informal or practical modes of knowledge such as hacking and art.

The journal welcomes contributions that address such topics and many others that may derive and mix methodologies from cultural studies, science and technology studies, philosophy of computing, metamathematics, computer science, critical theory, media art, human computer interaction, media theory, design, philosophy.

Computational Culture publishes peer-reviewed articles, special projects, interviews, and reviews of books, projects, events and software. The journal is also involved in developing a series of events and projects to generate special issues.

A few of the current articles:

Not everyone’s cup of tea but for those who appreciate it, this promises to be a real treasure.

August 22, 2014

Computer Science – Know Thyself!

Filed under: Computer Science,Social Sciences,Survey — Patrick Durusau @ 10:34 am

Putting the science in computer science by Felienne Hermans.

From the description:

Programmers love science! At least, so they say. Because when it comes to the ‘science’ of developing code, the most used tool is brutal debate. Vim versus emacs, static versus dynamic typing, Java versus C#, this can go on for hours at end. In this session, software engineering professor Felienne Hermans will present the latest research in software engineering that tries to understand and explain what programming methods, languages and tools are best suited for different types of development.

Great slides from Felienne’s keynote at ALE 2014.

I mention this to emphasize the need for social science research techniques and methodologies for application development. Investigation of computer science debates with such methods may lead to less resistance to them for user facing issues.

Perhaps a recognition that we are all “users,” bringing common human experiences to different interfaces with computers, will result in better interfaces for all.

August 6, 2014

CAB Thesaurus 2014

Filed under: Social Sciences,Thesaurus — Patrick Durusau @ 2:46 pm

CAB Thesaurus 2014

From the webpage:

The CAB Thesaurus is the essential search tool for all users of the CAB ABSTRACTS™ and Global Health databases and related products. The CAB Thesaurus is not only an invaluable aid for database users but it has many potential uses by individuals and organizations indexing their own information resources for both internal use and on the Internet.

Its strengths include:

  • Controlled vocabulary that has been in constant use since 1983
  • Regularly updated (current version released July 2014)
  • Broad coverage of pure and applied life sciences, technology and social sciences
  • Approximately 264,500 terms, including 144,900 preferred terms and 119,600 non-preferred terms
  • Specific terminology for all subjects covered
  • Includes about 206,400 plant, animal and microorganism names
  • Broad, narrow and related terms to help users find relevant terminology
  • Cross-references from non-preferred synonyms to preferred terms
  • Multi-lingual, with Dutch, Portuguese and Spanish equivalents for most English terms, plus lesser content in Danish, Finnish, French, German, Italian, Norwegian and Swedish
  • American and British spelling variants
  • Relevant CAS registry numbers for chemicals
  • Commission notation for enzymes

Impressive work and one that you should consult before venturing out to make a “standard” vocabulary for some area. It may already exist.

As a traditional thesaurus, CAB lists equivalent terms in other languages. That is to say it omits any properties of its primary or “matching” terms to enable the reader to judge for themselves if the terms represent the same subject.

When you become accustomed to thinking of what criteria was used to say two or more words represent the same subject, the lack of that information becomes glaring.

I first saw this at New edition of CAB Thesaurus published by Anton Doroszenko.

July 21, 2014

Non-Moral Case For Diversity

Filed under: Crowd Sourcing,Diversity,Social Sciences — Patrick Durusau @ 10:24 am

Groups of diverse problem solvers can outperform groups of high-ability problem solvers by Lu Hong and Scott E. Page.

Abstract:

We introduce a general framework for modeling functionally diverse problem-solving agents. In this framework, problem-solving agents possess representations of problems and algorithms that they use to locate solutions. We use this framework to establish a result relevant to group composition. We find that when selecting a problem-solving team from a diverse population of intelligent agents, a team of randomly selected agents outperforms a team comprised of the best-performing agents. This result relies on the intuition that, as the initial pool of problem solvers becomes large, the best-performing agents necessarily become similar in the space of problem solvers. Their relatively greater ability is more than offset by their lack of problem-solving diversity.

I have heard people say that diverse teams are better, but always in the context of contending for members of one group or another to be included on a team.

Reading the paper carefully, I don’t think that is the author’s point at all.

From the conclusion:

The main result of this paper provides conditions under which, in the limit, a random group of intelligent problem solvers will outperform a group of the best problem solvers. Our result provides insights into the trade-off between diversity and ability. An ideal group would contain high-ability problem solvers who are diverse. But, as we see in the proof of the result, as the pool of problem solvers grows larger, the very best problem solvers must become similar. In the limit, the highest-ability problem solvers cannot be diverse. The result also relies on the size of the random group becoming large. If not, the individual members of the random group may still have substantial overlap in their local optima and not perform well. At the same time, the group size cannot be so large as to prevent the group of the best problem solvers from becoming similar. This effect can also be seen by comparing Table 1. As the group size becomes larger, the group of the best problem solvers becomes more diverse and, not surprisingly, the group performs relatively better.

A further implication of our result is that, in a problem-solving context, a person’s value depends on her ability to improve the collective decision (8). A person’s expected contribution is contextual, depending on the perspectives and heuristics of others who work on the problem. The diversity of an agent’s problem-solving approach, as embedded in her perspective-heuristic pair, relative to the other problem solvers is an important predictor of her value and may be more relevant than her ability to solve the problem on her own. Thus, even if we were to accept the claim that IQ tests, Scholastic Aptitude Test scores, and college grades predict individual problem-solving ability, they may not be as important in determining a person’s potential contribution as a problem solver as would be measures of how differently that person thinks. (emphasis added)

Some people accept gender, race, nationality, etc. as markers for thinking differently and no doubt that is true in some cases. But presuming it is just as uninformed as presuming no differences in how people of different gender, race, and nationalities think.

You could ask. Such as presenting candidates for a team with open ended problems that are capable of multiple solutions. Group similar solutions together and then pick randomly across the solution groups.

You may have a gender, race, nationality diverse team but if they think the same way, say Anthony Scalia and Clarence Thomas, then your team isn’t usefully diverse.

Diversity of thinking should be your goal, not diversity of markers of diversity.

I first saw this in a tweet by Chris Dixon.

July 7, 2014

Data Visualization in Sociology

Filed under: Graphics,Social Sciences,Visualization — Patrick Durusau @ 6:32 pm

Data Visualization in Sociology by Kieran Healy and James Moody. (Annu. Rev. Sociol. 2014. 40:5.1–5.24, DOI: 10.1146/annurev-soc-071312-145551)

Abstract:

Visualizing data is central to social scientific work. Despite a promising early beginning, sociology has lagged in the use of visual tools. We review the history and current state of visualization in sociology. Using examples throughout, we discuss recent developments in ways of seeing raw data and presenting the results of statistical modeling. We make a general distinction between those methods and tools designed to help explore data sets and those designed to help present results to others. We argue that recent advances should be seen as part of a broader shift toward easier sharing of the code and data both between researchers and with wider publics, and we encourage practitioners and publishers to work toward a higher and more consistent standard for the graphical display of sociological insights.

A great review of data visualization in sociology. I was impressed by the author’s catching the context of John Maynard Keyes‘ remark about the “evils of the graphical method unsupported by tables of figures.”

In 1938, tables of figures reported actual data, not summaries. With a table of figures, another researcher could verify a graphic representation and/or re-use the data for their own work.

Perhaps journals could adopt a standing rule that no graphic representations are allowed in a publication unless and until the authors provide the data and processing steps necessary to reproduce the graphic. For public re-use.

The authors’ also make the point that for all the wealth of books on visualization and graphics, there is no cookbook that will enable a user to create a great graphic.

My suggestion in that regard is to collect visualizations that are widely thought to be “great” visualizations. Study the data and background of the visualization. Not so that you can copy the technique but in order to develop a sense for what “works” or doesn’t for visualization.

No guarantees but at a minimum, you will have experienced a large number of visualizations. That can’t hurt in your quest to create better visualizations.

I first saw this in a tweet by Christophe Lalanne.

March 18, 2014

Web Scraping: working with APIs

Filed under: Data Mining,Humanities,R,Social Sciences,Web Scrapers — Patrick Durusau @ 7:16 pm

Web Scraping: working with APIs by Rolf Fredheim.

From the post:

APIs present researchers with a diverse set of data sources through a standardised access mechanism: send a pasted together HTTP request, receive JSON or XML in return. Today we tap into a range of APIs to get comfortable sending queries and processing responses.

These are the slides from the final class in Web Scraping through R: Web scraping for the humanities and social sciences

This week we explore how to use APIs in R, focusing on the Google Maps API. We then attempt to transfer this approach to query the Yandex Maps API. Finally, the practice section includes examples of working with the YouTube V2 API, a few ‘social’ APIs such as LinkedIn and Twitter, as well as APIs less off the beaten track (Cricket scores, anyone?).

The final installment of Rolf’s course for humanists. He promises to repeat it next year. Should be interesting to see how techniques and resources evolve over the next year.

Forward the course link to humanities and social science majors.

March 11, 2014

30,000 comics, 7,000 series – How’s Your Collection?

Filed under: Data,History,Social Sciences — Patrick Durusau @ 4:53 pm

Marvel Comics opens up its metadata for amazing Spider-Apps by Alex Dalenberg.

From the post:

It’s not as cool as inheriting superpowers from a radioactive spider, but thanks to Marvel Entertainment’s new API, you can now build Marvel Comics apps to your heart’s content.

That is, as long as you’re not making any money off of them. Nevertheless, it’s a comic geek’s dream. The Disney-owned company is opening up the data trove from its 75-year publishing history, including cover art, characters and comic book crossover events, for developers to tinker with.

That’s metadata for more than 30,000 comics and 7,000 series.

Marvel Developer.

I know, another one of those non-commercial use licenses. I mean, Marvel paid for all of this content and then has the gall to not just give it away for free. What is the world coming to?

😉

Personally I think Marvel has the right to allow as much or as little access to their data as they please. If you come up with a way to make money using this content, ask Marvel for commercial permissions. I deeply suspect they will be more than happy to accommodate any reasonable request.

The comic book zealot uses are obvious but aren’t you curious about the comic books your parents read? Or that your grandparents read?

Speaking of contemporary history, a couple of other cultural goldmines, Playboy Cover to Cover Hard Drive – Every Issue From 1953 to 2010 and Rolling Stone.

I don’t own either one so I don’t know how hard it would be to get the content in to machine readable format.

Still, both would be a welcome contrast to main stream news sources.

I first saw this in a tweet by Bob DuCharme.

January 22, 2014

Social Science Dataset Prize!

Filed under: Contest,Dataset,Social Sciences,Socioeconomic Data,Statistics — Patrick Durusau @ 5:49 pm

Statwing is awarding $1,500 for the best insights from its massive social science dataset by Derrick Harris.

All submissions are due through the form on this page by January 30 at 11:59pm PST.

From the post:

Statistics startup Statwing has kicked off a competition to find the best insights from a 406-variable social science dataset. Entries will be voted on by the crowd, with the winner getting $1,000, second place getting $300 and third place getting $200. (Check out all the rules on the Statwing site.) Even if you don’t win, though, it’s a fun dataset to play with.

The data comes from the General Social Survey and dates back to 1972. It contains variables ranging from sex to feelings about education funding, from education level to whether respondents think homosexual men make good parents. I spent about an hour slicing and dicing variable within the Statwing service, and found some at least marginally interesting stuff. Contest entries can use whatever tools they want, and all 79 megabytes and 39,662 rows are downloadable from the contest page.

Time is short so you better start working.

The rules page, where you make your submission, emphasizes:

Note that this is a competition for the most interesting finding(s), not the best visualization.

Use any tool or method, just find the “most interesting finding(s)” as determined by crowd vote.

On the dataset:

Every other year since 1972, the General Social Survey (GSS) has asked thousands of Americans 90 minutes of questions about religion, culture, beliefs, sex, politics, family, and a lot more. The resulting dataset has been cited by more than 14,000 academic papers, books, and dissertations—more than any except the U.S. Census.

I can’t decide if Americans have more odd opinions now than before. 😉

Maybe some number crunching will help with that question.

January 20, 2014

Data with a Soul…

Filed under: Data,Social Networks,Social Sciences — Patrick Durusau @ 5:33 pm

Data with a Soul and a Few More Lessons I Have Learned About Data by Enrico Bertini.

From the post:

I don’t know if this is true for you but I certainly used to take data for granted. Data are data, who cares where they come from. Who cares how they are generated. Who cares what they really mean. I’ll take these bits of digital information and transform them into something else (a visualization) using my black magic and show it to the world.

I no longer see it this way. Not after attending a whole three days event called the Aid Data Convening; a conference organized by the Aid Data Consortium (ARC) to talk exclusively about data. Not just data in general but a single data set: the Aid Data, a curated database of more than a million records collecting information about foreign aid.

The database keeps track of financial disbursements made from donor countries (and international organizations) to recipient countries for development purposes: health and education, disasters and financial crises, climate change, etc. It spans a time range between 1945 up to these days and includes hundreds of countries and international organizations.

Aid Data users are political scientists, economists, social scientists of many sorts, all devoted to a single purpose: understand aid. Is aid effective? Is aid allocated efficiently? Does aid go where it is more needed? Is aid influenced by politics (the answer is of course yes)? Does aid have undesired consequences? Etc.

Isn’t that incredibly fascinating? Here is what I have learned during these few days I have spent talking with these nice people.
….

This fits quite well with the resources I mention in Lap Dancing with Big Data.

Making the Aid data your own data, will require time, effort and personal effort to understand and master it.

By that point, however, you may care about the data and the people it represents. Just be forewarned.

December 1, 2013

Computational Social Science

Filed under: Graphs,Networks,Social Networks,Social Sciences — Patrick Durusau @ 9:26 pm

Georgia Tech CS 8803-CSS: Computational Social Science by Jacob Eisenstein

From the webpage:

The principle aim for this graduate seminar is to develop a broad understanding of the emerging cross-disciplinary field of Computational Social Science. This includes:

  • Methodological foundations in network and content analysis: understanding the mathematical basis for these methods, as well as their practical application to real data.
  • Best practices and limitations of observational studies.
  • Applications to political science, sociolinguistics, sociology, psychology, economics, and public health.

Consider this as an antidote to the “everything’s a graph, so let’s go” type approach.

Useful application of graph or network analysis requires a bit more than enthusiasm for graphs.

Just scanning the syllabus, devoting serious time to the readings will give you a good start on the skills required to be useful with network analysis.

I first saw this in a tweet by Jacob Eisenstein.

March 10, 2013

Cool GSS training video! And cumulative file 1972-2012!

Filed under: Dataset,Social Sciences,Socioeconomic Data — Patrick Durusau @ 8:42 pm

Cool GSS training video! And cumulative file 1972-2012! by Andrew Gelman.

From the post:

Felipe Osorio made the above video to help people use the General Social Survey and R to answer research questions in social science. Go for it!

From the GSS: General Social Survey website:

The General Social Survey (GSS) conducts basic scientific research on the structure and development of American society with a data-collection program designed to both monitor societal change within the United States and to compare the United States to other nations.

The GSS contains a standard ‘core’ of demographic, behavioral, and attitudinal questions, plus topics of special interest. Many of the core questions have remained unchanged since 1972 to facilitate time-trend studies as well as replication of earlier findings. The GSS takes the pulse of America, and is a unique and valuable resource. It has tracked the opinions of Americans over the last four decades.

The information “gap” is becoming more of a matter of skill than access to underlying data.

How would you match the GSS data up to other data sets?

January 18, 2013

Computational Folkloristics

Filed under: Digital Research,Folklore,Social Sciences — Patrick Durusau @ 7:17 pm

JAF Special Issue 2014 : Computational Folkloristics – Special Issue of the Journal of American Folklore

I wasn’t able to confirm this call at the Journal of American Folklore, but wanted to pass it along anyway.

There are few areas with the potential for semantic mappings as rich as folklore. A natural for topic maps.

From the call I cite above:

Submission Deadline Jun 15, 2013
Notification Due Aug 1, 2013
Final Version Due Oct 1, 2013

Over the course of the past decade, a revolution has occurred in the materials available for the study of folklore. The scope of digital archives of traditional expressive forms has exploded, and the magnitude of machine-readable materials available for consideration has increased by many orders of magnitude. Many national archives have made significant efforts to make their archival resources machine-readable, while other smaller initiatives have focused on the digitization of archival resources related to smaller regions, a single collector, or a single genre. Simultaneously, the explosive growth in social media, web logs (blogs), and other Internet resources have made previously hard to access forms of traditional expressive culture accessible at a scale so large that it is hard to fathom. These developments, coupled to the development of algorithmic approaches to the analysis of large, unstructured data and new methods for the visualization of the relationships discovered by these algorithmic approaches – from mapping to 3-D embedding, from time-lines to navigable visualizations – offer folklorists new opportunities for the analysis of traditional expressive forms. We label approaches to the study of folklore that leverage the power of these algorithmic approaches “Computational Folkloristics” (Abello, Broadwell, Tangherlini 2012).

The Journal of American Folklore invites papers for consideration for inclusion in a special issue of the journal edited by Timothy Tangherlini that focuses on “Computational Folkloristics.” The goal of the special issue is to reveal how computational methods can augment the study of folklore, and propose methods that can extend the traditional reach of the discipline. To avoid confusion, we term those approaches “computational” that make use of algorithmic methods to assist in the interpretation of relationships or structures in the underlying data. Consequently, “Computational Folkloristics” is distinct from Digital Folklore in the application of computation to a digital representation of a corpus.

We are particularly interested in papers that focus on: the automatic discovery of narrative structure; challenges in Natural Language Processing (NLP) related to unlabeled, multilingual data including named entity detection and resolution; topic modeling and other methods that explore latent semantic aspects of a folklore corpus; the alignment of folklore data with external historical datasets such as census records; GIS applications and methods; network analysis methods for the study of, among other things, propagation, community detection and influence; rapid classification of unlabeled folklore data; search and discovery on and across folklore corpora; modeling of folklore processes; automatic labeling of performance phenomena in visual data; automatic classification of audio performances. Other novel approaches to the study of folklore that make use of algorithmic approaches will also be considered.

A significant challenge of this special issue is to address these issues in a manner that is directly relevant to the community of folklorists (as opposed to computer scientists). Articles should be written in such a way that the argument and methods are accessible and understandable for an audience expert in folklore but not expert in computer science or applied mathematics. To that end, we encourage team submissions that bridge the gap between these disciplines. If you are in doubt about whether your approach or your target domain is appropriate for consideration in this special issue, please email the issue editor, Timothy Tangherlini at tango@humnet.ucla.edu, using the subject line “Computational Folkloristics query”. Deadline for all queries is April 1, 2013.

Timothy Tangherlini homepage.

Something to look forward to!

July 2, 2012

One Culture. Computationally Intensive Research in the Humanities and Social Sciences…

Filed under: Humanities,Social Sciences — Patrick Durusau @ 5:45 pm

One Culture. Computationally Intensive Research in the Humanities and Social Sciences, A Report on the Experiences of First Respondents to the Digging Into Data Challenge by Christa Williford and Charles Henry. Research Design by Amy Friedlander.

From the webpage:

This report culminates two years of work by CLIR staff involving extensive interviews and site visits with scholars engaged in international research collaborations involving computational analysis of large data corpora. These scholars were the first recipients of grants through the Digging into Data program, led by the NEH, who partnered with JISC in the UK, SSHRC in Canada, and the NSF to fund the first eight initiatives. The report introduces the eight projects and discusses the importance of these cases as models for the future of research in the academy. Additional information about the projects is provided in the individual case studies below (this additional material is not included in the print or PDF versions of the published report).

Main Report Online

or

PDF file.

Case Studies:

Humanists played an important role the development of digital computers. That role has diminished over time to the disadvantage of both humanists and computer scientists. Perhaps efforts such as this one will rekindle what was once a rich relationship.

Powered by WordPress