Another Word For It Patrick Durusau on Topic Maps and Semantic Diversity

December 31, 2016

Good visualizations optimize for the human visual system

Filed under: Interface Research/Design,Visualization — Patrick Durusau @ 8:30 pm

How Humans See Data by John Rauser.

Apologies to John for stepping on his title but at time mark 3:26, he says:

Good visualizations optimize for the human visual system.

That one insight sets a basis for distinguishing between good visualizations and bad ones.

Do watch the rest of the video, it is all as good as that moment.

What’s your favorite moment?

From the description:

John Rauser explains a few of the most important results from research into the functioning of the human visual system and the question of how humans decode information presented in graphical form. By understanding and applying this research when designing statistical graphics, you can simplify difficult analytical tasks as much as possible.

Links:

R/GGplot2 code for all plots in presentation.

Slides for Good visualizations optimize for the human visual system

Graphical Perception and Graphical Methods for Analyzing Scientific Data by William S. Cleveland and Robert McGill. (cited in the presentation)

The Elements of Graphing Data by William S. Cleveland. (also cited in the presentation)

GRASS GIS [Protest Tools]

Filed under: GIS,GRASS GIS,Mapping,Maps,Protests — Patrick Durusau @ 5:28 pm

GRASS GIS is very relevant for anyone wanting to use data science to plan protests.

You can plan a protest using corner store maps, but those are unlikely to have alleys, bus stops, elevation, litter cans, utilities, and other details.

Other participants will have all that data and more so evening up the odds is a good idea.

Apologizes for the long quote but I don’t know which features/capabilities of GRASS GIS will be most immediately relevant for you.

From the general overview page:

General Information

Geographic Resources Analysis Support System, commonly referred to as GRASS GIS, is a Geographic Information System (GIS) used for data management, image processing, graphics production, spatial modelling, and visualization of many types of data. It is Free (Libre) Software/Open Source released under GNU General Public License (GPL) >= V2. GRASS GIS is an official project of the Open Source Geospatial Foundation.

Originally developed by the U.S. Army Construction Engineering Research Laboratories (USA-CERL, 1982-1995, see history of GRASS 1.0-4.2 and 5beta), a branch of the US Army Corp of Engineers, as a tool for land management and environmental planning by the military, GRASS GIS has evolved into a powerful utility with a wide range of applications in many different areas of applications and scientific research. GRASS is currently used in academic and commercial settings around the world, as well as many governmental agencies including NASA, NOAA, USDA, DLR, CSIRO, the National Park Service, the U.S. Census Bureau, USGS, and many environmental consulting companies.

The GRASS Development Team has grown into a multi-national team consisting of developers at numerous locations.

In September 2006, the GRASS Project Steering Commitee was formed which is responsible for the overall management of the project. The PSC is especially responsible for granting SVN write access.

General GRASS GIS Features

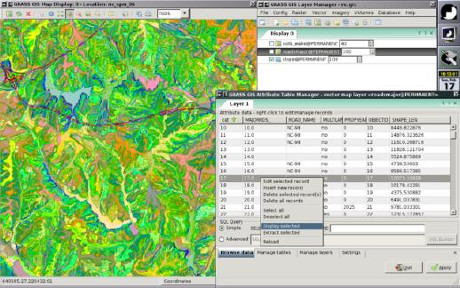
GRASS GIS contains over 350 modules to render maps and images on monitor and paper; manipulate raster, and vector data including vector networks; process multispectral image data; and create, manage, and store spatial data. GRASS GIS offers both an intuitive graphical user interface as well as command line syntax for ease of operations. GRASS GIS can interface with printers, plotters, digitizers, and databases to develop new data as well as manage existing data.

grass6_wxgui-attrib_manager_small-460

GRASS GIS and support for teams

GRASS GIS supports workgroups through its LOCATION/MAPSET concept which can be set up to share data and the GRASS installation itself over NFS (Network File System) or CIFS. Keeping LOCATIONs with their underlying MAPSETs on a central server, a team can simultaneously work in the same project database.

GRASS GIS capabilities

  • Raster analysis: Automatic rasterline and area to vector conversion, Buffering of line structures, Cell and profile dataquery, Colortable modifications, Conversion to vector and point data format, Correlation / covariance analysis, Expert system analysis , Map algebra (map calculator), Interpolation for missing values, Neighbourhood matrix analysis, Raster overlay with or without weight, Reclassification of cell labels, Resampling (resolution), Rescaling of cell values, Statistical cell analysis, Surface generation from vector lines
  • 3D-Raster (voxel) analysis: 3D data import and export, 3D masks, 3D map algebra, 3D interpolation (IDW, Regularised Splines with Tension), 3D Visualization (isosurfaces), Interface to Paraview and POVray visualization tools
  • Vector analysis: Contour generation from raster surfaces (IDW, Splines algorithm), Conversion to raster and point data format, Digitizing (scanned raster image) with mouse, Reclassification of vector labels, Superpositioning of vector layers
  • Point data analysis: Delaunay triangulation, Surface interpolation from spot heights, Thiessen polygons, Topographic analysis (curvature, slope, aspect), LiDAR
  • Image processing: Support for aerial and UAV images, satellite data (optical, radar, thermal), Canonical component analysis (CCA), Color composite generation, Edge detection, Frequency filtering (Fourier, convolution matrices), Fourier and inverse fourier transformation, Histogram stretching, IHS transformation to RGB, Image rectification (affine and polynomial transformations on raster and vector targets), Ortho photo rectification, Principal component analysis (PCA), Radiometric corrections (Fourier), Resampling, Resolution enhancement (with RGB/IHS), RGB to IHS transformation, Texture oriented classification (sequential maximum a posteriori classification), Shape detection, Supervised classification (training areas, maximum likelihood classification), Unsupervised classification (minimum distance clustering, maximum likelihood classification)
  • DTM-Analysis: Contour generation, Cost / path analysis, Slope / aspect analysis, Surface generation from spot heigths or contours
  • Geocoding: Geocoding of raster and vector maps including (LiDAR) point clouds
  • Visualization: 3D surfaces with 3D query (NVIZ), Color assignments, Histogram presentation, Map overlay, Point data maps, Raster maps, Vector maps, Zoom / unzoom -function
  • Map creation: Image maps, Postscript maps, HTML maps
  • SQL-support: Database interfaces (DBF, SQLite, PostgreSQL, mySQL, ODBC)
  • Geostatistics: Interface to “R” (a statistical analysis environment), Matlab, …
  • Temporal framework: support for time series analysis to manage, process and analyse (big) spatio-temporal environmental data. It supports querying, map calculation, aggregation, statistics and gap filling for raster, vector and raster3D data. A temporal topology builder is available to build spatio-temporal topology connections between map objects for 1D, 3D and 4D extents.
  • Furthermore: Erosion modelling, Landscape structure analysis, Solution transport, Watershed analysis.

See also the Applications page in the Wiki and the Wikipedia entry.

Getting Started in Open Source: A Primer for Data Scientists

Filed under: Data Science,Open Source — Patrick Durusau @ 4:26 pm

Getting Started in Open Source: A Primer for Data Scientists by Rebecca Bilbro.

From the post:

The phrase "open source” evokes an egalitarian, welcoming niche where programmers can work together towards a common purpose — creating software to be freely available to the public in a community that sees contribution as its own reward. But for data scientists who are just entering into the open source milieu, it can sometimes feel like an intimidating place. Even experienced, established open source developers like Jon Schlinkert have found the community to be less than welcoming at times. If the author of more than a thousand projects, someone whose scripts are downloaded millions of times every month, has to remind himself to stay positive, you might question whether the open source community is really the developer Shangri-la it would appear to be!

And yet, open source development does have a lot going for it:

  • Users have access to both the functionality and the methodology of the software (as opposed to just the functionality, as with proprietary software).
  • Contributors are also users, meaning that contributions track closely with user stories, and are intrinsically (rather than extrinsically) motivated.
  • Everyone has equal access to the code, and no one is excluded from making changes (at least locally).
  • Contributor identities are open to the extent that a contributor wants to take credit for her work.
  • Changes to the code are documented over time.

So why start a blog post for open source noobs with a quotation from an expert like Jon, especially one that paints such a dreary picture? It's because I want to show that the bar for contributing is… pretty low.

Ask yourself these questions: Do you like programming? Enjoy collaborating? Like learning? Appreciate feedback? Do you want to help make a great open source project even better? If your answer is 'yes' to one or more of these, you're probably a good fit for open source. Not a professional programmer? Just getting started with a new programming language? Don't know everything yet? Trust me, you're in good company.

Becoming a contributor to an open source project is a great way to support your own learning, to get more deeply involved in the community, and to share your own unique thoughts and ideas with the world. In this post, we'll provide a walkthrough for data scientists who are interested in getting started in open source — including everything from version control basics to advanced GitHub etiquette.

Two of Rebecca’s points are more important than the rest:

  • the bar for contributing is low
  • contributing builds community and a sense of ownership

Will 2017 be the year you move from the sidelines of open source and into the game?

Guarantees Of Public Access In Trump Administration (A Perfect Data Storm)

Filed under: Government,Journalism,News,Open Access,Open Data,Open Government,Reporting — Patrick Durusau @ 3:57 pm

I read hand wringing over the looming secrecy of the Trump administration on a daily basis.

More truthfully, I skip over daily hand wringing over the looming secrecy of the Trump administration.

For two reasons.

First, as reported in US government subcontractor leaks confidential military personnel data by Charlie Osborne, government data doesn’t require hacking, just a little initiative.

In this particular case, it was rsync without a username or password, that made this data leak possible.

Editors should ask their reporters before funding FOIA suits: “Have you tried rsync?”

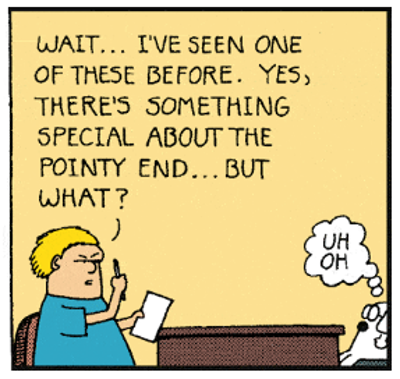
Second, the alleged-to-be-Trump-nominees for cabinet and lesser positions, remind me of this character from Dilbert: November 2, 1992:

pointy-end-dilbert-400

Trump appointees may have mastered the pointy end of pencils but their ability to use cyber-security will be as shown.

When you add up the cyber-security incompetence of Trump appointees, complaints from Inspector Generals about agency security, and agencies leaking to protect their positions/turf, you have the conditions for a perfect data storm.

A perfect data storm that may see the US government hemorrhaging data like never before.

PS: You know my preference, post leaks on receipt in their entirety. As for “consequences,” consider those a down payment on what awaits people who betray humanity, their people, colleagues and family. They could have chosen differently and didn’t. What more can one say?

The best of Lower Case 2016 (CJR)

Filed under: Humor,Journalism,News,Reporting — Patrick Durusau @ 2:45 pm

The best of Lower Case 2016

From the post:

IF WE HAD TO PICK ONE CJR tradition in particular that has survived and thrived in the digital age, it’s The Lower Case, our weekly look at unfortunate, cringe-worthy, or ironic headlines.

It turns out headlines can be just as awkward and occasionally inappropriate on digital stories and social-media posts, even though these days we have to catch them before a sneaky editor covers up the evidence (alas, there’s no more paper trail). Luckily, our readers continue to help us out, delivering screenshots of Lower Case offenders to our inbox at editors@cjr.org.

The editors who wrote these headlines probably would prefer a do-over, but they should take heart: All of us can all learn from headlines gone wrong, and hopefully enjoy a chuckle in the process. Here are some highlights from 2016, including classics from the archives:
…(emphasis in original)

A column you defend to friends by saying: “I read other parts of the CJR too!”

😉

Enjoy!

December 30, 2016

KML Documentation Introduction

Filed under: Google Earth,Google Maps,KML,Protests — Patrick Durusau @ 8:01 pm

KML Documentation Introduction

From the webpage:

If you’re new to KML, begin by browsing the KML Tutorial, which presents short samples of KML code that you can view in Google Earth.

The KML Reference provides detailed syntax for all KML elements, with explanations and diagrams of how to specify them.

The Developer’s Guide contains in-depth conceptual material and examples.

Creating and Sharing KML Files

You can create KML files with the Google Earth user interface, or you can use an XML or simple text editor to enter “raw” KML from scratch. KML files and their related images (if any) can be compressed using the ZIP format into KMZ archives. To share your KML and KMZ files, you can e-mail them, host them locally for sharing within a private internet, or host them publicly on a web server. Just as web browsers display HTML files, Earth browsers such as Google Earth display KML files. Once you’ve properly configured your server and shared the URL (address) of your KML files, anyone who’s installed Google Earth can view the KML files hosted on your public web server.

Many applications display KML, including Google Earth, NASA WorldWind, ESRI ArcGIS Explorer, Adobe PhotoShop, AutoCAD, and Yahoo! Pipes.

As a result of my data gathering on protests, I have acquired several GBs of KML files and links to many more.

Other resources you would suggest for coming up to speed on KML?

Thanks!

Data Science, Protests and the Washington Metro – Feasibility

Filed under: Data Science,Politics,Protests — Patrick Durusau @ 4:54 pm

Steven Nelson writes of plans to block DC traffic:


Protest plans often are overambitious and it’s unclear if there will be enough bodies or sacrificial vehicles to block roadways, or people willing to risk arrest by doing so, though Carrefour says the group has coordinated housing for a large number of out-of-town visitors and believes preliminary signs point to massive turnout.
….(Anti-Trump Activists Plan Road-Blocking ‘Clusterf–k’ for Inauguration)

Looking at a map of the ninety-one (91) Metro rail stations, you may feel discouragement at Steven’s question of “enough bodies or sacrificial vehicles to block roadways….”

www-wmata-com-rail-stations-460

(Screenshot of map from https://www.wmata.com/schedules/maps/, Rail maps selected, 30 December 2016.)

Steve’s question and data science

Steven’s question is a good one and it’s one data science and public data can address.

For a feel of the larger problem of blockading all 91 Metro Rail stations, download and view/print this color map of Metro stations from the Washington Metropolitan Area Transit Authority.

For every station where you don’t see:

metro-parking-460

you will need to move protesters to those locations. As you already know, moving protesters in a coordinated way is a logistical and resource intensive task.

Just so you know, there are forty-three (43) stations with no parking lots.

Data insight: If you look at the Metro Rail map: color map of Metro stations, you will notice that all the stations with parking are located at the outer stations of the Metro.

That’s no accident. The Metro Rail system is designed to move people into and out of the city, which of necessity means, if you block access to the stations with parking lots, you have substantially impeded access into the city.

Armed with that insight, the total of Metro Rail stations to be blocked drops to thirty-eight (38). Not a great number but less than half of the starting 91.

Blocking 38 Metro Rail Stations Still Sounds Like A Lot

You’re right.

Blocking all 38 Metro Rail stations with parking lots is a protest organizer’s pipe dream.

It’s in keeping with seeing themselves as proclaiming “Peace! Land! Bread!” to huddled masses.

Data science and public data won’t help block all 38 stations but it can help with strategic selection of stations based on your resources.

Earlier this year, Dan Malouff posted: All 91 Metro stations, ranked by ridership.

If you put that data into a spreadsheet, eliminate the 43 stations with no parking lots, you can then sort the parking lot stations by their daily ridership.

Moreover, you can keep a running total of the riders in order to calculate the percentage of Metro Rail riders blocked (assuming 100% blockage) as you progress down the list of stations.

The total daily ridership for those stations is 183,535.

You can review my numbers and calculations with a copy of Metro-Rail-Ridership-Station-Percentage.xls

Strategic Choice of Metro Rail Stations

Consider this excerpt from the spreadsheet:

Station Avg. # Count % of Total.
Silver Spring 12269 12269 6.68%
Shady Grove 11732 24001 13.08%
Vienna 10005 34006 18.53%
Fort Totten 7543 41549 22.64%
Wiehle 7306 48855 26.62%
New Carrollton 7209 56064 30.55%
Huntington 7002 63066 34.36%
Franconia-Springfield 6821 69887 38.08%
Anacostia 6799 76686 41.78%
Glenmont 5881 82567 44.99%
Greenbelt 5738 88305 48.11%
Rhode Island Avenue 5727 94032 51.23%
Branch Avenue 5449 99481 54.20%
Takoma 5329 104810 57.11%
Grosvenor 5206 110016 59.94%

The average ridership as reported by Dan Malouff in All 91 Metro stations, ranked by ridership comes to: 652,183. Of course, that includes people who rode from one station to transfer to another one. (I’m investigating ways/data to separate those out.)

As you can see, blocking only the first four stations Silver Spring, Shady Grove, Vienna and Fort Totten, is almost 23% of the traffic from stations with parking lots. It’s not quite 10% of the total ridership on a day but certainly noticeable.

The other important point to notice is that with public data and data science, the problem has been reduced from 91 potential stations to 4.

A reduction of more than an order of magnitude.

Not a bad payoff for using public data and data science.


That’s all I have for you now, but I can promise that deeper analysis of metro DC public data sets reveals event locations that impact both the “beltway” as well as Metro Rail lines.

More on that and maps for the top five (5) locations, a little over 25% of the stations with parking traffic, next week!

If you can’t make it to #DisruptJ20 protests, want to protest early or want to support research on data science and protests, consider a donation.

Disclaimer: I am exploring the potential of data science for planning protests. What you choose to do or not to do and when, is entirely up to you.

December 29, 2016

Continuous Unix commit history from 1970 until today

Filed under: Computer Science,Linux OS — Patrick Durusau @ 5:49 pm

Continuous Unix commit history from 1970 until today

From the webpage:

The history and evolution of the Unix operating system is made available as a revision management repository, covering the period from its inception in 1970 as a 2.5 thousand line kernel and 26 commands, to 2016 as a widely-used 27 million line system. The 1.1GB repository contains about half a million commits and more than two thousand merges. The repository employs Git system for its storage and is hosted on GitHub. It has been created by synthesizing with custom software 24 snapshots of systems developed at Bell Labs, the University of California at Berkeley, and the 386BSD team, two legacy repositories, and the modern repository of the open source FreeBSD system. In total, about one thousand individual contributors are identified, the early ones through primary research. The data set can be used for empirical research in software engineering, information systems, and software archaeology.

You can read more details about the contents, creation, and uses of this repository through this link.

Two repositories are associated with the project:

  • unix-history-repo is a repository representing a reconstructed version of the Unix history, based on the currently available data. This repository will be often automatically regenerated from scratch, so this is not a place to make contributions. To ensure replicability its users are encouraged to fork it or archive it.
  • unix-history-make is a repository containing code and metadata used to build the above repository. Contributions to this repository are welcomed.

Not everyone will find this exciting but this rocks as a resource for:

empirical research in software engineering, information systems, and software archaeology

Need to think seriously about putting this on a low-end laptop and sealing it up in a Faraday cage.

Just in case. 😉

Flashing/Mooning Data Collection Worksheet Instructions

Filed under: Data Collection,Politics,Protests — Patrick Durusau @ 4:56 pm

President-elect Trump’s inauguration will be like no other. To assist with collecting data on flashing/mooning of Donald Trump on January 20, 2017, I created:

Trump Inauguration 2017: Flashing/Mooning Worksheet Instructions

It captures:

  1. Location
  2. Time Period
  3. Flash/Moon Count
  4. Gender (M/F) Count (if known)

I’ve tried to keep it simple because at most locations, it will be hard to open your eyes not see flashing/mooning.

You’ve seen photo-flashes are almost stroboscopic? That’s close the anticipated rate of flashing/mooning at the Trump inauguration.

The Trump inauguration may turn into an informal competition between rival blocks of flashing/mooning.

Without flashing/mooning data, how can Bob Costas do color commentary at the 2021 inauguration?

Let’s help Bob out and collect that flashing/mooning data in 2017!

Thanks! Please circulate the worksheet and references to this post.

December 28, 2016

Washington Taxi Data 2015 – 2016 (Caution: 2.2 GB File Size)

Filed under: Data,Government — Patrick Durusau @ 9:22 pm

I was rummaging around on the Opendata.dc.gov website today when I encountered Taxicab Trips (2.2 GB), described as:

DC Taxicab trip data from April 2015 to August 2016. Pick up and drop off locations are assigned to block locations with times rounded to the nearest hour. Detailed metadata included in download.The Department of For-Hire Vehicles (DFHV) provided OCTO with a taxicab trip text file representing trips from May 2015 to August 2016. OCTO processed the data to assign block locations to pick up and drop off locations.

For your convenience, I extracted README_DC_Taxicab_trip.txt and it gives the data structure of the files (“|” separated) as follows:

TABLE STRUCTURE:

COLUMN_NAME	DATA_TYPE	DEFINITION	   
OBJECTID	NUMBER(9)	Table Unique Identifier	   
TRIPTYPE	VARCHAR2(255)	Type of Taxi Trip	   
PROVIDER	VARCHAR2(255)	Taxi Company that Provided trip	   
METERFARE	VARCHAR2(255)	Meter Fare	   
TIP	VARCHAR2(255)	Tip amount	   
SURCHARGE	VARCHAR2(255)	Surcharge fee	   
EXTRAS	VARCHAR2(255)	Extra fees	   
TOLLS	VARCHAR2(255)	Toll amount	   
TOTALAMOUNT	VARCHAR2(255)	Total amount from Meter fare, tip, 
                                surcharge, extras, and tolls. 	   
PAYMENTTYPE	VARCHAR2(255)	Payment type	   
PAYMENTCARDPROVIDER	VARCHAR2(255)	Payment card provider	   
PICKUPCITY	VARCHAR2(255)	Pick up location city	   
PICKUPSTATE	VARCHAR2(255)	Pick up location state	   
PICKUPZIP	VARCHAR2(255)	Pick up location zip	   
DROPOFFCITY	VARCHAR2(255)	Drop off location city	   
DROPOFFSTATE	VARCHAR2(255)	Drop off location state	   
DROPOFFZIP	VARCHAR2(255)	Drop off location zip	   
TRIPMILEAGE	VARCHAR2(255)	Trip milaege	   
TRIPTIME	VARCHAR2(255)	Trip time	   
PICKUP_BLOCK_LATITUDE	NUMBER	Pick up location latitude	   
PICKUP_BLOCK_LONGITUDE	NUMBER	Pick up location longitude	   
PICKUP_BLOCKNAME	VARCHAR2(255)	Pick up location street block name	   
DROPOFF_BLOCK_LATITUDE	NUMBER	Drop off location latitude	   
DROPOFF_BLOCK_LONGITUDE	NUMBER	Drop off location longitude	   
DROPOFF_BLOCKNAME	VARCHAR2(255)	Drop off location street block name	   
AIRPORT	CHAR(1)	Pick up or drop off location is a local airport (Y/N)	   
PICKUPDATETIME_TR	DATE	Pick up location city	   
DROPOFFDATETIME_TR	DATE	Drop off location city	 

The taxi data files are zipped by the month:

Archive:  taxitrip2015_2016.zip
  Length      Date    Time    Name
---------  ---------- -----   ----
107968907  2016-11-29 14:27   taxi_201511.zip
117252084  2016-11-29 14:20   taxi_201512.zip
 99545739  2016-11-30 11:15   taxi_201601.zip
129755310  2016-11-30 11:24   taxi_201602.zip
152793046  2016-11-30 11:31   taxi_201603.zip
148835360  2016-11-30 11:20   taxi_201604.zip
143734132  2016-11-30 11:19   taxi_201605.zip
139396173  2016-11-30 11:13   taxi_201606.zip
121112859  2016-11-30 11:08   taxi_201607.zip
104015666  2016-11-30 12:04   taxi_201608.zip
154623796  2016-11-30 11:03   taxi_201505.zip
161666797  2016-11-29 14:15   taxi_201506.zip
153483725  2016-11-29 14:32   taxi_201507.zip
121135328  2016-11-29 14:06   taxi_201508.zip
142098999  2016-11-30 10:55   taxi_201509.zip
160977058  2016-11-30 10:35   taxi_201510.zip
     3694  2016-12-09 16:43   README_DC_Taxicab_trip.txt

I extracted taxi_201601.zip, decompressed it and created a 10,000 line sample, named taxi-201601-10k.ods.

I was hopeful that taxi trip times might allow inference of traffic conditions but with rare exceptions, columns AA and AB record the same time.

Rats!

I’m sure there are other patterns you can extract from the data but inferring traffic conditions doesn’t appear to be one of those.

Or am I missing something obvious?

More posts about Opendata.dc.gov coming as I look for blockade information.

PS: I didn’t explore any month other than January of 2016, but it’s late and I will tend to that tomorrow.

Blockading Washington – #DisruptJ20 – Unusual Tactic – Nudity

Filed under: Government,Politics — Patrick Durusau @ 5:47 pm

Among the more unusual reports of blockading traffic is this report from Tampa, Florida.

Surveillance shows naked man’s rampage on Dale Mabry.

A total of ten police cars responded and traffic was interrupted.

The current prediction for Washington, D.C. on 20 January 2017 is:

Low: 14 to 24F

High: 34 to 44F

If you use nudity to disrupt traffic, have a warm coat nearby.

Tweet a pic with an estimate of how many cars you stopped. 😉

@patrickDurusau

If traffic jamming with nudity isn’t your thing, more serious suggestions to follow using data science to enable effective protesting.

December 27, 2016

Your first steps with JOSM… [Mapping/Planning Disruption]

Filed under: MapBox,Maps,Open Street Map — Patrick Durusau @ 9:31 pm

Your first steps with JOSM – the Java OpenStreetMap editor by Ramya Ragupathy.

From the post:

OpenStreetMap’s web-based iD editor is the easiest and most convenient way to get started mapping. But there may come a time when you need more power – our mapping team uses the Java OpenStreetMap (JOSM) editor every day. JOSM allows you to map fast with keyboard shortcuts, a series of editing tools for common tasks and specialized plugins. Here is your guide to take your mapping skills to the next level.

I had to grin when I saw the advice:

Connect a two-button mouse to your computer to make working with JOSM easier.

At present I have an IBM trackpad keyboard, a Kensington Expert Mouse (roller ball) and a two-button scrolling mouse, all connected to the same box.

JOSM is probably too much for me to master for a mapping/planning disruption project I have underway but it is high on my next to master list.

Of course, you should avoid updating a public map with your planned disruption points, unless even with notice your disruption cannot be prevented.

Enjoy!

AnonUK Radio

Filed under: Government,Politics — Patrick Durusau @ 9:04 pm

AnonUK Radio

From the webpage:

Welcome to AnonUK Radio. Social media and citizen journalism is arguably how the majority of people discover their news these days. We hope this site provides all the information you need to keep up with the Radio, current operations both globally and in the UK, get involved with protests both online and offline.

Every day at 21 GMT, 9 PM BST, 4 PM EST.

Enjoy!

December 26, 2016

Reflecting on Haskell in 2016

Filed under: Functional Programming,Haskell — Patrick Durusau @ 9:01 pm

Reflecting on Haskell in 2016 by Stephen Diehl.

From the post:

Well, 2016 … that just happened. About the only thing I can put in perspective at closing of this year is progress and innovation in Haskell ecosystem. There was a lot inspiring work and progress that pushed the state of the art forward.

This was a monumental year of Haskell in production. There were dozens of talks given about success stories with an unprecedented amount of commercially funded work from small startups to international banks. Several very honest accounts of the good and the bad were published, which gave us a rare glimpse into what it takes to plant Haskell in a corporate environment and foster it’s growth.

If you are at all interested in Haskell and/or functional programming, don’t miss this collection of comments and links. It will save you hours of surfing, looking for equivalent content.

December 25, 2016

A people’s history of the United States [A Working Class Winter Is Coming]

Filed under: Government,History,Politics — Patrick Durusau @ 8:34 pm

A people’s history of the United States by Howard Zinn.

From the webpage:

The full text of Howard Zinn’s superb people’s history of the United States, spanning over 500 years from Columbus’s “discovery” of America in 1492 to the Clinton presidency in 1996.

I think this is the first edition text (1980), which has been updated and can be purchased here.

Be sure to visit/use (either personally or for teaching): Teaching A People’s History:


Its goal is to introduce students to a more accurate, complex, and engaging understanding of United States history than is found in traditional textbooks and curricula. The empowering potential of studying U.S. history is often lost in a textbook-driven trivial pursuit of names and dates. People’s history materials and pedagogy emphasize the role of working people, women, people of color, and organized social movements in shaping history. Students learn that history is made not by a few heroic individuals, but instead by people’s choices and actions, thereby also learning that their own choices and actions matter.

Buy the book, share it and the website as widely as possible.

A working class winter is coming.

December 24, 2016

Russian Comfort Food For Clinton Supporters

Filed under: Cybersecurity,Hillary Clinton,Politics — Patrick Durusau @ 9:20 pm

Just in time for Christmas, CrowdStrike published:

Use of Fancy Bear Android Malware in Tracking of Ukranian Field Artillery Units

Anti-Russian Propaganda

The cover art reminds me of the “Better Dead than Red” propaganda from deep inside the Cold War.

crowdstrike-fancy-bear-460

Compare that with an anti-communist poster from 1953:

1953-poster-6241f-460

Anonymous, [ANTI-COMMUNIST POSTER SHOWING RUSSIAN SOLDIER AND JOSEPH STALIN STANDING OVER GRAVES IN FOREGROUND; CANNONS AND PEOPLE MARCHING TO SIBERIA IN BACKGROUND] (1953) courtesy of Library of Congress [LC-USZ62-117876].

Notice any similarities? Sixty-three years separate those two images and yet the person who produced the second one would immediately recognize the first one. And vice versa.

Apparently, July Woodruff, who interviewed Dmitri Alperovitch, co- founder of CrowdStrike, and Thomas Rid, a professor at King’s College London for Security company releases new evidence of Russian role in DNC hack (PBS Fake News Hour), didn’t bother to look at the cover of the report covered by her “interview.”

Not commenting on Judy’s age but noting the resemblance to 1950’s and 1960’s anti-communist propaganda would be obvious to anyone in her graduating class.

Evidence or Rather the Lack of Evidence

Leaving aside Judy’s complete failure to notice this is anti-Russian propaganda by its cover, let’s compare the “evidence” Judy discusses with Alperovich:

[Judy Woodruff]

Dmitri Alperovitch, let me start with you. What is this new information?

DMITRI ALPEROVITCH, CrowdStrike: Well, this is an interesting case we’ve uncovered actually all the way in Ukraine where Ukraine artillerymen were targeted by the same hackers who were called Fancy Bear, that targeted the DNC, but this time, they were targeting their cell phones to understand their location so that the Russian military and Russian artillery forces can actually target them in the open battle.

JUDY WOODRUFF: So, this is Russian military intelligence who got hold of information about the weapons, in essence, that the Ukrainian military was using, and was able to change it through malware?

DMITRI ALPEROVITCH: Yes, essentially, one Ukraine officer built this app for his Android phone that he gave out to his fellow officers to control the settings for the artillery pieces that they were using, and the Russians actually hacked that application, put their malware in it and that malware reported back the location of the person using the phone.

JUDY WOODRUFF: And so, what’s the connection between that and what happened to the Democratic National Committee?

DMITRI ALPEROVITCH: Well, the interesting is that it was the same variant of the same malicious code that we have seen at the DNC. This was a phone version. What we saw at the DNC was personal computers, but essentially, it was the same source used by this actor that we call Fancy Bear.

And when you think about, well, who would be interested in targeting Ukraine artillerymen in eastern Ukraine who has interest in hacking the Democratic Party, Russia government comes to find, but specifically, Russian military that would have operational over forces in the Ukraine and would target these artillerymen.

JUDY WOODRUFF: So, just quickly, in the sense, these are like cyber fingerprints? Is that what we’re talking about?

DMITRI ALPEROVITCH: Essentially the DNA of this malicious code that matches to the DNA that we saw at the DNC.

That may sound compelling, at least until you read the Crowdstrike report. Which unlike Judy/PBS, I include a link for you to review it for yourself: Use of Fancy Bear Android Malware in Tracking of Ukranian Field Artillery Units.

The report consists of a series of un-numbered pages, but in order:

Coverpage: (the anti-Russian artwork)

Key Points: Conclusions without evidence (1 page)

Background: Repetition of conclusions (1 page)

Timelines: No real relationship to the question of malware (2 pages)

Timeline of Events: Start of prose that might contain “evidence” (6 pages)

OK, let’s take:

the Russians actually hacked that application, put their malware in it and that malware reported back the location of the person using the phone.

as an example.

Contrary to his confidence in the interview, page 7 of the report says:


Crowdstrike has discovered indications that as early as 2015 FANCY BEAR likely developed X-Agent applications for the iOS environment, targeting “jailbroken” Apple mobile devices. The use of the X-Agent implant in the original Попр-Д30.apk application appears to be the first observed case of FANCY BEAR malware developed for the Android mobile platform. On 21 December 2014 the malicious variant of the Android application was first observed in limited public distribution on a Russian language, Ukrainian military forum. A late 2014 public release would place the development timeframe for this implant sometime between late-April 2013 and early December 2014.

I’m sorry, but do you see any evidence in “…indications…” and/or “likely developed…?”

It’s a different way of restating what you saw in the Key Points and Background, but otherwise, it’s simply repetition of Crowdstrike’s conclusions.

That’s ok if you already agree with Crowdstrike’s conclusions, I suppose, but it should be deeply unsatisfying for a news reporter.

Judy Woodruff should have said:

Imagined question from Woodruff:

I understand your report says Fancy Bear is connected with this malware but you don’t state any facts on which you base that conclusion. Is there another report our listeners can review for those details?

If you see that question in the transcript ping me. I missed it.

What About Calling the NSA?

If Woodruff had even a passing acquaintance with Clifford Stoll’s Cuckoo’s Egg (tracing a hacker from a Berkeley computer to a home in Germany), she could have asked:

Thirty years ago, Clifford Stoll wrote in the Cuckoo’s Egg about the tracking of a hacker from a computer in Berkeley to his home in Germany. Crowdstrike claims to have caught the hackers “red handed”.

The internet has grown more complicated in thirty years and tracking more difficult. Why didn’t Crowdstrike ask for help from the NSA in tracking those hackers?

I didn’t see that question being asked. Did you?

Tracking internet traffic is beyond the means of Crowdstrike, but several nation states are rumored to be sifting backbone traffic every day.

Factual Confusion and Catastrophe at Crowdsrike

The most appalling part of the Crowdstrike report is its admixture of alleged fact, speculation and wishful thinking.

Consider its assessment of the spread and effectiveness of the alleged malware (without more evidence, I would not even concede that it exists):

  1. CrowdStrike assesses that Попр-Д30.apk was potentially used through 2016 by at least one artillery unit operating in eastern Ukraine. (page 6)

  2. Open-source reporting indicates losses of almost 50% of equipment in the last 2 years of conflict amongst Ukrainian artillery forces and over 80% of D-30 howitzers were lost, far more than any other piece of Ukrainian artillery (page 8)

  3. A malware-infected Попр-Д30.apk application probably could not have provided all the necessary data required to directly facilitate the types of tactical strikes that occurred between July and August 2014. (page 8)

  4. The X-Agent Android variant does not exhibit a destructive function and does not interfere with the function of the original Попр-Д30.apk application. Therefore, CrowdStrike Intelligence has assessed that the likely role of this malware is strategic in nature. (page 9)

  5. Additionally, a study provided by the International Institute of Strategic Studies determined that the weapons platform bearing the highest losses between 2013 and 2016 was the D-30 towed howitzer.11 It is possible that the deployment of this malware infected application may have contributed to the high-loss nature of this platform. (page 9)

Judy Woodruff and her listeners don’t have to be military experts to realize that the claim of “one artillery unit” (#1) is hard to reconcile with the loss of “over 80% of D-30 howitzers” (#2) Nor do the claims of the malware being of “strategic” value, (#3, #4), work well with the “high-loss” described in #5.

The so-called “report” by Crowdstrike is a repetition of conclusions drawn on evidence (alleged to exist), the nature and scope of which is concealed from the reader.

Conclusion

However badly Clinton supporters want to believe in Russian hacking of the DNC, this report offers nothing of the kind. It creates the illusion of evidence that deceives only those already primed to accept its conclusions.

Unless and until Crowdstrike releases real evidence, logs, malware (including prior malware and how it was obtained), etc., this must be filed under “fake news.”
December 23, 2016

2017/18 – When you can’t believe your eyes

Filed under: Artificial Intelligence,Graphics,Journalism,News,Reporting,Visualization — Patrick Durusau @ 9:15 pm

Artificial intelligence is going to make it easier than ever to fake images and video by James Vincent.

From the post:

Smile Vector is a Twitter bot that can make any celebrity smile. It scrapes the web for pictures of faces, and then it morphs their expressions using a deep-learning-powered neural network. Its results aren’t perfect, but they’re created completely automatically, and it’s just a small hint of what’s to come as artificial intelligence opens a new world of image, audio, and video fakery. Imagine a version of Photoshop that can edit an image as easily as you can edit a Word document — will we ever trust our own eyes again?

“I definitely think that this will be a quantum step forward,” Tom White, the creator of Smile Vector, tells The Verge. “Not only in our ability to manipulate images but really their prevalence in our society.” White says he created his bot in order to be “provocative,” and to show people what’s happening with AI in this space. “I don’t think many people outside the machine learning community knew this was even possible,” says White, a lecturer in creative coding at Victoria University School of design. “You can imagine an Instagram-like filter that just says ‘more smile’ or ‘less smile,’ and suddenly that’s in everyone’s pocket and everyone can use it.”

Vincent reviews a number of exciting advances this year and concludes:


AI researchers involved in this fields are already getting a firsthand experience of the coming media environment. “I currently exist in a world of reality vertigo,” says Clune. “People send me real images and I start to wonder if they look fake. And when they send me fake images I assume they’re real because the quality is so good. Increasingly, I think, we won’t know the difference between the real and the fake. It’s up to people to try and educate themselves.”

An image sent to you may appear to be very convincing, but like the general in War Games, you have to ask does it make any sense?

Verification, subject identity in my terminology, requires more than an image. What do we know about the area? Or the people (if any) in the image? Where were they supposed to be today? And many other questions that depend upon the image and its contents.

Unless you are using a subject-identity based technology, where are you going to store that additional information? Or express your concerns about authenticity?

December 22, 2016

Low fat computing

Filed under: Computer Science,Forth,Graphics,Visualization — Patrick Durusau @ 8:53 pm

Low fat computing by Karsten Schmidt

A summary of the presentation by Schmidt by Malcolm Sparks, along with the presentation itself.

Lots of strange and 3-D printable eye candy for the first 15 minutes or so with Schmidt’s background. Starts to really rock around 20 minutes in with Forth code and very low level coding.

To get a better idea of what Schmidt has been doing, see his website: thi.ng, or his Forth repl in Javascript, http://forth.thi.ng/, or his GitHub repository or at: Github: thi.ng

Stop by at http://toxiclibs.org/ although the material there looks dated.

PostgreSQL/NoSQL Targets for 2017

Filed under: Cybersecurity,Security — Patrick Durusau @ 2:50 pm

matherly-22dec2016-460

To be fair, Kevin Beaumont notes in his retweet:

Where to begin… (There’s a similar number of No SQL databases with no passwords).

There are “weird machines” and cutting edge hacks but what separates you from a successful hacker is making the effort.

Are you going to be a successful hacker in 2017?

Leak Early and Often – New York Times

Filed under: Journalism,News,Reporting — Patrick Durusau @ 11:55 am

Got a confidential news tip?

From the webpage:

Do you have the next big story? Want to share it with The New York Times? We offer several ways to get in touch with and provide materials to our journalists. No communication system is completely secure, but these tools can help protect your anonymity. We’ve outlined each below, but please review any app’s terms and instructions as well. Please do not send feedback, story ideas, pitches or press releases through these channels. For more general correspondence visit our contact page.

The New York Times offers five (5) ways that offer some protection to your anonymity, depending upon your skill and what you leak.

When you leak, request posting of the raw leak within some reasonable period of time.

Government data belongs to the people, not its publisher.

December 21, 2016

The Course of Science

Filed under: Humor,Science — Patrick Durusau @ 7:52 pm

No doubt you will recognize “other” scientists in this description:

scientific-process

Select the image to get a larger and legible view.

I should point out that “facts” and “truth” have been debated recently in the news media without a Jesuit in sight. So, science isn’t the only area with “iffy” processes and results.

Posted by AlessondraSpringmann on Twitter.

On the Moral Cowardice of Politicians

Filed under: Government,Politics — Patrick Durusau @ 5:49 pm

Trump posse browbeats Hill Republicans by Rachel Bade.

From the post:


Since the election, numerous congressional Republicans have refused to publicly weigh in on any Trump proposal at odds with Republican orthodoxy, from his border wall to his massive infrastructure package. The most common reason, stated repeatedly but always privately: They’re afraid of being attacked by Breitbart or other big-name Trump supporters.

“Nobody wants to go first,” said Rep. Mark Sanford (R-S.C.), who received nasty phone calls, letters and tweets after he penned an August op-ed in The New York Times, calling on Trump to release his tax returns. “People are naturally reticent to be the first out of the block for fear of Sean Hannity, for fear of Breitbart, for fear of local folks.”

An editor at Breitbart, formerly run by senior Trump adviser Steve Bannon, said that fear is well-founded.

“If any politician in either party veers from what the voters clearly voted for in a landslide election … we stand at the ready to call them out on it and hold them accountable,” the person said.

I wasn’t aware that members of Congress (US) were elected solely by Sean Hannity, Breitbart, or a very small number of “local folks.”

Re-visit my post on Indivisible: A Practical Guide for Resisting the Trump Agenda.

You too can make your elected representatives/senators afraid, sore afraid.

It takes time, effort and sustained effort, but you can teach them to fear your organization as much as any other.

Don’t bemoan the moral cowardice of your political leadership, capitalize on it to further your demands and agenda.

Mining Twitter Data with Python [Trump Years Ahead]

Filed under: Data Mining,Python,Twitter — Patrick Durusau @ 5:24 pm

Marco Bonzanini, author of Mastering Social Media Mining with Python, has a seven part series of posts on mining Twitter with Python.

If you haven’t been mining Twitter before now, President-elect Donald Trump is about to change all that.

What if Trump continues to tweet as President and authorizes his appointees to do the same? Spontaneity isn’t the same thing as openness but it could prove to be interesting.

Thieves Have Privacy Rights? (Attack Vector for Government Networks)

Filed under: Cybersecurity,Security — Patrick Durusau @ 4:31 pm

Smile! You’re on a stolen iPhone’s candid camera! by Lisa Vaas.

Lisa tells the story of Anthony van der Meer and his creation of a honeypot phone in order to create a film about who would steal a cellphone?

The phone was rigged to allow Van der Meer to spy on the thief and quite to my surprise, Lisa raises the question of whether it is “ethical” to spy on the thief?

How very curious. Thieves have privacy rights?

Van der Meer’s case it possible the original thief simply sold the phone but even if you credit that tale, would you buy a phone at below market value on the street? And not suspect there was something odd about the transaction?

In any event, I do appreciate Lisa’s story because it points to a great technique for piercing government security. After all, what government staffer would not appreciate finding a quite new and unlocked iPhone 7?

Of course they want to use their phones to access their government email, networks, etc.

😉

Better penetration efforts everywhere are already using this technique but just in case it has not occurred to you, enjoy!

Don’t get your hopes up too high. Places that are somewhat serious about security, DOE (read nuclear sites), CIA, etc., prohibit cellphones altogether on premises.

That leaves hundreds of thousands of other government sites and facilities open, not to mention the users themselves.

Fake news and online harassment … powerful profit drivers

Filed under: Journalism,News,Reporting — Patrick Durusau @ 4:02 pm

Fake news and online harassment are more than social media byproducts — they’re powerful profit drivers by Soraya Chemaly.

From the post:

Fake news is being tied to everything from the influence of Russian troll farms on the presidential election to an armed man’s invasion of a Washington, D.C., restaurant as the ludicrous but terrifying culmination of an incident known as Pizzagate. Fake news isn’t just dangerous because it distorts public understanding but, as in the case of Pizzagate, or Gamergate before that, because it is frequently implicated in targeted online harassment and threats.

Most media commentary about this issue centers on three primary areas: the nature of the “truth,” the responsibilities of social media companies to the public good, and the question of why people believe outrageous and unverified claims. Very little has been said, however, about a critical factor in the spread of fake news and harassment: They are powerful drivers of profit.

Fake stories and harassment have a point of origin, but the real problem lies elsewhere — in the network effects of user-generated content, and the engagement it drives. Engagement, not content, – good or bad, true or false — is what generates Internet revenues and profit. So in that sense it makes no difference whether the content is “good” or “bad,” true or false. Our posting, sharing, commenting, liking and tweeting produces behavioral and demographic data that is then packaged and sold, repackaged and resold. In this economy, one that cuts across platforms, hateful or false representations are as easily converted into analytical, behavioral and ad-sales products as truthful or compassionate ones. Indeed, they are probably more lucrative.

Soraya dismisses the barring of “fake news” sites as a “public panacea.

As I pointed out in my post sub-titled as Hate as Renewal Resource, any viable solution must be profit-driven.

Make the blocking of hate, whatever particular kind of hate you dislike, into a product. The amount of hate in the world is almost boundless so it’s a never ending market for your product or service.

Lack of imagination on the part of Facebook, Twitter and other social media is the only explanation I have for their continued failure to enable users to filter their content (or purchase filtering from others).

How to Help Trump

Filed under: Government,Language,Marketing,Politics — Patrick Durusau @ 3:42 pm

How to Help Trump by George Lakoff.

From the post:

Without knowing it, many Democrats, progressives and members of the news media help Donald Trump every day. The way they help him is simple: they spread his message.

Think about it: every time Trump issues a mean tweet or utters a shocking statement, millions of people begin to obsess over his words. Reporters make it the top headline. Cable TV panels talk about it for hours. Horrified Democrats and progressives share the stories online, making sure to repeat the nastiest statements in order to refute them. While this response is understandable, it works in favor of Trump.

When you repeat Trump, you help Trump. You do this by spreading his message wide and far.

I know Lakoff from his Women, Fire, and Dangerous Things: What Categories Reveal about the Mind.

I haven’t read any of his “political” books but would buy them sight unseen on the strength of Women, Fire, and Dangerous Things.

Lakoff promises a series of posts using effective framing to “…expose and undermine Trump’s propaganda.”

Whether you want to help expose Trump or use framing to promote your own produce or agenda, start following Lakoff today!

Facebook’s Censoring Rules (Partial)

Filed under: Censorship,Facebook,Free Speech — Patrick Durusau @ 2:09 pm

Facebook’s secret rules of deletion by Till Krause and Hannes Grassegger.

From the post:

Facebook refuses to disclose the criteria that deletions are based on. SZ-Magazin has gained access to some of these rules. We show you some excerpts here – and explain them.

Introductory words

These are excerpts of internal documents that explain to content moderators what they need to do. To protect our sources, we have made visual edits to maintain confidentiality. While the rules are constantly changing, these documents provide the first-ever insights into the current guidelines that Facebook applies to delete contents.

Insight into a part of the byzantine world of Facebook deletion/censorship rules.

Pointers to more complete leaks of Facebook rules please!

100 tools for investigative journalists – Update December 2016

Filed under: Journalism,News,Reporting — Patrick Durusau @ 11:37 am

100 tools for investigative journalists – Update December 2016 by @Journalism2ls.

A listicle but what a listicle!

Categories are: Analytics, Brainstorm, Collect Data, Data Stories, Location, Monitor a story, Multimedia Publishing, Paper Trail, People Trail, Privacy, Production, Reporting, Snowfalling, Structure your story, Verification.

Just finding:

Hushed, temporary anonymous phone numbers: http://hushed.com/

made the time I spent perusing this listing worth while!

Under President-elect Trump, as under President Obama, there will be people who guard their own privacy and victims.

Which one do you want to be?

December 20, 2016

EFF then (2008) and now (2016)

Filed under: Electronic Frontier Foundation,Government,Politics,Privacy — Patrick Durusau @ 7:56 pm

The EFF has published a full page ad in Wired, addressing the tech industry, saying:

Your threat model has just changed.

EFF’s full-page Wired ad: Dear tech, delete your logs before it’s too late.

Rather remarkable change in just eight years.

Although I can’t show you the EFF’s “amusing” video described in Wired as follows:

THE ELECTRONIC FRONTIER Foundation is feeling a little jolly these days.

As part of its latest donor campaign, it’s created a brief, albeit humorous animated video espousing why it needs your cash.

Among other things, the video highlights the group’s fight for electronic rights, including its lawsuit challenging President Bush’s warrantless eavesdropping on Americans.

The lawsuit prompted Congress to immunize telecoms that freely gave your private data to the Bush administration — without warrants. (The EFF is now challenging that immunity legislation, which was supported by President-elect Barack Obama.)

What’s more, the EFF video, released Wednesday, reviews the group’s quest for fair use of copyrighted works, working electronic voting machines, and how it foiled wrongly issued patents.

It’s not on the EFF site, not available from the Wayback Machine, but it sounds very different from the once in a lifetime fund raising opportunity presented by President-elect Trump.

President Obama could have ended all of the surveillance apparatus that was in place when he took office. Dismantled it entirely. So that Trump would be starting over from scratch.

But no, the EFF has spent the last eight years working within the system in firm but polite disagreement.

The result of which is President-elect Trump has at his disposal a surveillance system second to none.

The question isn’t whether we should have more transparency for the Foreign Intelligence Surveillance Court but to strike at its very reason for existence. The charade of international terrorism.

Have you ever heard the EFF argue that toddlers kill more Americans every year than terrorists? Or any of the other statistics that demonstrate the absurdity of US investment in stopping a non-problem?

If you are serious about stopping surveillance then we need to strike at its rationale for existence.

Tolerance of surveillance, the EFF position, is a guarantee that surveillance will continue.

PS: Cory Doctorow attempts to make the case that President-elect Trump will do worse than President Obama. It’s possible but considering what Obama has done, it’s too close to call at this point. (You do realize we already have databases of Muslims, yes? So playing the “Trump says he will build a database of Muslims” card, yes, he said that, is deceptive. It already exists.)

I agree we are in danger from the incoming administration but it’s a factual issue whether it will be any worse than the present one.

The distance between said and actual policy can be quite large. Recalling that Obama promised to close our illegal detention of prisoners at Guantanamo Bay. Yet, eight years later a number of them remain there still.

Achtung! Germany Hot On The Censorship Trail

Filed under: Censorship,Facebook,Free Speech — Patrick Durusau @ 7:05 pm

Germany threatens to fine Facebook €500,000 for each fake news post by Mike Murphy.

Mike reports that fears are spreading that fake news could impact German parliamentary elections set for 2017.

One source of those fears is the continued sulking of Clinton campaign staff who fantasize that “fake news” cost Sec. Clinton the election.

Anything is possible as they say but to date, other than accusations of fake news impacting the election, between sobs and sighs, there has been no proof offered that “fake news” or otherwise had any impact on the election at all.

Do you seriously think the “fake news” that the Pope had endorsed Trump impacted the election? Really?

If “fake news” something other than an excuse for censorship (United States, UK, Germany, etc.), collect the “fake news” stories that you claim impacted the election.

Measure the impact of that “fake news” on volunteers following standard social science protocols.

Or do “fake news” criers fear the factual results of such a study?

PS: If you realize that “fake news,” isn’t something new but quite tradition, you will enjoy ‘Fake News’ in America: Homegrown, and Far From New by Chris Hedges.

Older Posts »

Powered by WordPress