Neo4j: The ‘thinking in graphs’ curve by Mark Needham
From the post:
In a couple of Neo4j talks I’ve done recently I’ve been asked how long it takes to get used to modelling data in graphs and whether I felt it’s simpler than alternative approaches.
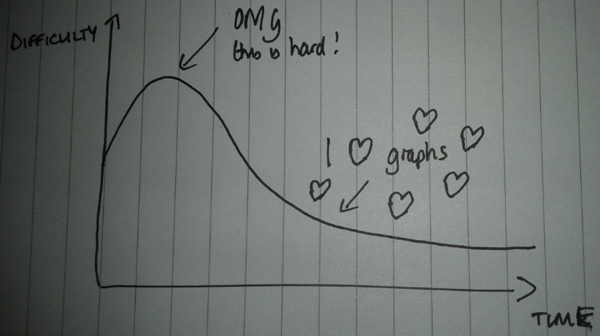
My experience of ‘thinking in graphs’™ closely mirrors what I believe is a fairly common curve when learning technologies which change the way you think:
There is an initial stage where it seems really hard because it’s different to what we’re used to and at this stage we might want to go back to what we’re used to.
If we persevere, however, we will get over that hump and after that it will be difficult to imagine another way of modelling data – at least in domains where the connections between different bits of data are important.
Once we’re over the hump data modelling should seem like fun and we’ll start looking to see whether we can use graphs to solve other problems we’ve got.
I wasn’t sure whether modelling in graphs is simpler than alternative approaches so as a thought experiment I decided to see what part of my football graph would look like if it was modelled in a relational database.
…
See Mark’s post for the comparison between a normalized relational database model versus a graph model.
I suspect Mark is right about the difficulty of moving from a fully normalized relational paradigm to graphs, but no one grows up thinking in normalized relational databases.
Remember your first encounter with databases (mine was DBase III or was that DBase II?), the normalized relational paradigm seemed unnatural. On a par with unmentionable practices.
Here’s an experiment you can try with non-IT and IT people.
Show both groups Mark’s diagrams and ask them which one is easier to understand?
I think you know where my money is riding. 😉
Could be useful empirical knowledge in terms of preparing educational materials for the respective groups.
