Another Word For It Patrick Durusau on Topic Maps and Semantic Diversity

February 18, 2015

Dato Updates Machine Learning Platform…

Filed under: Dato,GraphLab,Machine Learning — Patrick Durusau @ 2:51 pm

Dato Updates Machine Learning Platform, Puts Spotlight on Data Engineering Automation, Spark and Hadoop Integrations

From the post:

Today at Strata + HadoopWorld San Jose, Dato (formerly known as GraphLab) announced new updates to its machine learning platform, GraphLab Create, that allow data science teams to wrangle terabytes of data on their laptops at interactive speeds so that they can build intelligent applications faster. With Dato, users leverage machine learning to build prototypes, tune them, deploy in production and even offer them as a predictive service, all in minutes. These are the intelligent applications that provide predictions for a myriad of use cases including recommenders, sentiment analysis, fraud detection, churn prediction and ad targeting.

Continuing with its commitment to the Open Source community, Dato is also announcing the Open Source release of its core engine, including the out of core machine learning(ML)-optimized SFrame and SGraph data structures which make ML tasks blazing fast. Commercial and non-commercial versions of the full GraphLab Create platform are available for download at www.dato.com/download.

New features available in the GraphLab Create platform include:

  • Predictive Service Deployment Enhancements:
    enables easy integrations of Dato predictive services with applications regardless of development environment and allows administrators to view information about deployed models and statistics on requests and latency on a per predictive object basis.
  • Data Science Task Automation:
    a new Data Matching Toolkit allows for automatic tagging of data from a reference dataset and deduplication of lists automatically. In addition, the new Feature Engineering pipeline makes it easy to chain together multiple feature transformations–a vast simplification for the data engineering stage.
  • Open Source Version of GraphLab Create:
    Dato is offering an open-source release of GraphLab Create’s core code. Included in this version is the source for the SFrame and SGraph, along with many machine learning models, such as triangle counting, pagerank and more. Using this code, it is easy to build a new machine learning toolkit or a connector from the Dato SFrame to a data store. The source code can be found on
    Dato’s GitHub page.
  • New Pricing and Packaging Options:
    updated pricing and packaging include a non-commercial, free offering with the same features as the GraphLab Create commercial version. The free version allows data science enthusiasts to interact with and prototype on a leading machine learning platform. Also available is a new 30-day, no obligation evaluation license of the full-feature, commercial version of Dato’s product line.

Excellent news!

Now if we just had secure hardware to run it on.

On the other hand, it is open source so you can verify there are no backdoors in the software. That is a step in the right direction for security.
January 8, 2015

GraphLab Changes Name to Dato

Filed under: GraphLab — Patrick Durusau @ 11:35 am

GraphLab Changes Name to Dato, Raises $18.5 Million to Enable Creation of Intelligent Applications

From the post:

GraphLab today announced it closed an $18.5 million Series B funding round led by Vulcan Capital with participation from Opus Capital Ventures and existing investors New Enterprise Associates (NEA) and Madrona Venture Group. The company has also changed its name and brand from GraphLab to Dato, reflecting the evolution of its popular machine learning platform which now enables the creation of intelligent applications based on any type of data, including graphs, tables, text and images. Dato will use the investment to expand its business development, engineering and customer support teams to serve a rapidly growing customer base. The Series B round brings the total amount raised by Dato to $25.25 million. Steve Hall from Vulcan Capital will join Dato’s board of directors.

Those pesky startups. Begin with one name, soon there is another and that’s before even getting to raising capital. Then some smartass marketing person thinks they have a name that someday will be as universal as IBM or Nike. So now it has another name.

With a topic map approach, the changing of names isn’t a problem because the legal obligations of the entity continue, whatever its outward facing name.

If you wanted to track the name of the entity at particular times, I would create an association between the entity and its then present name, and use that association as a role player in the association you want to associate in time.

January 2, 2015

Getting started with text analytics

Filed under: GraphLab,Text Analytics — Patrick Durusau @ 7:33 pm

Getting started with text analytics by Chris DuBois.

At GraphLab, we are helping data scientists go from inspiration to production. As part of that goal, we made sure that GraphLab Create is useful for manipulating text data, plugging the results into a machine learning model, and deploying a predictive service.

Text data is useful in a wide variety of applications:

  • Finding key phrases in online reviews that describe an attribute or aspect of a restaurant, product for sale, etc.
  • Detecting sentiment in social media, such as tweets and news article comments.
  • Predicting influential documents in large corpora, such as PubMed abstracts and arXiv articles

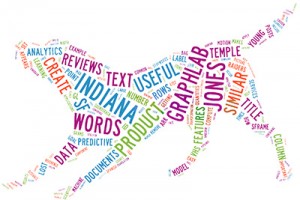
gl_wordcloud

So how do data scientists get started with text data? Regardless of the ultimate goal, the first step in text processing is typically feature engineering. We make this work easy to do using GraphLab Create. Examples of features include:

Just in case you get tired of watching conference presentations this weekend, I found this post from early December 2014 that I have been meaning to mention. Take a break from the videos and enjoy working through this post.

Chris promises more posts on data science skills so stay tuned!

December 24, 2014

Holiday Gift: Open-Source C++ SDK & GraphLab Create 1.2

Filed under: C/C++,GraphLab,Graphs — Patrick Durusau @ 5:58 pm

Holiday Gift: Open-Source C++ SDK & GraphLab Create 1.2 by Rajat Arya.

From the post:

Just when you were wondering how to keep from getting bored this holiday season, we’re delivering something to fuel your creativity and sharpen your C++ coding skills. With the release of GraphLab Create 1.x SDK (beta) you can now harness and extend the C++ engine that powers GraphLab Create.

Extensions built with the SDK can directly access the SFrame and SGraph data structures from within the C++ engine. Direct access enables you to build custom algorithms, toolkits, and lambdas in efficient native code. The SDK provides a lightweight path to create and compile custom functions and expose them through Python.

One of the great things about the Internet is that as soon as you wonder something like “…how am I going to keep from being bored…” a post like this one appears in your Twitter stream. Well, at least if you are a follower of @graphlabteam. (A good reason to be following @graphlabteam.)

Watching the explosive growth of progress on graphs and graph processing over the past couple of years makes me suspect that the security side of the house is doing something wrong. Not sure what but it isn’t making this sort of progress.

Enjoy the SDK!

December 23, 2014

Deep Learning: Doubly Easy and Doubly Powerful with GraphLab Create

Filed under: Deep Learning,GraphLab — Patrick Durusau @ 3:08 pm

Deep Learning: Doubly Easy and Doubly Powerful with GraphLab Create by Piotr Teterwak.

From the post:

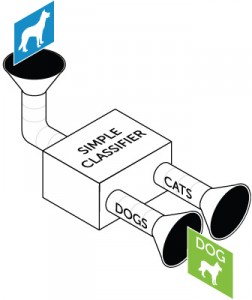
One of machine learning’s core goals is classification of input data. This is the task of taking novel data and assigning it to one of a pre-determined number of labels, based on what the classifier learns from a training set. For instance, a classifier could take an image and predict whether it is a cat or a dog.

dl_simpleclassifier

The pieces of information fed to a classifier for each data point are called features, and the category they belong to is a ‘target’ or ‘label’. Typically, the classifier is given data points with both features and labels, so that it can learn the correspondence between the two. Later, the classifier is queried with a data point and the classifier tries to predict what category it belongs to. A large group of these query data-points constitute a prediction-set, and the classifier is usually evaluated on its accuracy, or how many prediction queries it gets correct.

Despite a slow start, the post moves onto deep learning and GraphLab Create in detail, with code. You will need the GPU version of GraphLab Create to get the full benefit of this post.

Beyond distinguishing dogs and cats, a concern for other dogs and cats I’m sure, what images would you classify with deep learning?

I first saw this in a tweet by Aapo Kyrola

December 21, 2014

Weaver (Graph Store)

Filed under: GraphLab,Graphs,Titan — Patrick Durusau @ 3:40 pm

Weaver (Graph Store)

From the homepage:

A scalable, fast, consistent graph store

Weaver is a distributed graph store that provides horizontal scalability, high-performance, and strong consistency.

Weaver enables users to execute transactional graph updates and queries through a simple python API.

Alpha release but I did find some interesting statements in the FAQ:

Weaver is designed to store dynamic graphs. You can perform transactions on rapidly evolving graph-structured data with high throughput.

Examples of dynamic graphs?

Think online social networks, WWW, knowledge graphs, Bitcoin transaction graphs, biological interaction networks, etc. If your application manipulates graph-structured data similar to these examples, you should try Weaver out!

High throughput?

Our preliminary experiments show that Weaver achieves over 12x higher throughput than Titan on an online social network workload similar to that of Tao. In addition, Weaver also achieves 4x lower latency than GraphLab on an offline, graph traversal workload.

Alpha release has binaries for Ubuntu 14.04, the is a discussion list and the source code is on GitHub. Weaver has a native C++ binding and a Python client.

Impressive enough statements to start following the discussion group and to compile for Ubuntu 12.04 (yeah, I need to upgrade in the new year).

PS: There are only two messages in the discussion group since this is its first release. Get in on the ground floor!

October 16, 2014

GraphLab Create™ v1.0 Now Generally Available

Filed under: GraphLab,Graphs — Patrick Durusau @ 3:04 pm

GraphLab Create™ v1.0 Now Generally Available by Johnnie Konstantas.

From the post:

It is with tremendous pride in this amazing team that I am posting on the general availability of version 1.0, our flagship product. This work represents a bar being set on usability, breadth of features and productivity possible with a machine learning platform.

What’s next you ask? It’s easy to talk about all of our great plans for scale and administration but I want to give this watershed moment it’s due. Have a look at what’s new.

graphlab demo

New features available in the GraphLab Create platform include:

  • Predictive Services – Companies can build predictive applications quickly, easily, and at scale.  Predictive service deployments are scalable, fault-tolerant, and high performing, enabling easy integration with front-end applications. Trained models can be deployed on Amazon Elastic Compute Cloud (EC2) and monitored through Amazon CloudWatch. They can be queried in real-time via a RESTful API and the entire deployment pipeline is seen through a visual dashboard. The time from prototyping to production is dramatically reduced for GraphLab Create users.
  • Deep Learning – These models are ideal for automatic learning of salient features, without human supervision, from data such as images. Combined with GraphLab Create image analysis tools, the Deep Learning package enables accurate and in-depth understanding of images and videos. The GraphLab Create image analysis package makes quick work of importing and preprocessing millions of images as well as numeric data. It is built on the latest architectures including Convolution Layer, Max, Sum, Average Pooling and Dropout. The available API allows for extensibility in building user custom neural networks. Applications include image classification, object detection and image similarity.
  • Boosted Trees – With this feature, GraphLab adds support for this popular class of algorithms for robust and accurate regression and classification tasks.  With an out-of-core implementation, Boosted Trees in GraphLab Create can easily scale up to large datasets that do not fit into memory.

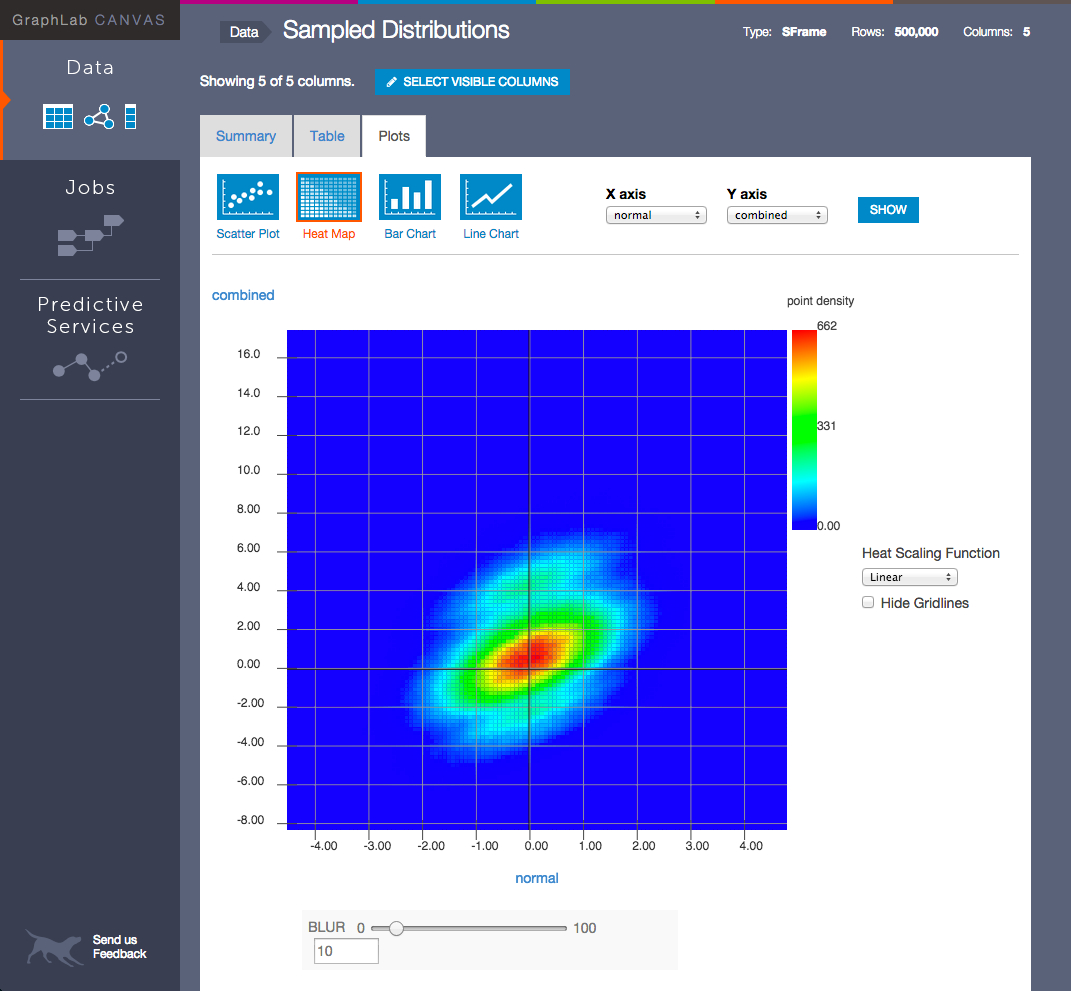
  • Visualization – New dashboards allow users to visualize the status and health of offline jobs deployed in various environments including local, Hadoop Clusters and EC2.  Also part of GraphLab Canvas is the visualization of GraphLab SFrames and SGraphs, enabling users to explore tables, graphs, text and images, in a single interactive environment making feature engineering more efficient.

…(and more)

Rather than downloading the software, go to GraphLab Create™ Quick Start to generate a product key. After you generate a product key (displayed on webpage), GraphLab offers command line code to set you up for installing GraphLab via pip. Quick and easy on Ubuntu 12.04.

Next stop: The Five-Line Recommender, Explained by Alice Zheng. 😉

Enjoy!

August 1, 2014

GraphLab Conference 2014 (Videos!)

Filed under: GraphLab,Graphs,Machine Learning — Patrick Durusau @ 1:45 pm

GraphLab Conference 2014 (Videos!)

Videos from the GraphLab Conference 2014 have been posted! Who needs to wait for a new season of Endeavor? 😉

(I included the duration times so you can squeeze these in between conference calls.)

Presentations, ordered by author’s last name.

Training Sessions on GraphLab Create

I first saw this in a tweet by xamat.

July 30, 2014

Graphs, Databases and Graphlab

Filed under: GraphLab,Graphs,IMDb,Python — Patrick Durusau @ 2:40 pm

Graphs, Databases and Graphlab by Bugra Akyildiz.

From the post:

I will talk about graphs, graph databases and mainly the paper that powers Graphlab. At the end of the post, I will go over briefly basic capabilities of Graphlab as well.

Background coverage of graphs and graphdatabases, followed by a discussion of GraphLab.

The high point of the post are graphs generated from prior work by Bugra on the Internet Movie Database. (IMDB Top 100K Movies Analysis in Depth (Parts 1- 4))

Enjoy!

June 26, 2014

Graphing 173 Million Taxi Rides

Filed under: Government,Government Data,GraphLab,Python — Patrick Durusau @ 6:43 pm

Interesting taxi rides dataset by Danny Bickson.

From the post:

I got the following from my collaborator Zach Nation. NY taxi ride dataset that was not properly anonymized and was reverse engineered to find interesting insights in the data.

Danny mapped the data using GraphLab and asks some interesting questions of the data.

BTW, Danny is offering the iPython notebook to play with!

Cool!

This is the same data set I mentioned in: On Taxis and Rainbows

April 19, 2014

New trends in sharing data science work

Filed under: Conferences,GraphLab,Graphs,Open Data — Patrick Durusau @ 6:42 pm

New trends in sharing data science work

Danny Bickson writes:

I got the following venturebeat article from my colleague Carlos Guestrin.

It seems there is an interesting trend of allowing data scientists to share their work: Imagine if a company’s three highly valued data scientists can happily work together without duplicating each other’s efforts and can easily call up the ingredients and results of each other’s previous work.

That day has come. As the data scientist arms race continues, data scientists might want to join forces. Crazy idea, right? Two San Francisco startups — Domino Data Lab and Sense — have emerged recently with software to let data scientists collaborate on multiple projects. In a way, it’s like code storehouse GitHub for the data science world. A Montreal startup named Plot.ly has been talking about the same themes, but it brings a more social twist. Another startup, Mode Analytics, is building software for data analysts to ask questions of data without duplicating previous efforts. And at least one more mature software vendor, Alpine Data Labs, has been adding features to help many colleagues in a company apply algorithms to code on one central hub.

If you aren’t already registered for GraphLab Conference 2014, notice that Alpine Data Labs, Domino Data Labs, Mode Analytics, Plot.ly, and, Sense will all be at the GraphLab Conference.

Go ahead, register for the GraphLab conference. At the very worst you will learn something. If you socialize a little bit, you will meet some of the brightest graph people on the planet.

Plus, when the history of “sharing” in data science is written, you will have attended one of the early conferences on sharing code for data science. After years of hoarding data (where you now see open data) and beginning to see code sharing, data science is developing a different model.

And you were there to cheer them on!

April 17, 2014

GraphLab Create: Upgrade

Filed under: GraphLab,Graphs — Patrick Durusau @ 10:21 am

GraphLab Create: Upgrade

From the webpage:

The latest version of graphlab-create is 0.2 beta. See what’s new for information about new features and the release notes for detailed additions and compatibility changes.

From the what’s new page:

GraphLab Data Structures:

SFrame (Scalable tabular data structure):

Graph:

Machine Learning Toolkits:

Recommender functionality:

General Machine Learning:

Cloud:

  • Support for all AWS regions
  • Secured client server communication using strong, standards-based encryption
  • CIDR rule specification for Amazon EC2 instance identification

For detailed information about additional features and compatibility changes, see the release notes.

For known issues and feature requests visit the forum!

Cool! Be sure to pass this news along!

February 23, 2014

Extending GraphLab to tables

Filed under: GraphLab,Graphs,Tables — Patrick Durusau @ 4:48 pm

Extending GraphLab to tables by Ben Lorica.

From the post:

GraphLab’s SFrame, an interesting and somewhat under-the-radar tool was unveiled1 at Strata Santa Clara. It is a disk-based, flat table representation that extends GraphLab to tabular data. With the addition of SFrame, users can leverage GraphLab’s many algorithms on data stored as either graphs or tables. More importantly SFrame increases GraphLab’s coverage of the data science workflow: it allows users with terabyte-sized datasets to clean their data and create new features directly within GraphLab (SFrame performance can scale linearly with the number of available cores).

The beta version of SFrame can read data from local disk, HDFS, S3 or a URL, and save to a human-readable .csv or a more efficient native format. Once an SFrame is created and saved to disk no reprocessing of the data is needed. Below is Python code that illustrates how to read a .csv file into SFrame, create a new data feature and save it to disk on S3:

Jay Gu wrote Introduction to SFrame, which isn’t as short as the coverage on the GraphLab Create FAQ.

Remember that Spark has integrated GraphX and so also extended it reach into data processing workflow.

The standard for graph software is growing by leaps and bounds!

February 21, 2014

Graphical models toolkit for GraphLab

Filed under: Graphical Models,GraphLab,Graphs — Patrick Durusau @ 9:14 pm

DARPA* project contributes graphical models toolkit to GraphLab by Danny Bickson.

From the post:

We are proud to announce that following many months of hard work, Scott Richardson from Vision Systems Inc. has contributed a graphical models toolkit to GraphLab. Here is a some information about their project:

Last year Vision Systems, Inc. (VSI) partnered with Systems & Technology Research (STR) and started working on a DARPA* project to develop intelligent, automatic, and robust computer vision technologies based on realistic conditions. Our goal is to develop a software system that lets users ask queries of photo content, such as “Does this person look familiar?” or “Where is this building located?” If successful, our technology would alert people to scenes that warrant their attention.

We had an immediate need for a solid, scalable graph-parallel computation engine to replace our internal belief propagation implementation. We quickly gravitated to GraphLab. Using this framework, we designed the Factor Graph toolkit based on Joseph Gonzalez’s initial implementation. A factor graph, a type of graphical model, is a bipartite graph composed of two types of vertices: variable nodes and factor nodes. The Factor Graph toolkit is able to translate a factor graph into a graphlab distributed-graph and perform inference using a vertex-program which implements the well known message-passing algorithm belief propagation. Both belief propagation and factor graphs are general tools that have applications in a variety of domains.

We are very excited to get to work on key problems in the Machine Learning/Machine Vision field and to be a part of the powerful communities, like GraphLab, that make it possible.

I admit to not always being fond of DARPA projects but every now and again they fund something worthwhile.

If machine vision becomes robust enough, you could start a deduped porn service. 😉 I am sure other use cases will come to mind.

If you haven’t looked at GraphLab recently, you should.

Sexual Predators in Chat Rooms

Filed under: Data,GraphLab,Graphs — Patrick Durusau @ 9:01 pm

Weird dataset: identifying sexual predators in chat rooms by Danny Bickson.

From the post:

To all of the bored data scientists who are looking for interesting demo. (Alternatively, to all the startups who want to do a fraud detection demo). I stumbled upon this weird dataset which was part of PAN 2012 conference: identifying sexual predators in chat rooms.

I wouldn’t say you have to be bored to check out this dataset.

At least it is a worthy cause.

For that matter, don’t you wonder why Atlanta, GA, for example, is a sex trafficking hub in the United States? Or rather, why hasn’t law enforcement be able to stop the trafficking?

Last time I went out of the country you had to come back in one person at a time. So we have the location, control of the area, target groups for exploitation, …, what am I missing here in terms of catching traffickers?

Sex traffickers don’t wear big orange badges saying: Sex Trafficker but is that really necessary?

Maybe law enforcement should make better use of the computing cycles wasted on chasing illusory terrorists and focus on real criminals coming in and out of the country at Hartsfield-Jackson Atlanta International Airport.

January 29, 2014

The Structure Data awards:… [Vote For GraphLab]

Filed under: Contest,GraphLab,Graphs — Patrick Durusau @ 9:26 pm

The Structure Data awards: Honoring the best data startups of 2013 by Derrick Harris.

From the post:

Data is taking over the world, which makes for an exciting time to be covering information technology. Almost every new company understands the importance of analyzing data, and many of their products — from fertility apps to stream-processing engines — are based on this understanding. Whether it’s helping users do new things or just do the same old things better, data analysis really is changing the enterprise and consumer technology spaces, and the world, in general.

With that in mind, we have decided to honor some of the most-promising, innovative and useful data-based startups with our inaugural Structure Data awards. The criteria were simple. Companies (or projects) must have launched in 2013; must have been covered in Gigaom; and, most importantly, must make the collection and analysis of data a key part of the user experience. Identifying these companies was the easy part; the hard part was paring down the list of categories and candidates to a reasonable number.

Just a quick head’s up about the Readers’ Choice awards at GIgaom. Voting closes 14 February 2014.

If you need a suggestion under Machine Learning/AI, vote for GraphLab!

January 11, 2014

Registration for the 3rd GraphLab Conference is open!

Filed under: Conferences,GraphLab,Graphs — Patrick Durusau @ 8:22 pm

Registration for the 3rd GraphLab Conference is open! by Danny Bickson.

From the post:

3rd graphlab conference

Join us for a full day of the latest and greatest applied machine learning and big data analytics!

Monday July 21, 2014 at the Nikko Hotel SF. Confirmed speakers (very preliminary list): GraphLab, Google, Trifacta, Datapad, Databricks (Spark), Pandora Internet Radio, Cloudera. Confirmed demos: QuantiFind, bigML, Skytree, YarcData, Saffrom Technology, Franz.

Additional information
Registration

Very cool!

The GraphLab conferences have been a great success.

Besides, it’s in July, San Francisco, + graphs. What more could you want? 😉

December 7, 2013

Large-Scale Machine Learning and Graphs

Filed under: GraphChi,GraphLab,Graphs,Python — Patrick Durusau @ 5:10 pm

Large-Scale Machine Learning and Graphs by Carlos Guestrin.

The presentation starts with a history of the evolution of GraphLab, which is interesting in and of itself.

Carlos then goes beyond a history lesson and gives a glimpse of a very exciting future.

Such as: installing GraphLab with Python, using Python for local development, running the same Python with Graphlab in the cloud.

Thought that might catch your eye.

Something to remember when people talk about scaling graph analysis.

If you are interested in seeing one possible future of graph processing today, not some day, check out: GraphLab Notebook (Beta).

BTW, Carlos mentions a technique call “think like a vertex” which involves distributing vertexes across machines rather than splitting graphs on edges.

Seems to me that would work to scale the processing of topic maps by splitting topics as well. Once “merging” has occurred on different machines, then “merge” the relevant topics back together across machines.

November 13, 2013

PowerLyra

Filed under: GraphLab,Graphs,Networks — Patrick Durusau @ 8:36 pm

PowerLyra by Danny Bickson.

Danny has posted an email from Rong Chen, Shanghai Jiao Tong University, which reads in part:

We argued that skewed distribution in natural graphs also calls for differentiated processing of high-degree and low-degree vertices. We then developed PowerLyra, a new graph analytics engine that embraces the best of both worlds of existing frameworks, by dynamically applying different computation and partition strategies for different vertices. PowerLyra uses Pregel/GraphLab like computation models for process low-degree vertices to minimize computation, communication and synchronization overhead, and uses PowerGraph-like computation model for process high-degree vertices to reduce load imbalance and contention. To seamless support all PowerLyra application, PowerLyra further introduces an adaptive unidirectional graph communication.

PowerLyra additionally proposes a new hybrid graph cut algorithm that embraces the best of both worlds in edge-cut and vertex-cut, which adopts edge-cut for low-degree vertices and vertex-cut for high-degree vertices. Theoretical analysis shows that the expected replication factor of random hybrid-cut is always better than both random vertex-cut and edge-cut. For skewed power-law graph, empirical validation shows that random hybrid-cut also decreases the replication factor of current default heuristic vertex-cut (Grid) from 5.76X to 3.59X and from 18.54X to 6.76X for constant 2.2 and 1.8 of synthetic graph respectively. We also develop a new distributed greedy heuristic hybrid-cut algorithm, namely Ginger, inspired by Fennel (a greedy streaming edge-cut algorithm for a single machine). Compared to Gird vertex-cut, Ginger can reduce the replication factor by up to 2.92X (from 2.03X) and 3.11X (from 1.26X) for synthetic and real-world graphs accordingly.

Finally, PowerLyra adopts locality-conscious data layout optimization in graph ingress phase to mitigate poor locality during vertex communication. we argue that a small increase of graph ingress time (less than 10% for power-law graph and 5% for real-world graph) is more worthwhile for an often larger speedup in execution time (usually more than 10% speedup, specially 21% for Twitter follow graph).

Right now, PowerLyra is implemented as an execution engine and graph partitions of GraphLab, and can seamlessly support all GraphLab applications. A detail evaluation on 48-node cluster using three different graph algorithms (PageRank, Approximate Diameter and Connected Components) show that PowerLyra outperforms current synchronous engine with Grid partition of PowerGraph (Jul. 8, 2013. commit:fc3d6c6) by up to 5.53X (from 1.97X) and 3.26X (from 1.49X) for real-world (Twitter, UK-2005, Wiki, LiveJournal and WebGoogle) and synthetic (10-million vertex power-law graph ranging from 1.8 to 2.2) graphs accordingly, due to significantly reduced replication factor, less communication cost and improved load balance.

The website of PowerLyra: http://ipads.se.sjtu.edu.cn/projects/powerlyra.html
….

Pass this along if you are interested in cutting edge graph software development.

November 4, 2013

The 3rd GraphLab Conference is coming!

Filed under: GraphLab,Graphs — Patrick Durusau @ 10:16 pm

The 3rd GraphLab Conference is coming! by Danny Bickson.

From the post:

We have just started to organize our 3rd user conference on Monday July 21 in SF. This is a very preliminary notice to attract companies and universities who like to be involved. We are planning a mega event this year with around 800-900 data scientists attending, with the topic of graph analytics and large scale machine learning.

The conference is a non-profit event held by GraphLab.org to promote applications of large scale graph analytics in industry. We invite talks from all major state-of-the-art solutions for graph processing, graph databases and large scale data analytics and machine learning. We are looking for sponsors who would like to contribute to the event organization.

The best recommendation I can make for the 3rd GraphLab Conference is to point to the videos from the 2nd GraphLab Conference.

There you will find videos and slides for:

  • Molham Aref, LogicBlox – Datalog as a foundation for probabilistic programming
  • Dr. Avery Ching, Facebook – Graph Processing at Facebook Scale
  • Prof. Carlos Guestrin, GraphLab Inc. & University of Washington: Graphs at Scale with GraphLab
  • Dr. Pankaj Gupta, Twitter – WTF: The Who to Follow Service at Twitter
  • Prof. Joe Hellerstein – Professor, UC Berkeley and Co-Founder/CEO, Trifacta – Productivity for Data Analysts: Visualization, Intelligence and Scale
  • Aapo Kyrola, CMU – What can you do with GraphChi – what’s new?
  • Prof. Michael Mahoney, Stanford – Randomized regression in parallel and distributed environments
  • Prof. Vahab Mirrokni, Google – Large-scale Graph Clustering in MapReduce and Beyond
  • Dr. Derek Murray , Microsoft Research- Incremental, iterative and interactive data analysis with Naiad
  • Prof. Mark Oskin, University of Washington, Grappa graph engine.
  • Dr. Lei Tang – Walmart Labs – Adaptive User Segmentation for Recommendation
  • Prof. S V N Vishwanathan, PurdueNOMAD: Non-locking stOchastic Multi-machine algorithm for Asynchronous and Decentralized matrix factorization
  • Dr. Theodore Willke, Intel LabsIntel GraphBuilder 2.0

Spread the word!

October 21, 2013

New SOSP paper: a lightweight infrastructure for graph analytics

Filed under: Graph Analytics,GraphLab,Graphs — Patrick Durusau @ 6:55 pm

New SOSP paper: a lightweight infrastructure for graph analytics by Danny Bickson.

Danny cites a couple of new graph papers that will be of interest:

I got this reference from my collaborator Aapo Kyorla, author of GraphChi.

A Lightweight Infrastructure for Graph Analytics. Donald Nguyen, Andrew Lenharth, Keshav Pingali (University of Texas at Austin), to appear in SOSP 2013.

It is an interesting paper which heavily compares to GraphLab, PowerGraph (GraphLab v2.1) and
GraphChi.

One of the main claims is that dynamic and asynchronous scheduling can significantly speed up many graph algorithms (vs. bulk synchronous parallel model where all graph nodes are executed on each step).

Some concerns I have is regarding the focus on multicore settings, which makes everything much easier, and thus to comparison with PowerGraph less relevant.

And,

Another relevant paper which improves on GraphLab is: Leveraging Memory Mapping for Fast and Scalable Graph Computation on a PC. Zhiyuan Lin, Duen Horng Chau, and U Kang, IEEE Big Data Workshop: Scalable Machine Learning: Theory and Applications, 2013. The basic idea is to speed graph loading using mmap() operation.

One of the things I like about Danny’s posts is that he is trying to improve graph processing for everyone, not cooking numbers for his particular solution.

Enjoy!

September 26, 2013

GraphLab Internship Program…

Filed under: GraphLab,Graphs — Patrick Durusau @ 4:15 pm

GraphLab Internship Program (Machine Learning Summer Internship) by Danny Bickson.

From the post:

We are glad to announce our latest internship program for the summer of 2014. We have around 10 open positions, either at GraphLab/UW or affiliated companies we work with.

Would you like to have a chance to deploy cutting edge machine learning algorithms in practice? Do you want to get your hands on the largest and most interesting datasets out there? Do you have valuable applied experience working with machine learning in the cloud? If so, you should consider our internship program.

Candidates must be US-based PhD or master students in one of the following areas: machine learning, statistics, AI, systems, high performance computing, distributed algorithms, or math. We are especially interested in those who have used GraphLab/GraphChi for a research project or have contributed to the GraphLab community.

All interested applicants should send their resume to bickson@graphlab.com. If you are a company interested having a GraphLab intern, please feel free to get in touch.
Here is a (very preliminary) list of open positions:

See the positions list at Danny’s post. And start your application sooner rather than later.

PS: They also do graphs at Graphlab. 😉

September 25, 2013

Benchmarking Graph Databases

Filed under: Benchmarks,Giraph,GraphLab,MySQL,Neo4j — Patrick Durusau @ 3:33 pm

Benchmarking Graph Databases by Alekh Jindal.

Speaking of data skepticism.

From the post:

Graph data management has recently received a lot of attention, particularly with the explosion of social media and other complex, inter-dependent datasets. As a result, a number of graph data management systems have been proposed. But this brings us to the question: What happens to the good old relational database systems (RDBMSs) in the context of graph data management?

The article names some of the usual graph database suspects.

But for its comparison, it selects only one (Neo4j) and compares it against three relational databases, MySQL, Vertica and VoltDB.

What’s missing? How about expanding to include GraphLab (GraphLab – Next Generation [Johnny Come Lately VCs]) and Giraph (Scaling Apache Giraph to a trillion edges) or some of the other heavy hitters (insert your favorite) in the graph world?

Nothing against Neo4j. It is making rapid progress on a query language and isn’t hard to learn. But it lacks the raw processing power of an application like Apache Giraph. Giraph, after all, is used to process the entire Facebook data set, not a “4k nodes and 88k edges” Facebook sample as in this comparison.

Not to mention that only two algorithms were used in this comparison: PageRank and Shortest Paths.

Personally I can imagine users being interested in running more than two algorithms. But that’s just me.

Every benchmarking project has to start somewhere but this sort of comparison doesn’t really advance the discussion of competing technologies.

Not that any comparison would be complete without a discussion of typical uses cases and user observations on how each candidate did or did not meet their expectations.

September 13, 2013

Scaling Apache Giraph to a trillion edges

Filed under: Facebook,Giraph,GraphLab,Hive — Patrick Durusau @ 6:03 pm

Scaling Apache Giraph to a trillion edges by Avery Ching.

From the post:

Graph structures are ubiquitous: they provide a basic model of entities with connections between them that can represent almost anything. Flight routes connect airports, computers communicate to one another via the Internet, webpages have hypertext links to navigate to other webpages, and so on. Facebook manages a social graph that is composed of people, their friendships, subscriptions, and other connections. Open graph allows application developers to connect objects in their applications with real-world actions (such as user X is listening to song Y).

Analyzing these real world graphs at the scale of hundreds of billions or even a trillion (10^12) edges with available software was impossible last year. We needed a programming framework to express a wide range of graph algorithms in a simple way and scale them to massive datasets. After the improvements described in this article, Apache Giraph provided the solution to our requirements.

In the summer of 2012, we began exploring a diverse set of graph algorithms across many different Facebook products as well as academic literature. We selected a few representative use cases that cut across the problem space with different system bottlenecks and programming complexity. Our diverse use cases and the desired features of the programming framework drove the requirements for our system infrastructure. We required an iterative computing model, graph-based API, and fast access to Facebook data. Based on these requirements, we selected a few promising graph-processing platforms including Apache Hive, GraphLab, and Apache Giraph for evaluation.

For your convenience:

Apache Giraph

Apache Hive

GraphLab

Your appropriate scale is probably less than a trillion edges but everybody likes a great scaling story.

This is a great scaling story.

July 24, 2013

GraphLab 2013 – Supplemental

Filed under: GraphLab,Graphs — Patrick Durusau @ 10:22 am

If you like the videos and slides from GraphLab 2013, follow the authors for their latest research!

I created a listing of DBLP links (Linkedin links where I could not find a DBLP author listing) for the participants at GraphLab 2013.

Thought you might find it useful:

Presentations:

  • Molham Aref, LogicBlox – Datalog as a foundation for probabilistic programming.
  • Dr. Avery Ching, Facebook – Graph Processing at Facebook Scale.
  • Prof. Carlos Guestrin, GraphLab Inc. & University of Washington: Graphs at Scale with GraphLab.
  • Dr. Pankaj Gupta, Twitter – WTF: The Who to Follow Service at Twitter.
  • Prof. Joe Hellerstein – Professor, UC Berkeley and Co-Founder/CEO, Trifacta – Productivity for Data Analysts: Visualization, Intelligence and Scale.
  • Aapo Kyrola, CMU – What can you do with GraphChi – what’s new?
  • Prof. Michael Mahoney, Stanford – Randomized regression in parallel and distributed environments.
  • Prof. Vahab Mirrokni, Google – Large-scale Graph Clustering in MapReduce and Beyond.
  • Dr. Derek Murray, Microsoft Research – Incremental, iterative and interactive data analysis with Naiad.
  • Prof. Mark Oskin, University of Washington, Grappa graph engine.
  • Dr. Lei Tang – Walmart Labs – Adaptive User Segmentation for Recommendation.
  • Prof. S V N Vishwanathan, PurdueNOMAD: Non-locking stOchastic Multi-machine algorithm for Asynchronous and Decentralized matrix factorization.
  • Dr. Theodore Willke, Intel LabsIntel GraphBuilder 2.0.

Posters:

  • Aydin Buluc, LNL – Parallel software for high-performance and high-productivity graph analysis.
  • Asghar Dehghani, Alpine Data Labs: A parallel implementation of kernel machines.
  • Paul Hofmann, SaffronTech – Predicting Threats For The Gates Foundation — Protecting The People, Investment, Reputation and Infrastructure – Large Scale Machine Learning on Sparse Graphs.
  • Norbert Martínez, Andrey Gubichev, Alex Averbuch, LDBC -Linked Data Benchmark Council – an initiative to standardize graph systems benchmarking.
  • Norbert Martínez Sparsity technologies DEX: a High-Performance Graph Database Management System.
  • Valeria Nikolaenko, Stanford – Privacy-Preserving Ridge Regression on Hundreds of Millions of Records.
  • George Ng (Linkedin), YarcData – YarcData: Enabling discovery at speed and scale.
  • Eriko Nurvitadhi, Intel – GraphGen: Compiling Graph Applications onto Accelerator-Based Platforms.
  • Ameet Talwalkar, Bekereley – MLBase.
  • Radhika T[h]ekkath (Linkedin), Agivox – A Deeper Dive into Understanding User Interest in News and Blogs.
  • Bryan Thompson, Systap – GAS Engine for the GPU.
  • Eiko Yoneki (Universityof Cambridge); Amitabha Roy (EPFL) – Scale-up Graph Processing: A Storage-centric View.

Demos:

  • Harsh Agrawal, Virginia Tech – CloudCV: Large Scale Distributed Computer Vision on the Cloud.
  • Jans Aasman, Allgero Graph – Exploring and discovering new patterns in graphs using Gruff and AllegroGraph.
  • Matthias Broecheler, Aurelius – The Aurelius Graph Cluster – Graph Computing at Scale.
  • Murat Can Cobanoglu, Pitt/CMU – Repurpose drugs by running collaborative filtering algorithms on pharmacological datasets.
  • Baldo Faieta, Adobe – ‘Likes’ diffusion over social networks.
  • Joseph Gonzalez & Reynold Xin, Berkeley AMP Lab – GraphX: Interactive Graph Mining.
  • Ely Kahn (Linkedin), Sqrrl – Sqrrl + Apache Accumulo = Massively Scalable Graphs.
  • Francisco Martin (Linkedin), Poul Petersen (Linkedin), Adam Ashenfelter BigML – Machine Learning Made Easy.
  • Jan Neumann, Comcast- Personalized Recommendations at Comcast.
  • Jason Riedy, USF – STING: High-Performance Analysis for Streaming, Graph-Structured Data.
  • Shivaram Venkataraman & Kyungyong Lee Bekereley/HP Labs – Presto: Distributed Machine Learning and Graph Processing with Sparse Matrices.
  • Tim Wilson (Linkedin), smarttypes.org – The map equation: using information theory to analyze your markov transition matrix.

July 23, 2013

GraphLab Workshop 2013 – Videos!

Filed under: GraphLab,Graphs — Patrick Durusau @ 7:41 am

GraphLab Workshop 2013 – Videos!

Simply awesome!

Here you will find videos and slides for:

  • Molham Aref, LogicBlox – Datalog as a foundation for probabilistic programming
  • Dr. Avery Ching, Facebook – Graph Processing at Facebook Scale
  • Prof. Carlos Guestrin, GraphLab Inc. & University of Washington: Graphs at Scale with GraphLab
  • Dr. Pankaj Gupta, Twitter – WTF: The Who to Follow Service at Twitter
  • Prof. Joe Hellerstein – Professor, UC Berkeley and Co-Founder/CEO, Trifacta – Productivity for Data Analysts: Visualization, Intelligence and Scale
  • Aapo Kyrola, CMU – What can you do with GraphChi – what’s new?
  • Prof. Michael Mahoney, Stanford – Randomized regression in parallel and distributed environments
  • Prof. Vahab Mirrokni, Google – Large-scale Graph Clustering in MapReduce and Beyond
  • Dr. Derek Murray , Microsoft Research- Incremental, iterative and interactive data analysis with Naiad
  • Prof. Mark Oskin, University of Washington, Grappa graph engine.
  • Dr. Lei Tang – Walmart Labs – Adaptive User Segmentation for Recommendation
  • Prof. S V N Vishwanathan, PurdueNOMAD: Non-locking stOchastic Multi-machine algorithm for Asynchronous and Decentralized matrix factorization
  • Dr. Theodore Willke, Intel LabsIntel GraphBuilder 2.0

Now you are sorry you did not attend GraphLab Workshop 2013. I tried to warn you. 😉

Best remedy is to start planning your rationale to attend next year.

Oh, and do watch the videos. What I have seen so far is great!

June 24, 2013

GraphLab Image Processing Toolkit – Image Stitching

Filed under: GraphLab,Graphs,Image Processing — Patrick Durusau @ 1:25 pm

GraphLab Image Processing Toolkit – Image Stitching by Danny Bickson.

From the post:

We got some exciting news from Dhruv Batra from Virginia Tech:

Dear Graphlab team,

As most of you know, I was working on the Graphlab computer vision toolbox last summer. The motivation behind it was to provide distributed implementations of computer vision algorithms as a service.

In that spirit, I am happy to announce that that my students and I have a produced a first version of CloudCV.

— In the first version, the only implemented algorithm is image stitching
— The front-end allows you to upload a collection of images, which will be stitched to create a panorama.

— The back-end is a server in my lab running our local repository of graphlab
— We are currently running stitching in shared-memory parallel mode with ncpus = 3.

— The ‘terminal’ in the webpage will show you familiar looking messages from graphlab.

Cheers,
Dhruv

Danny includes some images to try out.

Or, you can try some images from your favorite image repository. 😉

June 23, 2013

Last chance registration to the 2nd GraphLab Workshop

Filed under: Conferences,GraphLab,Graphs — Patrick Durusau @ 1:28 pm

Last chance registration to the 2nd GraphLab Workshop by Danny Bickson.

From the post:

We are having a great demand for this year’s 2nd GraphLab workshop (Monday July 1st in SF): already 378 383 467 registrations and growing quickly. Please register ASAP here: http://glw2.eventbrite.com before we are sold out!

You will see weapons grade graph work at the workshop.

Don’t let spy agencies take the last few seats!

Register today!

May 20, 2013

Graph Landscape Survey

Filed under: GraphBuilder,GraphLab,Graphs,Neo4j,Pregel,Spark — Patrick Durusau @ 9:41 am

Improving options for unlocking your graph data by Ben Lorica.

From the post:

The popular open source project GraphLab received a major boost early this week when a new company comprised of its founding developers, raised funding to develop analytic tools for graph data sets. GraphLab Inc. will continue to use the open source GraphLab to “push the limits of graph computation and develop new ideas”, but having a commercial company will accelerate development, and allow the hiring of resources dedicated to improving usability and documentation.

While social media placed graph data on the radar of many companies, similar data sets can be found in many domains including the life and health sciences, security, and financial services. Graph data is different enough that it necessitates special tools and techniques. Because tools were a bit too complex for casual users, in the past this meant graph data analytics was the province of specialists. Fortunately graph data is an area that has attracted many enthusiastic entrepreneurs and developers. The tools have improved and I expect things to get much easier for users in the future. A great place to learn more about tools for graph data, is at the upcoming GraphLab Workshop (on July 1st in SF).
(…)

Ben summarizes graph resources for:

  • Data wrangling: creating graphs
  • Data management and search
  • Graph-parallel frameworks
  • Machine-learning and analytics
  • Visualization

It would be hard to find a better starting place for investigating the buzz about graphs.

I first saw this in An Overview of Graph Processing Frameworks by Danny Bickson.

May 15, 2013

GraphLab – Next Generation [Johnny Come Lately VCs]

Filed under: GraphLab,Graphs — Patrick Durusau @ 5:55 pm

Funding for the next generation of GraphLab by Danny Bickson.

From the post:

The GraphLab journey began with the desire:

  • to rethink the way we approach Machine Learning and Graph analytics,
  • to demonstrate that with the right abstractions and system design we can achieve unprecedented levels of performance, and
  • to build a community around large-scale graph computation.

We have been blown away by the excitement and growth of the GraphLab community and have been unable to keep up with the incredible interest from our amazing users.

Therefore, we are proud to announce GraphLab Inc, a company devoted to accelerating the development of the open-source GraphLab project.

(…)

[GraphLab will remain an open source project]

GraphLab 2.2 is just around the corner, see here for more details as to what is in it. Beyond that, we are exploring a new computation engine and further enhancements to the communication layer, as well as simpler integration with existing Cloud technologies, easier installation procedures, and an exciting new graph storage system. And of course, we look forward to working with you to develop the roadmap and build the next generation of the GraphLab system. [Missing hyperlink for details on GraphLab 2.2 in original]

Very cool!

For you Johnny Come Lately VCs:

GraphLab Raises $6.75M For Data Analysis Used In Consumer Recommendation Services by Alex Williams.

From the post:

GraphLab, the open-source distributed database, has received $6.75 million from Madrona Venture Group and NEA for its machine learning technology used to analyze data graphs for recommendation engines.

Developed five years ago at Carnegie Mellon University, the open-source data analysis platform takes semi-structured data that describe relationships between people, web traffic, product purchases and other data. It then analyzes that data for services to provide online recommendations.

There may be more room at the table. I don’t know so you would have to ask the GraphLab folks.

Full Disclosure: I have no financial interest in GraphLab, although I am very interested in promoting work that is well done. GraphLab is an example of such work.

Older Posts »

Powered by WordPress