Another Word For It Patrick Durusau on Topic Maps and Semantic Diversity

April 30, 2018

TrackML Particle Tracking Challenge [Non-Twitter Big Data]

Filed under: CERN,Physics — Patrick Durusau @ 7:40 pm

TrackML Particle Tracking Challenge

Cutting to the chase:

… can machine learning assist high energy physics in discovering and characterizing new particles?

Details follow:

To explore what our universe is made of, scientists at CERN are colliding protons, essentially recreating mini big bangs, and meticulously observing these collisions with intricate silicon detectors.

While orchestrating the collisions and observations is already a massive scientific accomplishment, analyzing the enormous amounts of data produced from the experiments is becoming an overwhelming challenge.

Event rates have already reached hundreds of millions of collisions per second, meaning physicists must sift through tens of petabytes of data per year. And, as the resolution of detectors improve, ever better software is needed for real-time pre-processing and filtering of the most promising events, producing even more data.

To help address this problem, a team of Machine Learning experts and physics scientists working at CERN (the world largest high energy physics laboratory), has partnered with Kaggle and prestigious sponsors to answer the question: can machine learning assist high energy physics in discovering and characterizing new particles?

Specifically, in this competition, you’re challenged to build an algorithm that quickly reconstructs particle tracks from 3D points left in the silicon detectors. This challenge consists of two phases:

  • The Accuracy phase will run on Kaggle from May to July 2018. Here we’ll be focusing on the highest score, irrespective of the evaluation time. This phase is an official IEEE WCCI competition (Rio de Janeiro, Jul 2018).
  • The Throughput phase will run on Codalab from July to October 2018. Participants will submit their software which is evaluated by the platform. Incentive is on the throughput (or speed) of the evaluation while reaching a good score. This phase is an official NIPS competition (Montreal, Dec 2018).

All the necessary information for the Accuracy phase is available here on Kaggle site. The overall TrackML challenge web site is there.

I know you breathed a sigh of relief upon reading, [Non-Twitter Big Data].

There’s nothing wrong with using Twitter to practice big data techniques but end of the day, at best some advertiser can micro-tweak an advertisement for a loser (pronounced “user.”) There’s no real bang from that “achievement.”

Unlike tweaking ad targeting, a viable solution to this challenge may make a fundamental difference in high energy physics.

Would you rather be known as an ad tweaker or for advancing ML in high energy physics?

Your call.

October 6, 2017

Computational Data Analysis Workflow Systems

Filed under: Astroinformatics,Cheminformatics,Chemistry,Data Analysis,Physics,Workflow — Patrick Durusau @ 4:42 pm

Computational Data Analysis Workflow Systems

An incomplete list of existing workflow systems. As of today, approximately 17:00 EST, 173 systems in no particular order.

I first saw this mentioned in a tweet by Michael R. Crusoe.

One of the many resources found at: Common Workflow Language.

From the webpage:

The Common Workflow Language (CWL) is a specification for describing analysis workflows and tools in a way that makes them portable and scalable across a variety of software and hardware environments, from workstations to cluster, cloud, and high performance computing (HPC) environments. CWL is designed to meet the needs of data-intensive science, such as Bioinformatics, Medical Imaging, Astronomy, Physics, and Chemistry.

You should take a quick look at: Common Workflow Language User Guide to get a feel for CWL.

Try to avoid thinking of CWL as “documenting” your workflow if that is an impediment to using it. That’s a side effect but its main purpose is to make your more effective.

December 1, 2016

If You Don’t Get A Quantum Computer For Christmas

Filed under: Haskell,Physics,Quantum — Patrick Durusau @ 1:38 pm

Learn Quantum Mechanics with Haskell by Scott N. Walck.

Abstract:

To learn quantum mechanics, one must become adept in the use of various mathematical structures that make up the theory; one must also become familiar with some basic laboratory experiments that the theory is designed to explain. The laboratory ideas are naturally expressed in one language, and the theoretical ideas in another. We present a method for learning quantum mechanics that begins with a laboratory language for the description and simulation of simple but essential laboratory experiments, so that students can gain some intuition about the phenomena that a theory of quantum mechanics needs to explain. Then, in parallel with the introduction of the mathematical framework on which quantum mechanics is based, we introduce a calculational language for describing important mathematical objects and operations, allowing students to do calculations in quantum mechanics, including calculations that cannot be done by hand. Finally, we ask students to use the calculational language to implement a simplified version of the laboratory language, bringing together the theoretical and laboratory ideas.

You won’t find a quantum computer under your Christmas tree this year.

But Haskell + Walck will teach you the basics of quantum mechanics.

You may also want to read:

Structure and Interpretation of Quantum Mechanics – a Functional Framework (2003) by Jerzy Karczmarczuk.

You will have to search for it but “Gerald Jay Sussman & Jack Wisdom (2013): Functional Differential Geometry. The MIT Press.” is out on the net somewhere.

Very tough sledding but this snippet from the preface may tempt you into buying a copy:


But the single biggest difference between our treatment and others is that we integrate computer programming into our explanations. By programming a computer to interpret our formulas we soon learn whether or not a formula is correct. If a formula is not clear, it will not be interpretable. If it is wrong, we will get a wrong answer. In either case we are led to improve our program and as a result improve our understanding. We have been teaching advanced classical mechanics at MIT for many years using this strategy. We use precise functional notation and we have students program in a functional language. The students enjoy this approach and we have learned a lot ourselves. It is the experience of writing software for expressing the mathematical content and the insights that we gain from doing it that we feel is revolutionary. We want others to have a similar experience.

If that interests you, check out courses by Sussman at MITOpenCourseware.

Enjoy!

April 23, 2016

300 Terabytes of Raw Collider Data

Filed under: BigData,Physics,Science — Patrick Durusau @ 2:22 pm

CERN Just Dropped 300 Terabytes of Raw Collider Data to the Internet by Andrew Liptak.

From the post:

Yesterday, the European Organization for Nuclear Research (CERN) dropped a staggering amount of raw data from the Large Hadron Collider on the internet for anyone to use: 300 terabytes worth.

The data includes a 100 TB “of data from proton collisions at 7 TeV, making up half the data collected at the LHC by the CMS detector in 2011.” The release follows another infodump from 2014, and you can take a look at all of this information through the CERN Open Data Portal. Some of the information released is simply the raw data that CERN’s own scientists have been using, while another segment is already processed, with the anticipated audience being high school science courses.

It’s not the same as having your own cyclotron in the backyard with a bubble chamber but its the next best thing!

If you have been looking for “big data” to stretch your limits, this fits the bill nicely.

February 22, 2016

Physics, Topology, Logic and Computation: A Rosetta Stone

Filed under: Category Theory,Computation,Logic,Physics,Topology — Patrick Durusau @ 7:42 pm

Physics, Topology, Logic and Computation: A Rosetta Stone by John C. Baez and Mike Stay.

Abstract:

In physics, Feynman diagrams are used to reason about quantum processes. In the 1980s, it became clear that underlying these diagrams is a powerful analogy between quantum physics and topology. Namely, a linear operator behaves very much like a ‘cobordism’: a manifold representing spacetime, going between two manifolds representing space. This led to a burst of work on topological quantum field theory and ‘quantum topology’. But this was just the beginning: similar diagrams can be used to reason about logic, where they represent proofs, and computation, where they represent programs. With the rise of interest in quantum cryptography and quantum computation, it became clear that there is extensive network of analogies between physics, topology, logic and computation. In this expository paper, we make some of these analogies precise using the concept of ‘closed symmetric monoidal category’. We assume no prior knowledge of category theory, proof theory or computer science.

While this is an “expository” paper, at some 66 pages (sans the references), you best set aside some of your best thinking/reading time to benefit from it.

Enjoy!

February 13, 2016

You Can Confirm A Gravity Wave!

Filed under: Physics,Python,Science,Signal Processing,Subject Identity,Subject Recognition — Patrick Durusau @ 5:35 pm

Unless you have been unconscious since last Wednesday, you have heard about the confirmation of Einstein’s 1916 prediction of gravitational waves.

An very incomplete list of popular reports include:

Einstein, A Hunch And Decades Of Work: How Scientists Found Gravitational Waves (NPR)

Einstein’s gravitational waves ‘seen’ from black holes (BBC)

Gravitational Waves Detected, Confirming Einstein’s Theory (NYT)

Gravitational waves: breakthrough discovery after a century of expectation (Guardian)

For the full monty, see the LIGO Scientific Collaboration itself.

Which brings us to the iPython notebook with the gravitational wave discovery data: Signal Processing with GW150914 Open Data

From the post:

Welcome! This ipython notebook (or associated python script GW150914_tutorial.py ) will go through some typical signal processing tasks on strain time-series data associated with the LIGO GW150914 data release from the LIGO Open Science Center (LOSC):

To begin, download the ipython notebook, readligo.py, and the data files listed below, into a directory / folder, then run it. Or you can run the python script GW150914_tutorial.py. You will need the python packages: numpy, scipy, matplotlib, h5py.

On Windows, or if you prefer, you can use a python development environment such as Anaconda (https://www.continuum.io/why-anaconda) or Enthought Canopy (https://www.enthought.com/products/canopy/).

Questions, comments, suggestions, corrections, etc: email losc@ligo.org

v20160208b

Unlike the toadies at the New England Journal of Medicine, Parasitic Re-use of Data? Institutionalizing Toadyism, Addressing The Concerns Of The Selfish, the scientists who have labored for decades on the gravitational wave question are giving their data away for free!

Not only giving the data away, but striving to help others learn to use it!

Beyond simply “doing the right thing,” and setting an example for other scientists, this is a great opportunity to learn more about signal processing.

Signal processing being an important method of “subject identification” when you stop to think about it in a large number of domains.

Detecting a gravity wave is beyond your personal means but with the data freely available…, further analysis is a matter of interest and perseverance.

November 25, 2015

Quantum Walks with Gremlin [Graph Day, Austin]

Filed under: Graphs,Gremlin,Physics,Quantum — Patrick Durusau @ 8:25 pm

Quantum Walks with Gremlin by Marko A. Rodiguez, Jennifer H. Watkins.

Abstract:

A quantum walk places a traverser into a superposition of both graph location and traversal “spin.” The walk is defined by an initial condition, an evolution determined by a unitary coin/shift-operator, and a measurement based on the sampling of the probability distribution generated from the quantum wavefunction. Simple quantum walks are studied analytically, but for large graph structures with complex topologies, numerical solutions are typically required. For the quantum theorist, the Gremlin graph traversal machine and language can be used for the numerical analysis of quantum walks on such structures. Additionally, for the graph theorist, the adoption of quantum walk principles can transform what are currently side-effect laden traversals into pure, stateless functional flows. This is true even when the constraints of quantum mechanics are not fully respected (e.g. reversible and unitary evolution). In sum, Gremlin allows both types of theorist to leverage each other’s constructs for the advancement of their respective disciplines.

Best not to tackle this new paper on Gremlin and quantum graph walks after a heavy meal. 😉

Marko will be presenting at Graph Day, 17 January 2016, Austin, Texas. Great opportunity to hear him speak along with other cutting edge graph folks.

The walk Marko describes is located in a Hilbert space. Understandable because numerical solutions require the use of a metric space.

However, if you are modeling semantics in difference universes of discourse, realize that semantics don’t possess metric spaces. Semantics lie outside of metric space, although I concede that many have imposed varying arbitrary metrics on semantics.

For example, if I am mapping the English term for “black,” as in a color to the term “schwartz” in German, I need a “traverser” that enables the existence of both terms at separate locations, one for each universe in the graph.

You may protest that is overly complex for the representation of synonyms, but consider that “schwartz” occupies a different location in the universe of German and etymology from “black.”

For advertising, subtleties of language may not be useful, but for reading medical or technical works, an “approximate” or “almost right” meaning may be more damaging than helpful.

Who knows? Perhaps quantum computers will come closer to modeling semantics across domains better than any computer to date. Not perfectly but closer.

November 13, 2015

LIQUi|> – A Quantum Computing Simulator

Filed under: Computer Science,Physics,Quantum — Patrick Durusau @ 8:23 pm

With quantum computing simulator, Microsoft offers a sneak peek into future of computing by Allison Linn.

From the post:


Next week, at the SuperComputing 2015 conference in Austin, Texas, Dave Wecker, a lead architect on the QuArC team, will discuss the recent public release on GitHub of a suite of tools that allows computer scientists to simulate a quantum computer’s capabilities. That’s a crucial step in building the tools needed to run actual quantum computers.

“This is the closest we can get to running a quantum computer without having one,” said Wecker, who has helped develop the software.

The software is called Language-Integrated Quantum Operations, or LIQUi|>. The funky characters at the end refer to how a quantum operation is written in mathematical terms.

The researchers are hoping that, using LIQUi|>, computer scientists at Microsoft and other academic and research institutions will be able to perfect the algorithms they need to efficiently use a quantum computer even as the computers themselves are simultaneously being developed.

“We can actually debut algorithms in advance of running them on the computer,” Svore said.

As of today, November 13, 2015, LIQUi|> has only one (1) hit at GitHub. Will try back next week to see what the numbers look like then.

You won’t have a quantum computer by the holidays but you may have created your first quantum algorithm by then.

Enjoy!

November 12, 2015

Visualizing What Your Computer (and Science) Ignore (mostly)

Filed under: Computer Science,Geometry,Image Processing,Image Understanding,Physics — Patrick Durusau @ 8:01 pm

Deviation Magnification: Revealing Departures from Ideal Geometries by Neal Wadhwa, Tali Dekel, Donglai Wei, Frédo Durand, William T. Freeman.

Abstract:

Structures and objects are often supposed to have idealized geome- tries such as straight lines or circles. Although not always visible to the naked eye, in reality, these objects deviate from their idealized models. Our goal is to reveal and visualize such subtle geometric deviations, which can contain useful, surprising information about our world. Our framework, termed Deviation Magnification, takes a still image as input, fits parametric models to objects of interest, computes the geometric deviations, and renders an output image in which the departures from ideal geometries are exaggerated. We demonstrate the correctness and usefulness of our method through quantitative evaluation on a synthetic dataset and by application to challenging natural images.

The video for the paper is quite compelling:

Read the full paper here: http://people.csail.mit.edu/nwadhwa/deviation-magnification/DeviationMagnification.pdf

From the introduction to the paper:

Many phenomena are characterized by an idealized geometry. For example, in ideal conditions, a soap bubble will appear to be a perfect circle due to surface tension, buildings will be straight and planetary rings will form perfect elliptical orbits. In reality, however, such flawless behavior hardly exists, and even when invisible to the naked eye, objects depart from their idealized models. In the presence of gravity, the bubble may be slightly oval, the building may start to sag or tilt, and the rings may have slight perturbations due to interactions with nearby moons. We present Deviation Magnification, a tool to estimate and visualize such subtle geometric deviations, given only a single image as input. The output of our algorithm is a new image in which the deviations from ideal are magnified. Our algorithm can be used to reveal interesting and important information about the objects in the scene and their interaction with the environment. Figure 1 shows two independently processed images of the same house, in which our method automatically reveals the sagging of the house’s roof, by estimating its departure from a straight line.

Departures from “idealized geometry” make for captivating videos but there is a more subtle point that Deviation Magnification will help bring to the fore.

“Idealized geometry,” just like discrete metrics for attitude measurement or metrics of meaning, etc. are all myths. Useful myths as houses don’t (usually) fall down, marketing campaigns have a high degree of success, and engineering successfully relies on approximations that depart from the “real world.”

Science and computers have a degree of precision that has no counterpart in the “real world.”

Watch the video again if you doubt that last statement.

Whether you are using science and/or a computer, always remember that your results are approximations based upon approximations.

I first saw this in Four Short Links: 12 November 2015 by Nat Torkington.

October 20, 2015

Python at the Large Hadron Collider and CERN

Filed under: Particle Physics,Physics — Patrick Durusau @ 7:14 pm

Python at the Large Hadron Collider and CERN hosted by Michael Kennedy.

From the webpage:

The largest machine ever built is the Large Hadron Collider at CERN. It’s primary goal was the discovery of the Higgs Boson: the fundamental particle which gives all objects mass. The LHC team of 1000’s of physicists achieved that goal in 2012 winning the Nobel Prize in physics. Kyle Cranmer is here to share how Python was at the core of this amazing achievement!

You’ll learn about the different experiment including ATLAS and CMS. We talk a bit about the physics involved in the discovery before digging into the software and computer technology used at CERN. The collisions generate a tremendous amount of data and the technology to filter, gather, and understand the data is super interesting.

You’ll also learn about Crayfis, the app that turns your phone into a cosmic ray detector. No joke. Kyle is taking citizen science to a whole new level.

Bio on Kyle Crammer:

Kyle Cranmer is an American physicist and a professor at New York University at the Center for Cosmology and Particle Physics and Affiliated Faculty member at NYU’s Center for Data Science. He is an experimental particle physicist working, primarily, on the Large Hadron Collider, based in Geneva, Switzerland. Cranmer popularized a collaborative statistical modeling approach and developed statistical methodology, which was used extensively for the discovery of the Higgs boson at the LHC in July, 2012.

CRAYFIS – Join the first and only crowd-sourced cosmic ray detector. You might just help discover something big.

Not heavy with technical information but a nice glimpse into the computing side of CERN.

Share with students to encourage them to pick up programming skills as we once did typing.

June 3, 2015

Experiment proves Reality does not exist until it is Measured [Nor Do Topics]

Filed under: Physics,Topic Maps — Patrick Durusau @ 3:35 pm

Experiment proves Reality does not exist until it is Measured

From the post:

The bizarre nature of reality as laid out by quantum theory has survived another test, with scientists performing a famous experiment and proving that reality does not exist until it is measured.

Physicists at The Australian National University (ANU) have conducted John Wheeler’s delayed-choice thought experiment, which involves a moving object that is given the choice to act like a particle or a wave. Wheeler’s experiment then asks — at which point does the object decide?

Common sense says the object is either wave-like or particle-like, independent of how we measure it. But quantum physics predicts that whether you observe wave like behavior (interference) or particle behavior (no interference) depends only on how it is actually measured at the end of its journey. This is exactly what the research team found.

“It proves that measurement is everything. At the quantum level, reality does not exist if you are not looking at it,” said Associate Professor Andrew Truscott from the ANU Research School of Physics and Engineering.

The results are more of an indictment of “common sense” than startling proof that “reality does not exist if you are not looking at it.”

In what sense would “reality” exist if you weren’t looking at it?

It is well known that what we perceive as motion, distance, sensation are all constructs that are being assembled by our brains based upon input from our senses. Change those senses or fool them and the “displayed” results are quite different.

If you doubt either of those statements, try your hand at the National Geographic BrainGames site.

Topics as you recall, represent all the information we know about a particular subject.

So, in what sense does a topic not exist until we look at it?

Assuming that you have created your topic map in a digital computer, where would you point to show me your topic map? The whole collection of topics. Or a single topic for that matter?

In order to point to a topic, you have to query the topic map. That is you have to ask to “see” the topic in question.

When displayed, that topic may have information that you don’t remember entering. In fact, you may be able to prove you never entered some of the information displayed. Yet, the information is now being displayed before you.

Part of the problem arises because for convenience sake, we often think of computers as storing information as we would write it down on a piece of paper. But the act of displaying information by a computer is a transformation of its storage of information into a format that is easier for us to perceive.

A transformation process underlies the display of a topic, well, depending upon the merging rules for your topic map. It is always possible to ask a topic map to return a set of topics that match a merging criteria but that again is your “looking at” a requested set of topics and not in any way “the way the topics are in reality.”

One of the long standing problems in semantic interoperability is the insistence of every solution that it has the answer if everyone else would just listen and abandon their own solutions.

Yes, yes that would work but thus far, after over 6,000 years of recorded, different systems for semantics (languages, both natural and artificial) that has never happened. I take that as some evidence that a universal solution isn’t going to happen.

What I am proposing is that topics, in a topic map, have the shape and content designed by an author and/or as requested by a user. That is the result of a topic map is always a question of “what did you ask” and not some preordained answer.

As I said, that isn’t likely to come up early in your use of topic maps but it could be invaluable for maintenance and processing of a topic map.

I am working on several examples to illustrate this idea and hope to have one or more of them posted tomorrow.

April 24, 2015

Mathematicians Reduce Big Data Using Ideas from Quantum Theory

Filed under: Data Reduction,Mathematics,Physics,Quantum — Patrick Durusau @ 8:20 pm

Mathematicians Reduce Big Data Using Ideas from Quantum Theory by M. De Domenico, V. Nicosia, A. Arenas, V. Latora.

From the post:

A new technique of visualizing the complicated relationships between anything from Facebook users to proteins in a cell provides a simpler and cheaper method of making sense of large volumes of data.

Analyzing the large volumes of data gathered by modern businesses and public services is problematic. Traditionally, relationships between the different parts of a network have been represented as simple links, regardless of how many ways they can actually interact, potentially loosing precious information. Only recently a more general framework has been proposed to represent social, technological and biological systems as multilayer networks, piles of ‘layers’ with each one representing a different type of interaction. This approach allows a more comprehensive description of different real-world systems, from transportation networks to societies, but has the drawback of requiring more complex techniques for data analysis and representation.

A new method, developed by mathematicians at Queen Mary University of London (QMUL), and researchers at Universitat Rovira e Virgili in Tarragona (Spain), borrows from quantum mechanics’ well tested techniques for understanding the difference between two quantum states, and applies them to understanding which relationships in a system are similar enough to be considered redundant. This can drastically reduce the amount of information that has to be displayed and analyzed separately and make it easier to understand.

The new method also reduces computing power needed to process large amounts of multidimensional relational data by providing a simple technique of cutting down redundant layers of information, reducing the amount of data to be processed.

The researchers applied their method to several large publicly available data sets about the genetic interactions in a variety of animals, a terrorist network, scientific collaboration systems, worldwide food import-export networks, continental airline networks and the London Underground. It could also be used by businesses trying to more readily understand the interactions between their different locations or departments, by policymakers understanding how citizens use services or anywhere that there are large numbers of different interactions between things.

You can hop over to Nature, Structural reducibility of multilayer networks, where if you don’t have an institutional subscription:

ReadCube: $4.99 Rent, $9.99 to buy, or Purchase a PDF for $32.00.

Let me save you some money and suggest you look at:

Layer aggregation and reducibility of multilayer interconnected networks

Abstract:

Many complex systems can be represented as networks composed by distinct layers, interacting and depending on each others. For example, in biology, a good description of the full protein-protein interactome requires, for some organisms, up to seven distinct network layers, with thousands of protein-protein interactions each. A fundamental open question is then how much information is really necessary to accurately represent the structure of a multilayer complex system, and if and when some of the layers can indeed be aggregated. Here we introduce a method, based on information theory, to reduce the number of layers in multilayer networks, while minimizing information loss. We validate our approach on a set of synthetic benchmarks, and prove its applicability to an extended data set of protein-genetic interactions, showing cases where a strong reduction is possible and cases where it is not. Using this method we can describe complex systems with an optimal trade–off between accuracy and complexity.

Both articles have four (4) illustrations. Same four (4) authors. The difference being the second one is at http://arxiv.org. Oh, and it is free for downloading.

I remain concerned by the focus on reducing the complexity of data to fit current algorithms and processing models. That said, there is no denying that such reduction methods have proven to be useful.

The authors neatly summarize my concerns with this outline of their procedure:

The whole procedure proposed here is sketched in Fig. 1 and can be summarised as follows: i) compute the quantum Jensen-Shannon distance matrix between all pairs of layers; ii) perform hierarchical clustering of layers using such a distance matrix and use the relative change of Von Neumann entropy as the quality function for the resulting partition; iii) finally, choose the partition which maximises the relative information gain.

With my corresponding concerns:

i) The quantum Jensen-Shannon distance matrix presumes a metric distance for its operations, which may or may not reflect the semantics of the layers (or than by simplifying assumption).

ii) The relative change of Von Neumann entropy is a difference measurement based upon an assumed metric, which may or not represent the underlying semantics of the relationships between layers.

iii) The process concludes by maximizing a difference measurement based upon an assigned metric, which has been assigned to the different layers.

Maximizing a difference, based on an entropy calculation, which is itself based on an assigned metric doesn’t fill me with confidence.

I don’t doubt that the technique “works,” but doesn’t that depend upon what you think is being measured?

A question for the weekend: Do you think this is similar to the questions about dividing continuous variables into discrete quantities?

March 5, 2015

ATLAS’ Higgs ML Challenge Data Open to Public

Filed under: Machine Learning,Physics — Patrick Durusau @ 7:09 pm

ATLAS’ Higgs ML Challenge Data Open to Public by David Rousseau.

From the post:

HiggsML

Higgs Machine Challenge Poster

The dataset from the ATLAS Higgs Machine Learning Challenge has been released on the CERN Open Data Portal.

The Challenge, which ran from May to September 2014, was to develop an algorithm that improved the detection of the Higgs boson signal. The specific sample used simulated Higgs particles into two tau particles inside the ATLAS detector. The downloadable sample was provided for participants at the host platform on Kaggle’s website. With almost 1,785 teams competing, the event was a huge success. Participants applied and developed cutting edge Machine Learning techniques, which have been shown to be better than existing traditional high-energy physics tools.

The dataset was removed at the end of the Challenge but due to high public demand ATLAS, as organizer of the event, has decided to house it in the CERN Open Data Portal where it will be available permanently. The 60MB zipped ASCII file can be decoded without a special software, and a few scripts are provided to help users get started. Detailed documentation for physicists and data scientists is also available. Thanks to the Digital Object Identifiers (DOIs) in CERN Open Data Portal, the dataset and accompanying material can be cited like any other paper.

The Challenge’s winner Gábor Melis, and recipients of the Special High Energy Physics meets Machine Learning Award, Tianqi Chen and Tong He, will be visiting CERN to deliver talks on their winning algorithms on 19 May.

If you missed your chance to test your mettle in the ATLAS’ Higgs ML Challenge, don’t despair! The data is available once again. How have ML techniques changed since the original challenge? How have your skills improved?

Enjoy!

March 3, 2015

Light as Wave and Particle (Naming Issue?)

Filed under: Physics,Science — Patrick Durusau @ 2:50 pm

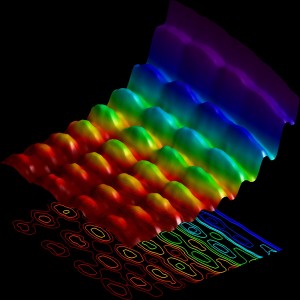
Scientists take the first ever photograph of light as both a wave and a particle by Kelly Dickerson.

light-wave-particle

For the first time ever, scientist have snapped a photo of light behaving as both a wave and a particle at the same time.

The research was published on Monday in the journal Nature Communications.

Scientists know that light is a wave. That’s why light can bend around buildings and squeeze through tiny pinholes. Different wavelengths of light are why we can see different colors, and why everyone freaked out about that black and blue dress.

But all the characteristics and behaviors of a wave aren’t enough to explain everything that light does.

Naming issue?

Before this photo, light behaved as a wave or as a particle. Now we have a photo of light between those two states? Neither of the old terms is sufficient by itself.

Who is going to break the news to Cyc? 😉

I first saw this in a tweet by Reg Saddler

February 16, 2015

Visualizing Interstellar ‘s Wormhole

Filed under: Astroinformatics,Physics — Patrick Durusau @ 4:19 pm

Visualizing Interstellar’s Wormhole by Oliver James, Eugenie von Tunzelmann, Paul Franklin, Kip S. Thorne.

Abstract:

Christopher Nolan’s science fiction movie Interstellar offers a variety of opportunities for students in elementary courses on general relativity theory. This paper describes such opportunities, including: (i) At the motivational level, the manner in which elementary relativity concepts underlie the wormhole visualizations seen in the movie. (ii) At the briefest computational level, instructive calculations with simple but intriguing wormhole metrics, including, e.g., constructing embedding diagrams for the three-parameter wormhole that was used by our visual effects team and Christopher Nolan in scoping out possible wormhole geometries for the movie. (iii) Combining the proper reference frame of a camera with solutions of the geodesic equation, to construct a light-ray-tracing map backward in time from a camera’s local sky to a wormhole’s two celestial spheres. (iv) Implementing this map, for example in Mathematica, Maple or Matlab, and using that implementation to construct images of what a camera sees when near or inside a wormhole. (v) With the student’s implementation, exploring how the wormhole’s three parameters influence what the camera sees—which is precisely how Christopher Nolan, using our implementation, chose the parameters for \emph{Interstellar}’s wormhole. (vi) Using the student’s implementation, exploring the wormhole’s Einstein ring, and particularly the peculiar motions of star images near the ring; and exploring what it looks like to travel through a wormhole.

Finally! A use for all the GFLOPS at your finger tips! You can vet images shown in movies that purport to represent wormholes. Seriously, the appendix to this article has instructions.

Moreover, you can visit: Visualizing Interstellar’s Wormhole (I know, same name as the paper but this is a website with further details and high-resolution images for use by students.)

A poor cropped version of one of those images:

interstellar

A great demonstration of what awaits anyone with an interest to explore and sufficient computing power.

I first saw this in a tweet by Computer Science.

December 17, 2014

Learn Physics by Programming in Haskell

Filed under: Functional Programming,Haskell,Physics,Programming,Science — Patrick Durusau @ 7:55 pm

Learn Physics by Programming in Haskell by Scott N. Walck.

Abstract:

We describe a method for deepening a student’s understanding of basic physics by asking the student to express physical ideas in a functional programming language. The method is implemented in a second-year course in computational physics at Lebanon Valley College. We argue that the structure of Newtonian mechanics is clarified by its expression in a language (Haskell) that supports higher-order functions, types, and type classes. In electromagnetic theory, the type signatures of functions that calculate electric and magnetic fields clearly express the functional dependency on the charge and current distributions that produce the fields. Many of the ideas in basic physics are well-captured by a type or a function.

A nice combination of two subjects of academic importance!

Anyone working on the use of the NLTK to teach David Copperfield or Great Expectations? 😉

I first saw this in a tweet by José A. Alonso.

December 15, 2014

American Institute of Physics: Oral Histories

Filed under: Archives,Audio,Physics,Science — Patrick Durusau @ 9:56 am

American Institute of Physics: Oral Histories

From the webpage:

The Niels Bohr Library & Archives holds a collection of over 1,500 oral history interviews. These range in date from the early 1960s to the present and cover the major areas and discoveries of physics from the past 100 years. The interviews are conducted by members of the staff of the AIP Center for History of Physics as well as other historians and offer unique insights into the lives, work, and personalities of modern physicists.

Read digitized oral history transcripts online

I don’t have a large collection audio data-set (see: Shining a light into the BBC Radio archives) but there are lots of other people who do.

If you are teaching or researching physics for the last 100 years, this is a resource you should not miss.

Integrating audio resources such as this one, at less than the full recording level (think of it as audio transclusion), into teaching materials would be a great step forward. To say nothing of being about to incorporate such granular resources into a library catalog.

I did not find an interview with Edward Teller but a search of the transcripts turned up three hundred and five (305) “hits” where he is mentioned in interviews. A search for J. Robert Oppenheimer netted four hundred and thirty-six (436) results.

If you know your atomic bomb history, you can guess between Teller and Oppenheimer which one would support the “necessity” defense for the use of torture. It would be an interesting study to see how the interviewees saw these two very different men.

Powered by WordPress