Another Word For It Patrick Durusau on Topic Maps and Semantic Diversity

December 9, 2017

Apache Kafka: Online Talk Series [Non-registration for 5 out of 6]

Filed under: Cybersecurity,ETL,Government,Kafka,Streams — Patrick Durusau @ 2:35 pm

Apache Kafka: Online Talk Series

From the webpage:

Watch this six-part series of online talks presented by Kafka experts. You will learn the key considerations in building a scalable platform for real-time stream data processing, with Apache Kafka at its core.

This series is targeted to those who want to understand all the foundational concepts behind Apache Kafka, streaming data, and real-time processing on streams. The sequence begins with an introduction to Kafka, the popular streaming engine used by many large scale data environments, and continues all the way through to key production planning, architectural and operational methods to consider.

Whether you’re just getting started or have already built stream processing applications for critical business functions, you will find actionable tips and deep insights that will help your enterprise further derive important business value from your data systems.

Video titles:

1. Introduction To Streaming Data and Stream Processing with Apache Kafka, Jay Kreps, Confluent CEO and Co-founder, Apache Kafka Co-creator.

2. Deep Dive into Apache Kafka by Jun Rao, Confluent Co-founder, Apache Kafka Co-creator.

3. Data Integration with Apache Kafka by David Tucker, Director, Partner Engineering and Alliances.

4. Demystifying Stream Processing with Apache Kafka, Neha Narkhede, Confluent CTO and Co-Founder, Apache Kafka Co-creator.

5. A Practical Guide to Selecting a Stream Processing Technology by Michael Noll, Product Manager, Confluent.

6. Streaming in Practice: Putting Kafka in Production by Roger Hoover, Engineer, Confluent. (Registration required. Anyone know a non-registration version of Hoover’s presentation?)

I was able to find versions of the first five videos that don’t require you to register to view them.

I make it a practice to dodge marketing department registrations whenever possible.

You?
August 31, 2017

January 3, 2017

Achieving a 300% speedup in ETL with Apache Spark

Filed under: Cloudera,ETL,Spark — Patrick Durusau @ 7:57 pm

Achieving a 300% speedup in ETL with Apache Spark by Eric Maynard.

From the post:

A common design pattern often emerges when teams begin to stitch together existing systems and an EDH cluster: file dumps, typically in a format like CSV, are regularly uploaded to EDH, where they are then unpacked, transformed into optimal query format, and tucked away in HDFS where various EDH components can use them. When these file dumps are large or happen very often, these simple steps can significantly slow down an ingest pipeline. Part of this delay is inevitable; moving large files across the network is time-consuming because of physical limitations and can’t be readily sped up. However, the rest of the basic ingest workflow described above can often be improved.

Campaign finance data suffers more from complexity and obscurity than volume.

However, there are data problems where volume and not deceit is the issue. In those cases, you may find Eric’s advice quite helpful.

March 10, 2015

MIT Group Cites “Data Prep” as a Data Science Bottleneck

Filed under: Data Science,ETL,Topic Maps — Patrick Durusau @ 7:38 pm

MIT Group Cites “Data Prep” as a Data Science Bottleneck

The bottleneck is varying data semantics. No stranger to anyone interested in topic maps. The traditional means of solving that problem is to clean the data for one purpose, which unless the basis for cleaning is recorded, leaves the data dirty for the next round of integration.

What do you think is being described in this text?:

Much of Veeramachaneni’s recent research has focused on how to automate this lengthy data prep process. “Data scientists go to all these boot camps in Silicon Valley to learn open source big data software like Hadoop, and they come back, and say ‘Great, but we’re still stuck with the problem of getting the raw data to a place where we can use all these tools,’” Veeramachaneni says.

The proliferation of data sources and the time it takes to prepare these massive reserves of data are the core problems Tamr is attacking. The knee-jerk reaction to this next-gen integration and preparation problem tends to be “Machine Learning” — a cure for all ills. But as Veeramachaneni points out, machine learning can’t resolve all data inconsistencies:

Veeramachaneni and his team are also exploring how to efficiently integrate the expertise of domain experts, “so it won’t take up too much of their time,” he says. “Our biggest challenge is how to use human input efficiently, and how to make the interactions seamless and efficient. What sort of collaborative frameworks and mechanisms can we build to increase the pool of people who participate?”

Tamr has built the very sort of collaborative framework Veeramachaneni mentions, drawing from the best of machine and human learning to connect hundreds or thousands of data sources.

Top-down, deterministic data unification approaches (such as ETL, ELT and MDM) were not designed to scale to the variety of hundreds or thousands or even tens of thousands of data silos (perpetual and proliferating). Traditional deterministic systems depend on a highly trained architect developing a “master” schema — “the one schema to rule them all” — which we believe is a red herring. Embracing the fundamental diversity and ever-changing nature of enterprise data and semantics leads you towards a bottom up, probabalistic approach to connecting data sources from various enterprise silos.

You also have to engage the source owners collaboratively to curate the variety of data at scale, which is Tamr’s core design pattern. Advanced algorithms automatically connect the vast majority of the sources while resolving duplications, errors and inconsistencies among source data of sources, attributes and records — a bottom-up, probabilistic solution that is reminiscent of Google’s full-scale approach to web search and connection. When the Tamr system can’t resolve connections automatically, it calls for human expert guidance, using people in the organization familiar with the data to weigh in on the mapping and improve its quality and integrity.

Off hand I would say it is a topic map authoring solution that features algorithms to assist the authors where authoring has been crowd-sourced.

What I don’t know is whether the insight of experts is captured as dark data (A matches B) or if their identifications are preserved so they can be re-used in the future (The properties of A that result in a match with the properties of B).

I didn’t register to I can’t see the “white paper.” Let me know how close I came if you decide to get the “white paper.” Scientists are donating research data in the name of open science but startups are still farming registration data.

September 10, 2014

ETL: The Dirty Little Secret of Data Science

Filed under: Data Science,ETL — Patrick Durusau @ 3:01 pm

ETL: The Dirty Little Secret of Data Science by Byron Ruth.

From the description:

“There is an adage that given enough data, a data scientist can answer the world’s questions. The untold truth is that the majority of work happens during the ETL and data preprocessing phase. In this talk I discuss Origins, an open source Python library for extracting and mapping structural metadata across heterogenous data stores.”

More than your usual ETL presentation, Byron makes several points of interest to the topic map community:

  • “domain knowledge” is necessary for effective ETL
  • “domain knowledge” changes and fades from dis-use
  • ETL isn’t transparent to consumers of data resulting from ETL, a “black box”
  • Data provenance is the answer to transparency, changing domain knowledge and persisting domain knowledge
  • “Provenance is a record that describes the people, institutions, entities, and activities, involved in producing, influencing, or delivering a piece of data or a thing.”
  • Project Origins, captures metadata and structures from backends and persists it to Neo4j

Great focus on provenance but given the lack of merging in Neo4j, the collation of information about a common subject, with different names, is going to be a manual process.

Follow @thedevel.

April 11, 2014

How-to: Process Data using Morphlines (in Kite SDK)

Filed under: Cloudera,ETL,Flume,MapReduce,Morphlines — Patrick Durusau @ 1:48 pm

How-to: Process Data using Morphlines (in Kite SDK) by Janos Matyas.

From the post:

SequenceIQ has an Apache Hadoop-based platform and API that consume and ingest various types of data from different sources to offer predictive analytics and actionable insights. Our datasets are structured, unstructured, log files, and communication records, and they require constant refining, cleaning, and transformation.

These datasets come from different sources (industry-standard and proprietary adapters, Apache Flume, MQTT, iBeacon, and so on), so we need a flexible, embeddable framework to support our ETL process chain. Hello, Morphlines! (As you may know, originally the Morphlines library was developed as part of Cloudera Search; eventually, it graduated into the Kite SDK as a general-purpose framework.)

To define a Morphline transformation chain, you need to describe the steps in a configuration file, and the framework will then turn into an in-memory container for transformation commands. Commands perform tasks such as transforming, loading, parsing, and processing records, and they can be linked in a processing chain.

In this blog post, I’ll demonstrate such an ETL process chain containing custom Morphlines commands (defined via config file and Java), and use the framework within MapReduce jobs and Flume. For the sample ETL with Morphlines use case, we have picked a publicly available “million song” dataset from Last.fm. The raw data consist of one JSON file/entry for each track; the dictionary contains the following keywords:

A welcome demonstration of Morphines but I do wonder about the statement:

Our datasets are structured, unstructured, log files, and communication records, and they require constant refining, cleaning, and transformation. (Emphasis added.)

If you don’t have experience with S3 and this pipleine, it is a good starting point for your investigations.

March 23, 2014

Data enhancing the Royal Society of…

Filed under: Cheminformatics,Data,ETL — Patrick Durusau @ 4:12 pm

Data enhancing the Royal Society of Chemistry publication archive by Antony Williams.

Abstract:

The Royal Society of Chemistry has an archive of hundreds of thousands of published articles containing various types of chemistry related data – compounds, reactions, property data, spectral data etc. RSC has a vision of extracting as much of these data as possible and providing access via ChemSpider and its related projects. To this end we have applied a combination of text-mining extraction, image conversion and chemical validation and standardization approaches. The outcome of this project will result in new chemistry related data being added to our chemical and reaction databases and in the ability to more tightly couple web-based versions of the articles with these extracted data. The ability to search across the archive will be enhanced as a result. This presentation will report on our progress in this data extraction project and discuss how we will ultimately use similar approaches in our publishing pipeline to enhance article markup for new publications.

The data mining Antony details on the Royal Society of Chemistry is impressive!

But as Anthony notes at slide #30, it isn’t a long term solution:

We should NOT be mining data out of future publications (emphasis added)

I would say the same thing for metadata/subject identities in data. For some data and some subjects, we can, after the fact, reconstruct properties to identify the subjects they represent.

Data/text mining would be more accurate and easier if subjects were identified at the time of authoring. Perhaps even automatically or at least subject to a user’s approval.

More accurate than researchers removed from an author by time, distance and even profession, trying to guess what subject an author may have meant.

Better semantic authoring support now, will reduce the cost and improve the accuracy of data mining in the future.

March 22, 2014

Opening data: Have you checked your pipes?

Filed under: Data Mining,ETL,Open Access,Open Data — Patrick Durusau @ 7:44 pm

Opening data: Have you checked your pipes? by Bob Lannon.

From the post:

Code for America alum Dave Guarino had a post recently entitled “ETL for America”. In it, he highlights something that open data practitioners face with every new project: the problem of Extracting data from old databases, Transforming it to suit a new application or analysis and Loading it into the new datastore that will support that new application or analysis. Almost every technical project (and every idea for one) has this process as an initial cost. This cost is so pervasive that it’s rarely discussed by anyone except for the wretched “data plumber” (Dave’s term) who has no choice but to figure out how to move the important resources from one place to another.

Why aren’t we talking about it?

The up-front costs of ETL don’t come up very often in the open data and civic hacking community. At hackathons, in funding pitches, and in our definitions of success, we tend to focus on outputs (apps, APIs, visualizations) and treat the data preparation as a collateral task, unavoidable and necessary but not worth “getting into the weeds” about. Quoting Dave:

The fact that I can go months hearing about “open data” without a single
mention of ETL is a problem. ETL is the pipes of your house: it’s how you
open data.

It’s difficult to point to evidence that this is really the case, but I personally share Dave’s experience. To me, it’s still the elephant in the room during the proceedings of any given hackathon or open data challenge. I worry that the open data community is somehow under the false impression that, eventually in the sunny future, data will be released in a more clean way and that this cost will decrease over time.

It won’t. Open data might get cleaner, but no data source can evolve to the point where it serves all possible needs. Regardless of how easy it is to read, the data published by government probably wasn’t prepared with your new app idea in mind.

Data transformation will always be necessary, and it’s worth considering apart from the development of the next cool interface. It’s a permanent cost of developing new things in our space, so why aren’t we putting more resources toward addressing it as a problem in its own right? Why not spend some quality time (and money) focused on data preparation itself, and then let a thousand apps bloom?

If you only take away this line:

Open data might get cleaner, but no data source can evolve to the point where it serves all possible needs. (emphasis added)

From Bob’s entire post, reading it has been time well spent.

Your “clean data” will at times be my “dirty data” and vice versa.

Documenting the semantics we “see” in data and that drives our transformations into “clean” data for us, stands a chance of helping the next person in the line to use that data.

Think of it as an accumulation of experience with a data sets and the results obtained from it.

Or you can just “wing it” with ever data set you encounter and so shall we all.

Your call.

I first saw this in a tweet by Dave Guarino.

November 27, 2013

Data Quality, Feature Engineering, GraphBuilder

Filed under: Data Quality,Design,ETL,GraphBuilder,Pig — Patrick Durusau @ 3:06 pm

Avoiding Cluster-Scale Headaches with Better Tools for Data Quality and Feature Engineering by Ted Willke.

Ted’s second slide reads:

Machine Learning may nourish the soul…

…but Data Preparation will consume it.

Ted starts off talking about the problems of data preparation but fairly quickly focuses in on property graphs and using Pig ETL.

He also outlines outstanding problems with Pig ETL (slides 29-32).

Nothing surprising but good news that Graph Builder 2 Alpha is due out in Dec’ 13.

BTW, GraphBuilder 1.0 can be found at: https://01.org/graphbuilder/

November 13, 2013

Testing ETL Processes

Filed under: ETL,Topic Maps — Patrick Durusau @ 8:22 pm

Testing ETL Processes by Gary Sieling.

From the post:

ETL (“extract, transform, load”) come in many shapes, sizes, and product types, and occur under many names – “data migration” projects, business intelligence software, analytics, reporting, scraping, database upgrades, and so on. I’ve collected some notes, attempting to classify these projects by their principal attributes, so that you can estimate the risks and plan the testing process for similar projects- if you have other additions to this list, please add comments below.

I count twenty-six (26) distinct risks and there may be others.

Are you in the eternal cycle of ETL?

For data to be improved, it’s ETL time?

There are alternatives.

Such as annotating data in place.

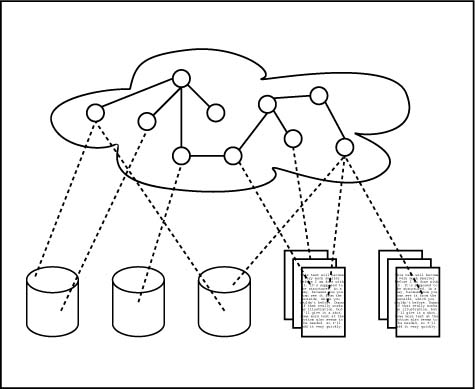
If you have ever seen the graphic of a topic map hovering over an infospace, you know what I am talking about.

Topic Map

(Image by Lars Marius Garshol)

Questions?

November 11, 2013

Hadoop – 100x Faster… [With NO ETL!]

Filed under: ETL,Hadoop,HDFS,MapReduce,Topic Maps — Patrick Durusau @ 8:32 pm

Hadoop – 100x Faster. How we did it… by Nikita Ivanov.

From the post:

Almost two years ago, Dmitriy and I stood in front of a white board at GridGain’s office thinking: “How can we deliver the real-time performance of GridGain’s in-memory technology to Hadoop customers without asking them rip and replace their systems and without asking them to move their datasets off Hadoop?”.

Given Hadoop’s architecture – the task seemed daunting; and it proved to be one of the more challenging engineering puzzles we have had to solve.

After two years of development, tens of thousands of lines of Java, Scala and C++ code, multiple design iterations, several releases and dozens of benchmarks later, we finally built a product that can deliver real-time performance to Hadoop customers with seamless integration and no tedious ETL. Actual customers deployments can now prove our performance claims and validate our product’s architecture.

Here’s how we did it.

The Idea – In-Memory Hadoop Accelerator

Hadoop is based on two primary technologies: HDFS for storing data, and MapReduce for processing these data in parallel. Everything else in Hadoop and the Hadoop ecosystem sits atop these foundation blocks.

Originally, neither HDFS nor MapReduce were designed with real-time performance in mind. In order to deliver real-time processing without moving data out of Hadoop onto another platform, we had to improve the performance of both of these subsystems. (emphasis added)

The highlighted phrase is the key isn’t it?

In order to deliver real-time processing without moving data out of Hadoop onto another platform

ETL is down time, expense and risk of data corruption.

Given a choice between making your current data platform (of whatever type) more robust or risking a migration to a new data platform, which one would you choose?

Bear in mind those 2.5 million spreadsheets that Felienne mentions in her presentation.

Are you really sure you want to ETL on all you data?

As opposed to making your most critical data more robust and enhanced by other data? All while residing where it lives right now.

Are you ready to get off the ETL merry-go-round?

October 7, 2013

Jump-start your data pipelining into Google BigQuery

Filed under: ETL,Google BigQuery,Google Compute Engine — Patrick Durusau @ 3:18 pm

Like they said at Woodstock, “if you don’t think ETL is all that weird,” wait, wasn’t that, “if you don’t think capitalism is all that weird?”

Maybe, maybe not. But in any event, Wally Yau has written guidance on getting the Google Compute Engine up and ready do to some ETL in Jump-start your data pipelining into Google BigQuery

Or if you have already “cooked” data there is another sample application, Automated File Loader for BigQuery, shows how to load data that will produce your desired results.

Both of these are from: Getting Started with Google BigQuery.

You do know that Google is located in the United States?

July 14, 2013

Unlocking the Big Data Silos Through Integration

Filed under: BigData,Data Integration,Data Silos,ETL,Silos — Patrick Durusau @ 7:01 pm

Unlocking the Big Data Silos Through Integration by Theo Priestly.

From the post:

Big Data, real-time and predictive analytics present companies with the unparalleled ability to understand consumer behavior and ever-shifting market trends at a relentless pace in order to take advantage of opportunity.

However, organizations are entrenched and governed by silos; data resides across the enterprise in the same way, waiting to be unlocked. Information sits in different applications, on different platforms, fed by internal and external sources. It’s a CIO’s headache when the CEO asks why the organization can’t take advantage of it. According to a recent survey, 54% of organizations state that managing data from various sources is their biggest challenge when attempting to make use of the information for customer analytics.

(…)

Data integration. Again?

A problem that just keeps on giving. The result of every ETL operation is a data set that needs another ETL operation sooner or later.

If Topic Maps weren’t a competing model but a way to model your information for re-integration, time after time, that would be a competitive advantage.

Both for topic maps and your enterprise.

July 12, 2013

Introducing Morphlines:…

Filed under: Cloudera,ETL,Hadoop,Morphlines — Patrick Durusau @ 3:07 pm

Introducing Morphlines: The Easy Way to Build and Integrate ETL Apps for Hadoop by Wolfgang Hoschek.

From the post:

Cloudera Morphlines is a new open source framework that reduces the time and skills necessary to integrate, build, and change Hadoop processing applications that extract, transform, and load data into Apache Solr, Apache HBase, HDFS, enterprise data warehouses, or analytic online dashboards. If you want to integrate, build, or facilitate transformation pipelines without programming and without substantial MapReduce skills, and get the job done with a minimum amount of fuss and support costs, this post gets you started.

A “morphline” is a rich configuration file that makes it easy to define a transformation chain that consumes any kind of data from any kind of data source, processes the data, and loads the results into a Hadoop component. It replaces Java programming with simple configuration steps, and correspondingly reduces the cost and integration effort associated with developing, maintaining, or integrating custom ETL projects.

Morphlines is a library, embeddable in any Java codebase. A morphline is an in-memory container of transformation commands. Commands are plugins to a morphline that perform tasks such as loading, parsing, transforming, or otherwise processing a single record. A record is an in-memory data structure of name-value pairs with optional blob attachments or POJO attachments. The framework is extensible and integrates existing functionality and third-party systems in a simple and straightforward manner.

The Morphlines library was developed as part of Cloudera Search. It powers a variety of ETL data flows from Apache Flume and MapReduce into Solr. Flume covers the real time case, whereas MapReduce covers the batch processing case.

Since the launch of Cloudera Search, Morphlines development has graduated into the Cloudera Development Kit (CDK) in order to make the technology accessible to a wider range of users, contributors, integrators, and products beyond Search. The CDK is a set of libraries, tools, examples, and documentation focused on making it easier to build systems on top of the Hadoop ecosystem (and hence a perfect home for Morphlines). The CDK is hosted on GitHub and encourages involvement by the community.

(…)

The sidebar promises: Morphlines replaces Java programming with simple configuration steps, reducing the cost and effort of doing custom ETL.

Sound great!

But how do I search one or more morphlines for the semantics of the records/fields that are being processed or the semantics of that processing?

If I want to save “cost and effort,” shouldn’t I be able to search for existing morphlines that have transformed particular records/fields?

True, morphlines have “#” comments but that seems like a poor way to document transformations.

How would you test for field documentation?

Or make sure transformations of particular fields always use the same semantics?

Ponder those questions while you are reading:

Cloudera Morphlines Reference Guide

and,

Syntax – HOCON github page.

If we don’t capture semantics at the point of authoring, subsequent searches are mechanized guessing.

July 7, 2013

import.io

Filed under: Data,ETL,WWW — Patrick Durusau @ 4:18 pm

import.io

The steps listed by import.io on its “How it works” page:

Find: Find an online source for your data, whether it’s a single web page or a search engine within a site. Import•io doesn’t discriminate; it works with any web source.

Extract: When you have identified the data you want, you can begin to extract it. The first stage is to highlight the data that you want. You can do this by giving us a few examples and our algorithms will identify the rest. The next stage is to organise your data. This is as simple as creating columns to sort parts of the data into, much like you would do in a spreadsheet. Once you have done that we will extract the data into rows and columns.

If you want to use the data once, or infrequently, you can stop here. However, if you would like a live connection to the data or want to be able to access it programatically, the next step will create a real-time connection to the data.

Connect: This stage will allow you to create a real-time connection to the data. First you have to record how you obtained the data you extracted. Second, give us a couple of test cases so we can ensure that, if the website changes, your connection to the data will remain live.

Mix: One of the most powerful features of the platform is the ability to mix data from many sources to form a single data set. This allows you to create incredibly rich data sets by combing hundred of underlying data points from many different websites and access them via the application or API as a single source. Mixing is as easy a clicking the sources you want to mix together and saving that mix as a new real-time data set.

Use: Simply copy your data into your favourite spreadsheet software or use our APIs to access it in an application.

Developer preview but interesting for a couple of reasons.

First simply as an import service. I haven’t tried it (yet) so your mileage may vary. Reports welcome.

Second, I like the (presented) ease of use approach.

Imagine a topic map application for some specific domain that was as matter-of-fact as what I quote above.

Something to think about.

June 12, 2013

Stealth-mode 28msec wants to build a Tower of Babel for databases

Filed under: ETL,JSONiq,Zorba — Patrick Durusau @ 3:31 pm

Stealth-mode 28msec wants to build a Tower of Babel for databases by Derrick Harris.

From the post:

28msec is not your average database startup but, then again, neither is its mission. The company — still in stealth mode (until our Structure Launchpad event on June 20) after about seven years of existence — has created a data-processing platform that it says can take and analyze data from any source, and then deliver the results in real time.

The company took so long to officially launch, CEO Eric Kish told me, because it took such a long time to build. The 28msec history goes like this: The early investors are database industry veterans (one was employee No. 6 at Oracle) who, at some point in 2006, envisioned an explosion in data formats and databases. Their solution was to create a platform able to extract data from any of these sources, transform it into a standard format, and then let users analyze it using a single query language that looks a lot like the SQL they already know. 28msec is based on the open source JSONiq and Zorba query languages and will be available as a cloud service.

Alex Popescu points to his: Main difference between Hadapt and Microsoft Polybase, HAWQ, SQL-H to underline the point that we all know ETL works, the question is what is required to optimize it.

I first saw this at Alex Popescu’s 28msec – query data from any source in real time.

PS: Should I send a note along to the NSA or just assume they are listening? 😉

June 2, 2013

Take DMX-h ETL Pre-Release for a Test Drive!

Filed under: ETL,Hadoop,Integration — Patrick Durusau @ 6:49 pm

Take DMX-h ETL Pre-Release for a Test Drive! by Keith Kohl.

From the post:

Last Monday, we announced two new DMX-h Hadoop products, DMX-h Sort Edition and DMX-h ETL Edition. Several Blog posts last week included why I thought the announcement was cool and also some Hadoop benchmarks on both TeraSort and also running ETL.

Part of our announcement was the DMX-h ETL Pre-Release Test Drive. The test drive is a trial download of our DMX-h ETL software. We have installed our software on our partner Cloudera’s VM (VMware) image complete with the user case accelerators, sample data, documentation and even videos. While the download is a little large ─ ok it’s over 3GB─ it’s a complete VM with Linux and Cloudera’s CDH 4.2 Hadoop release (the DMX-h footprint is a mere 165MB!).

Cool!

Then Keith asks later in the post:

The test drive is not your normal download. This is actually a pre-release of our DMX-h ETL product offering. While we have announced our product, it is not generally available (GA) yet…scheduled for end of June. We are offering a download of a product that isn’t even available yet…how many vendors do that?!

Err, lots of them? It’s call a beta/candidate/etc release?

😉

Marketing quibbles aside, it does sound quite interesting.

In some ways I would like to see the VM release model become more common.

Test driving software should not be a install/configuration learning experience.

That should come after users are interested in the software.

BTW, interesting approach, at least reading the webpages/documentation.

Doesn’t generate code for conversion/ETL so there is no code to maintain. Written against the DMX-h engine.

Need to think about what that means in terms of documenting semantics.

Or reconciling different ETL approaches in the same enterprise.

More to follow.

February 21, 2013

Pfizer swaps out ETL for data virtualization tools

Filed under: Data Virtualization,Data Warehouse,ETL,Virtualization,Visualization — Patrick Durusau @ 7:35 pm

Pfizer swaps out ETL for data virtualization tools by Nicole Laskowski.

From the post:

Pfizer Inc.’s Worldwide Pharmaceutical Sciences division, which determines what new drugs will go to market, was at a technological fork in the road. Researchers were craving a more iterative approach to their work, but when it came to integrating data from different sources, the tools were so inflexible that work slowdowns were inevitable.

At the time, the pharmaceutical company was using one of the most common integration practices known as extract, transform, load (ETL). When a data integration request was made, ETL tools were used to reach into databases or other data sources, copy the requested data sets and transfer them to a data mart for users and applications to access.

But that’s not all. The Business Information Systems (BIS) unit of Pfizer, which processes data integration requests from the company’s Worldwide Pharmaceutical Sciences division, also had to collect specific requirements from the internal customer and thoroughly investigate the data inventory before proceeding with the ETL process.

“Back then, we were basically kind of in this data warehousing information factory mode,” said Michael Linhares, a research fellow and the BIS team leader.

Requests were repetitious and error-prone because ETL tools copy and then physically move the data from one point to another. Much of the data being accessed was housed in Excel spreadsheets, and by the time that information made its way to the data mart, it often looked different from how it did originally.

Plus, the integration requests were time-consuming since ETL tools process in batches. It wasn’t outside the realm of possibility for a project to take up to a year and cost $1 million, Linhares added. Sometimes, his team would finish an ETL job only to be informed it was no longer necessary.

“That’s just a sign that something takes too long,” he said.

Cost, quality and time issues aside, not every data integration request deserved this kind of investment. At times, researchers wanted quick answers; they wanted to test an idea, cross it off if it failed and move to the next one. But ETL tools meant working under rigid constraints. Once Linhares and his team completed an integration request, for example, they were unable to quickly add another field and introduce a new data source. Instead, they would have to build another ETL for that data source to be added to the data mart.

Bear in mind that we were just reminded, Leveraging Ontologies for Better Data Integration, that you have to understand data to integrate data.

That lesson holds true for integrating data after data virtualization.

Where are you going to write down your understanding of the meaning of the data you virtualize?

So subsequent users can benefit from your understanding of that data?

Or perhaps add their understanding to yours?

Or to have the capacity to merge collections of such understandings?

I would say a topic map.

You?

September 14, 2012

JMyETL

Filed under: CUBRID,ETL,MySQL,Oracle,PostgreSQL,SQL Server — Patrick Durusau @ 1:15 pm

JMyETL, an easy to use ETL tool that supports 10 different RDBMS by Esen Sagynov.

From the post:

JMyETL is a very useful and simple Java based application for Windows OS which allows users to import and export data from/to various database systems. For example:

  • CUBRID –> Sybase ASE, Sybase ASA, MySQL, Oracle, PostgreSQL, SQL Server, DB2, Access, SQLite
  • MySQL –> Sybase ASE/ASA, Oracle, Access, PostgreSQL, SQL Server, DB2, SQLite, CUBRID
  • Sybase ASE –> Sybase ASA, MySQL, Oracle, Access, PostgreSQL, SQL Server, DB2, SQLite, CUBRID
  • Sybase ASA –> Sybase ASE, MySQL, Oracle, Access, PostgreSQL, SQL Server, DB2, SQLite, CUBRID
  • Oracle –> Sybase ASA, Sybase ASE, MySQL, Access, PostgreSQL, SQL Server, DB2, SQLite, CUBRID
  • Access –> Sybase ASE, Sybase ASA, MySQL, Oracle, PostgreSQL, SQL Server, DB2, SQLite, CUBRID
  • PostgreSQL –> Sybase ASE, Sybase ASA, MySQL, Oracle, Access, SQL Server, DB2, SQLite, CUBRID
  • SQL Server –> Sybase ASE, Sybase ASA, MySQL, Oracle, PostgreSQL, Access, DB2, SQLite, CUBRID
  • DB2 –> Sybase ASE, Sybase ASA, MySQL, Oracle, PostgreSQL, SQL Server, Access, SQLite, CUBRID
  • SQLite –> Sybase ASE, Sybase ASA, MySQL, Oracle, PostgreSQL, SQL Server, DB2, Access, CUBRID

Just in case you need a database to database ETL utility.

I first saw this at DZone.

May 14, 2012

ETL 2.0 – Data Integration Comes of Age

Filed under: Data Integration,ETL — Patrick Durusau @ 12:18 pm

ETL 2.0 – Data Integration Comes of Age by Robin Bloor PhD & Rebecca Jozwiak.

Well…., sort of.

It is a “white paper” and all that implies but when you read:

Versatility of Transformations and Scalability

All ETL products provide some transformations but few are versatile. Useful transformations may involve translating data formats and coded values between the data sources and the target (if they are, or need to be, different). They may involve deriving calculated values, sorting data, aggregating data, or joining data. They may involve transposing data (from columns to rows) or transposing single columns into multiple columns. They may involve performing look-ups and substituting actual values with looked-up values accordingly, applying validations (and rejecting records that fail) and more. If the ETL tool cannot perform such transformations, they will have to be hand coded elsewhere – in the database or in an application.

It is extremely useful if transformations can draw data from multiple sources and data joins can be performed between such sources “in flight,” eliminating the need for costly and complex staging. Ideally, an ETL 2.0 product will be rich in transformation options since its role is to eliminate the need for direct coding all such data transformations.

you start to lose what little respect you had for industry “white papers.”

Not once in this white paper is the term “semantics” used. It is also innocent of using the term “documentation.”

Don’t you think an ETL 2.0 application should enable re-use of “useful transformations?”

Wouldn’t that be a good thing?

Instead of IT staff starting from zero with every transformation request?

Failure to capture the semantics of data leaves you at ETL 2.0, while everyone else is at ETL 3.0.

Where does your business sense tell you about that choice?

(ETL 3.0 – Documented, re-usable, semantics for data and data structures. Enables development of transformation modules for particular data sources.)

December 23, 2011

ETL Demo with Data From Data.Gov

Filed under: ETL,Expressor — Patrick Durusau @ 4:28 pm

ETL Demo with Data From Data.Gov by Kevin E. Kline.

From the post:

A little over a month ago, I wrote an article (Is There Such a Thing as Easy ETL) about expressor software and their desktop ETL application, expressor Studio. I wrote about how it seemed much easier than the native ETL tools in SQL Server when I was reading up on the tool, but that the “proof would be in the pudding” so to speak when I actually tried it out loading some free (and incredibly useful) data from the US federal data clearinghouse, Data.Gov.

If you’d rather not read my entire previous article – quick recap, expressor Studio uses “semantic types” to manage and abstract mappings between sources and targets. In essence, these types are used for describing data in terms that humans can understand—instead of describing data in terms that computers can understand. The idea of semantic abstraction is quite intriguing and it gave me an excuse to use data from data.gov to build a quick demo. You can download the complete data set I used from the following location: International Statistics. (Note: I have this dream that I’m going to someday download all of this free statistical data sets, build a bunch of amazing and high-value analytics, and make a mint. If, instead, YOU do all of those things, then please pay to send at least one of my seven kids to college in repayment for the inspiration. I’m not kidding. I have SEVEN kids. God help me).

The federal government, to their credit, has made great progress in making data available. However, there is a big difference between accessing data and understanding data. When I first looked at one of the data files I downloaded, I figured it was going to take me years to decrypt the field names. Luckily, I did notice an Excel file with field names and descriptions. Seriously, there are single letter field names in these files where the field name “G” has a description of “Age group indicator” (Oh Wow). See the figure below.

I like Kevin’s point about the difference between “accessing data and understanding data.”

Powered by WordPress