Another Word For It Patrick Durusau on Topic Maps and Semantic Diversity

December 15, 2017

Colorized Math Equations [Algorithms?]

Filed under: Algorithms,Examples,Visualization — Patrick Durusau @ 5:13 pm

Colorized Math Equations by Kalid Azad.

From the post:

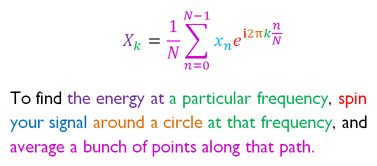
Years ago, while working on an explanation of the Fourier Transform, I found this diagram:

(source)

Argh! Why aren’t more math concepts introduced this way?

Most ideas aren’t inherently confusing, but their technical description can be (e.g., reading sheet music vs. hearing the song.)

My learning strategy is to find what actually helps when learning a concept, and do more of it. Not the stodgy description in the textbook — what made it click for you?

The checklist of what I need is ADEPT: Analogy, Diagram, Example, Plain-English Definition, and Technical Definition.

Here’s a few reasons I like the colorized equations so much:

  • The plain-English description forces an analogy for the equation. Concepts like “energy”, “path”, “spin” aren’t directly stated in the equation.
  • The colors, text, and equations are themselves a diagram. Our eyes bounce back and forth, reading the equation like a map (not a string of symbols).
  • The technical description — our ultimate goal — is not hidden. We’re not choosing between intuition or technical, it’s intuition for the technical.

Of course, we still need examples to check our understanding, but 4/5 ain’t bad!

Azad includes a LaTeX template that he uses to create colorized math equations.

Consider the potential use of color + explanation for algorithms. Being mindful that use of color presents accessibility issues that will require cleverness on your part.

Another tool for your explanation quiver!

January 30, 2012

The Most Brutal Man Page

Filed under: Examples,Topic Maps — Patrick Durusau @ 8:02 pm

The most brutal man page

John Cook quotes The Linux Command Line by William Shotts as singling out the bash man page as the most brutal of all the man pages.

Maybe so, I don’t ever recall trying to read it in its entirety. But I haven’t made a systematic comparison of all the man pages for that matter.

But let’s take Shotts at his word, that the man page for bash is the worse.

Recalling that topic maps got its start in an X Windows documentation project, seems appropriate to see if topic maps could provide an “assist” with the most brutal man page ever.

I get seventy (70) pages as a PDF version of the Ubuntu bash man page. (Not Shotts reported eighty plus (80+) pages.)

A topic map for the bash man page would be of interest only to geeks but hopefully influential geeks. And if nothing else, it would be good warm up to take on something like USC Title 26 and its regulations, court decisions and opinions. 😉 (The tax code of the federal government in the United States.)

June 8, 2011

Topic Maps: “Hello World” Example

Filed under: Examples,Topic Maps — Patrick Durusau @ 10:24 am

Topic Maps: “Hello World” Example

In a tweet on 6 June 2011, Inge Henriksen reminded us of this “Hello World” example for topic maps.

Thanks Inge!

March 21, 2011

KDD Cup

Filed under: Dataset,Examples,Music Retrieval — Patrick Durusau @ 8:48 am

KDD Cup

From the website:

People have been fascinated by music since the dawn of humanity. A wide variety of music genres and styles has evolved, reflecting diversity in personalities, cultures and age groups. It comes as no surprise that human tastes in music are remarkably diverse, as nicely exhibited by the famous quotation: “We don’t like their sound, and guitar music is on the way out” (Decca Recording Co. rejecting the Beatles, 1962).

Yahoo! Music has amassed billions of user ratings for musical pieces. When properly analyzed, the raw ratings encode information on how songs are grouped, which hidden patterns link various albums, which artists complement each other, and above all, which songs users would like to listen to.

Such an exciting analysis introduces new scientific challenges. The KDD Cup contest releases over 300 million ratings performed by over 1 million anonymized users. The ratings are given to different types of items-songs, albums, artists, genres-all tied together within a known taxonomy.

Important dates:

March 15, 2011 Competition begins

June 30, 2011 Competition ends

July 3, 2011 Winners notified

August 21, 2011 Workshop

An interesting data set that focuses on machine learning and prediction.

Equally interesting would be merging this data set with other music data sets.

March 8, 2011

Thomaner Project

Filed under: Examples,Music Retrieval — Patrick Durusau @ 9:58 am

Thomaner Project

Press coverage of a project in connection with the 800th anniversary of the famous boy choral Thomaner.

The topic map project is a database for the chorale’s repertoire from 1808 to 2008.

The German newspaper article report notes that only 20 years of the 200 year span are complete.

Funding is being sought to complete the remainder.

Not exactly the Rolling Stone or Lady Gaga is it?

March 5, 2011

Keep an Eye on the emerging Open-Source Analytics Stack – Post

Filed under: Examples,Marketing — Patrick Durusau @ 3:34 pm

Keep an Eye on the emerging Open-Source Analytics Stack

David Smith’s summary captures the tone of the piece:

For the business user, the key takeaway is that this data analytics stack, built on commodity hardware and leading-edge open-source software, and a is a lower-cost, higher-value alternative to the existing status quo solutions offered by traditional vendors. Just a couple of years ago, these types of robust analytic capabilities were only available through major vendors. Today, the open-source community provides everything that the traditional vendors provide — and more. With open-source, you have choice, support, lower costs and faster cycles of innovation. The open-source analytics stack is more than a handy collection of interoperable tools — it’s an intelligence platform.

In that sense, the open-source analytics stack is genuinely revolutionary.

I use and promote the use of open source software so don’t take this as being anti-open source.

I think the jury is still out on the lower-cost question.

In part because the notion that anyone who can use a keyboard and an open source package is qualified to do BI, will reap its own reward.

There was a rumor years ago that local bar associations actually sponsored the “How to Avoid Probate” kits.

Reasoning that self-help would only increase the eventual fees for qualified counsel.

Curious to see how much of the “lower cost” of open source software is absorbed by correcting amateurish mistakes (assuming they are even admitted).

March 3, 2011

Baking a topic map (err, I mean bread)

Filed under: Authoring Topic Maps,Examples,Topic Maps — Patrick Durusau @ 1:49 pm

Benjamin Bock asked last week about how to topic map ingredients (and the measures of) as well as the order of steps in a recipe.

I can’t give you a complete answer in one post (or even in several) but I can highlight some of the issues and possible solutions.

First, we need a recipe. I will be using the basic bread recipe, from the Artisan Bread in 5 Minutes a Day site, which lists the following ingredients:

  • 3 1/2 cups lukewarm water
  • 4 teaspoons active dry yeast
  • 4 teaspoons coarse salt
  • 7 1/4 cups (2 lb. 4 oz.; 1027.67 grams) unbleached all-purpose flour (measure using scoop and sweep method)

That’s right. Carol has been teaching me to cook and I really enjoy baking bread.

If it is a good day, call ahead and I am likely to have fresh bread out of the oven within minutes of your arrival.

Anyway, at first blush, this looks easy, after all , people have been passing recipes along for thousands of years.

Second look, not so easy.

First try at baking the topic map

The recipe itself has a name, Master Artisan Bread Recipe.

That looks like a promising place to start, we have a recipe, it has a name and from what we read above, some ingredients.

We could simply create a topic for the recipe, record its name and include the ingredients as occurrences, of type ingredient.

After all, since we can search for strings across the topic map, it won’t be hard to find recipes with yeast, flour, etc., whatever ingredient we want.

And that would be a perfectly valid topic map.

Well, except that you or I may want to say something about the yeast, as a subject. Could be which brand to use, etc.

Could simply stuff that information into the occurrence but topic maps have a better solution.

Second try at baking the topic map

Isn’t there a hint in the way we have passed recipes down for years about how we should represent them in a topic map?

That is each ingredient, more or less, stands on its own. We can talk about each one and often measure them all out before starting.

What if we represented each ingredient as a subject, that is with a topic?

And we represent their relationships to the recipe, remember Master Artisan Bread Recipe?, with an ingredient_of association. (Stolen shamelessly from Sam Hunting’s chapter, How to Start Topic Mapping Right Away with the XTM Specification, in XML Topic Maps, ed. by Jack Park and Sam Hunting.)

Oh, err, one thing, how do I get from 3 1/2 cups lukewarm water from water as a subject in an ingredient_of association?

That wasn’t explained very well. 😉

Third try at baking the topic map

Err, hmmm, yes (stalling for time),

Well, let’s break the water subject out and see if we can establish some principles for a solution that works for the other ingredients.

The measurement, 3 1/2 cups and the temperature, lukewarm, do not affect the subject identity of the water, but the first establishes a particular/specific, set aside amount of water and lukewarm, defines a temperature for that set aside portion.

At its core the problem is that we would prefer to talk about water as an ingredient and to not have to use 3 1/2 cups as part of its identity.

That is, how would your topic map look with an ingredient_of association between a recipe and 3 1/2 cups of water?

Would your 3 1/2 cups of water only merge with other 3 1/2 cups of water topics in other recipes?

That sounds like a bad plan.

Fourth try at baking the topic map

Let’s think about this for a moment.

We want ingredient as subject so we can say things about them. We also want to record the amount or some condition of an ingredient as part of the recipe.

One work around, not necessarily a good one (discussion please!) would be to model the recipe – ingredient association as a three role relationship:

  • recipe
  • ingredient
  • measure_condition

That breaks out the measurement or condition of the ingredient as a separate subject. It also dodges some fairly complicated issues with regard to measurement but those are probably not critical to a bread recipe anyway.

Oh, sorry, did not mean to avoid answering Benjamin’s question about ordering steps in the recipe.

Did you know that when practicing my typing in grade school I duplicated my mother’s recipes and then discarded the originals?

I also left off the steps then. Had the amounts and ingredients, but no steps. 😉

She took it good naturedly enough but declined my further help where the recipe box was concerned.

I promise I won’t repeat that error but I won’t reach the step question today.

Besides, interested to hear what you think about the recipe illustration so far?

Understand that I need to include syntax but thought I would do that in the next post, before I get to the steps question.
March 2, 2011

Intelligence: Practice, Problems and Prospects

Filed under: Examples,Topic Maps — Patrick Durusau @ 10:56 am

Intelligence: Practice, Problems and Prospects Spring 2005 MIT Course on intelligence issues.

I mention this course because intelligence is an area where it is popular to talk about connecting the dots and sharing data.

Note that I said popular to talk about connecting the dots and sharing data.

If news reports are to be credited, always a risky proposition, the US intelligence community is only marginally less Balkanized than it was on 9/11.

Institutional goals and imperatives are more important than any national interest, such as sharing intelligence data, and are likely to remain so.

Promoting topic maps as a means of sharing information in a non-sharing environment, with known imperatives driving the non-sharing, is a losing proposition.

Pitching topic maps to supra-agency leadership is unlikely to succeed, because it requires access to that leadership, a leadership already in the reach of the intelligence Balkan leadership.

Two suggested changes in selling topic maps to the intelligence community:

1) Sell topic maps to individual agencies on the basis they can better integrate their information and information they have gotten from other agencies. Not so much a sharing rhetoric as making the best use of generated and stolen intelligence sort of argument.

2) Remember that US intelligence services aren’t the only intelligence services in the world. It is likely they all suffer from the sort of Balkanization seen in the US but it is also true that some of them may be flexible enough to over come it.

Having successful use of topic maps elsewhere could drive their adoption in the US.

March 1, 2011

cablegate.core 0.2.0-20110224

Filed under: Authoring Topic Maps,Examples,Topic Map Software,Topic Maps — Patrick Durusau @ 10:48 am

Did not mean to miss the updated release of cablegate.core yesterday.

Download a copy and post your comments/suggestions.

Better yet, contribute your analysis via topic maps that can be merged with other topic maps.

Use topic maps to make cablegate more than a titillating annoyance.

The thought occurs to me that with all the unrest in Libya, there could be a fresh crop of diplomatic cables about to become available.

And why not? It would be a nice window into the recent history in the region.

Would that endanger some actors?

Well, you know what they say about playing in the street.

And, they weren’t acting in anyone’s interest but their own, so I would not lose any sleep over it.

February 26, 2011

When You Hear Hoofbeats… – Post

Filed under: Examples,Topic Maps — Patrick Durusau @ 4:08 pm

When You Hear Hoofbeats… Bob Carpenter is learning C++ and has no difficulty getting error messages, but is having difficulty discovering the causes of those error messages.

Bob describes his need as one of proceeding from a known error message, to one or more possible causes. A “reverse index” in his words.

I suspect that would be a very useful thing to have for any number of programming languages, not to mention shells, utilities and the like.

It occurs to me that topic maps, via associations, could be the very mechanism that Bob is looking for.

At least in terms of the mechanics, filling it with content would be another matter entirely.

Thoughts on how to structure such a topic map?

Or on how to best organize a project to populate it?

Perhaps harvesting “error messages” from posts/blogs/etc. with pointers back to the same and offering the opportunity to specify the possible cause?

With some recognition mechanism for those contributing the most often recognized by other contributors causes?

Has the issue commonly found in topic map projects:

  1. Data harvesting
  2. Interfaces
  3. Management of the map
  4. Subject Identity
  5. etc.

Thoughts? Suggestions?

February 14, 2011

Technology vs. Teaching?

Filed under: Examples,Marketing,Topic Maps — Patrick Durusau @ 11:25 am

The reported experiences with technology at “Data Bootcamp” tutorial at O’Reilly’s Strata Conference 2011, installation and other woes, made me think about technology and teaching for topic maps.

Is it a question of technology vs. teaching?

If technology gets in the way of teaching, does the same happen for users?

I don’t know of any user studies where users are presented with an interface and a list of questions to answer or tasks to perform, in connection with a particular topic maps interface?

Has anyone done such studies?

It would be really good to have a public archive of videos of such sessions (with permission of the participants).

****
PS: For topic map presentations/workshops, it would be good to record comments so tests of the presentation/workshop could be done in advance.

I have done presentations where the slides were perfectly clear to me when I wrote them. At presentation time I had to temporize to remember what I was trying to say. You can imagine the difficulty the audience was having. 😉

February 8, 2011

Topic Mapping BoingBoing Data?

Filed under: Dataset,Examples,Marketing — Patrick Durusau @ 6:15 am

A recent entry on Simon Willison’s blog, How we made an API for BoingBoing in an evening caught my eye.

It was based on the release of eleven years worth of post from BoingBoing, which you can download at: Eleven years’ worth of Boing Boing posts in one file!

Curious what subjects you would choose first for creating a topic map of this data set?

And having chosen them, how would you manage their identity to make it easier on yourself to incorporate other blog content?

I am mindful of Robert Barta’s approach of no data before its time for incorporation into a topic map.

Would that make a difference in your design of the topic map or only in the infrastructure that supports it?

Try Redis – Try Topic Maps?

Filed under: Examples,Marketing,NoSQL,Redis — Patrick Durusau @ 5:36 am

Try Redis is a clever introduction to Redis.

I recommend it to you as an introduction to Redis and NoSQL in general.

It also makes me wonder if it would be possible to create a similar resource for topic maps?

Granting that it would have to make prior choices about subject matter, data sets, etc. but still, it could be an effective marketing tool for topic maps.

I suspect so even if the range of choices to be made to effect merging were limited.

If I were a left-wing one political blogger in the US I would create a topic map that includes donations to Republican PACs and white collar crime convictions by family members.

Or for the right-wing, a mapping between the provisions of ObamaCare and various specific groups and agencies.

Such that users could choose additional information and it shows up in some visually pleasing way to make the case that the user already thinks is true.

Will have to give this some thought in terms of a framework with a smallish number of framework topics and the ability to quickly add in additional topics for a particular demonstration.

Such that it would be possible to quickly create a topic map demo for some breaking news story.

Could provide useful additional content but the main purpose being a demonstration of the technology.

Useful content is fairly rare so no need to tax a topic map demo with always providing useful content. Sometimes, content is simply content. 😉

Digital Diplomatics 2011 – Conference

Filed under: Conferences,Examples,Marketing,Topic Maps — Patrick Durusau @ 4:41 am

Digital Diplomatics 2011: Tools for the Digital Diplomatist

From the website:

Scholars of diplomatics never had a fundamental opposition on using modern technology to support their research. Nevertheless no technology since the introduction of photography had such an impact on questions and methods of diplomatics as the computer had: Digital imaging gives us cheap reproductions at high quality, so nowadays large copora of documents are to be found online. Digital imaging allows manipulations to make apparently invisible traces visible. Modern information technology gives us access to huge text corpora in which single words and phrases can be found thus helping to indicate relationships, to retrieve parallel texts for comparison or plot geographical and temporal distributions.

The conference aims at presenting projects which working to enlarge the digitised charter corpus on the one hand and on the other hand will put a particular focus on research applying information technology on medieval and early modern charters aiming at pure diplomatic questions as well as historic or philologic research.

An excellent opportunity for topic maps to illustrate how all the fruits of modern and ancient commentary can be brought to bear, using a text (or at least the idea of a text) as the focal or binding point for information.

Biblical scholarship, for example, becomes less sweat of the brow in terms of travel/access and more a question of seeking answers to interesting questions.

Proposals due: May 15, 2011

Conference: Naples, 29th September – 1st October 2011

February 7, 2011

Haskell – Typeclassopedia

Filed under: Computer Science,Examples — Patrick Durusau @ 7:01 am

Typeclassopedia appears in The Monad.Reader Issue 13

I was looking for Calculating Monads with Category Theory by Derek Elkins (in this issue of the Monad.Reader) when I ran across The Typeclassopedia by Brent Yorgey.

From the abstract:

The standard Haskell libraries feature a number of type classes with algebraic or category-theoretic underpinnings. Becoming a fluent Haskell hacker requires intimate familiarity with them all, yet acquiring this familiarity often involves combing through a mountain of tutorials, blog posts, mailing list archives, and IRC logs.

The goal of this article is to serve as a starting point for the student of Haskell wishing to gain a firm grasp of its standard type classes. The essentials of each type class are introduced, with examples, commentary, and extensive references for further reading.

Doesn’t combing through a mountain of tutorials, blog posts, mailing list archives, and IRC logs just cry topic map?

Will be using this article as a jumping of point for exploring a topic map interface for authoring a topic map about Haskell as well as what would an interface for a topic map about Haskell look like?

Quite serious about this being an exploration because I don’t think there is a one size fits all authoring or using/viewing interface.

Your thoughts, suggestions, comments, etc. are most welcome.

First step: I am going to start mapping out this article and not worry about other sources of information. Want to start from a known source and then incorporate other sources.

February 6, 2011

Redis Command Page – Topic Map Improvements?

Filed under: Examples,Redis — Patrick Durusau @ 6:38 am

Via Alex Popescu Redis: One Page Command References, an alternative to the Redis command page with Redis One Page command listing.

Take a look at both and then come back to this post.

Do you notice anything odd about the command information from Redis? Redis command page

While I appreciate the Time complexity information, that seems like a mis-nomer for most of the information present. The content is mostly an explanation of the command.

One reason I mention it is that I am thinking a topic map of the commands could certainly treat time complexity as a subject and therefore present all commands of a given time complexity. That could be useful in terms of planning a series of commands.

Another subject would be the examples. How many of them are shared and by which commands?

Will have to push it back and forth this week to see what develops.

Interface suggestions? Occurs to me that the traditional Unix man page layout, albeit with enhanced information, such as “example -> occurs in -> here be all the commands where it occurs” could be text/hyperlink bound might be a useful one.

Just enough addition to a traditional interface to make the additional information from a topic map available.

(The traditional topic map interface qualifies for the “an ill-favoured thing sir, but mine own” comment. I think we can and should do better.)

February 4, 2011

TopicView

Filed under: Conferences,Examples,Marketing,Topic Maps — Patrick Durusau @ 3:04 pm

TopicView

TopicView is a project by Morpheus on behalf of the Amsterdam police to bridge the practical and semantic boundaries between their information systems.

That is to say it is a solution that allows existing systems to remain in place, but creating bridges between them to enable the police to make more effective use of the information they do have and to share information across systems.

Do be aware that I used Google’s translate feature to read the homepage of this project so some of my appreciation of it is based on surmises based on my knowledge of topic maps.

I did stumble in some places, such as where the translation reports: Bandages stay hidden for Verbanden blijven verborgen.*

Perhaps fuller information will appear in the future.
*****
*I suspect way off base but since it is a police topic map, I would assume that sources of information can remain hidden, even as the information they provide is shown.

January 31, 2011

Who Identified Roger Magoulas?

Filed under: Examples,Sets,Topic Maps — Patrick Durusau @ 7:26 am

Did you know that Roger Magoulas appears 28 times on the O’Reilly website? (as of 01-29-2010)

With the following 5 hyperlink texts:

Can you name the year that Tim O’Reilly used a hyperlink for Roger Magoulas three times but hasn’t since then?

One consistent resolution for Roger Magoulas, reflecting updates and presented without hand-authoring HTML would be nice.

But, that’s just me.

What do you think?

OpenData + R + Google = Easy Maps
(& Lessons for Topic Maps)

Filed under: Examples,Mapping,R — Patrick Durusau @ 7:15 am

OpenData + R + Google = Easy Maps from James Chesire (via R-Bloggers is a compelling illustration of the use of R for mapping.

It also illustrates a couple of principles that are important for topic map authors to keep in mind:

1) An incomplete [topic] map is better than no [topic] map at all.

Chesire could have waited until he had all the data from every agency studying the issue of child labor and reconciling that data with field surveys, plus published reports from news organizations, etc., but then we would not have this article would we?

We also would not have a useful mapping of the data we have on hand.

I mention this one first because it is one that afflicts me the most.

I work on example topic maps but because they aren’t complete I am reluctant to see them as being in publishable shape.

The principle from software coding, release early and often, should be the operative principle for topic map authoring.

2) There is no true view of the data that should be honored.

Many governments of countries on this map would dispute the accuracy of the data. And your point would be?

Every map tells a story from a point of view.

There isn’t any reason for your topic map to await approval of any particular group or organization included in it.

A world of data awaits us as topic mappers.

The only question is whether we are going to step up to take advantage of it?

*****
PS: My position on incomplete topic maps is not inconsistent with my view on PR driven SQL data dumps that are topic maps in name only. As they say, you can put lipstick on a pig, ….

January 28, 2011

Why Command Helpers Suck – Post

Filed under: Database,Examples,Mapping — Patrick Durusau @ 6:53 am

Why Command Helpers Suck is an amusing rant by Kristina Chodorow (author of MongdoDB: The Definitive Guide) on the different command helpers for the same underlying database commands.

Shades of XWindows documentation and the origins of topic maps. Same commands, different terminology.

If as Robert Cerny has suggested topic maps don’t offer something new then I think it is fair to observe that the problems topic maps work to solve aren’t new either. 😉

A bit more seriously, topic maps could offer Kristina a partial solution.

Imagine a utility for command helpers that is actively maintained and that has a mapping between all the known command helpers and a given database command.

Just enter the command you know and the appropriate command is sent to the database.

That is the sort of helper application that could easily find a niche.

The master mapping could be maintained with full identifications, notes, etc. but there needs to be a compiled version for speed of response.

January 27, 2011

Mapping Domains to Domainers

Filed under: Examples,Marketing,Topic Maps — Patrick Durusau @ 6:28 am

Epik Has Epic Semantic Web Plans For Its Domains and Domainers

Unfortunate article about how people who park domains to extort money from others can use semantic technologies to supply content to their sites.

I was thinking last night of a much different use of semantic technologies with regard to domainers.

Wouldn’t it be interesting to have a topic map that traces all the parked and frivolous domains?

That is creates topics to represent the same so Google and other search services can simply exclude those sites from search results?

There’s one useful result right there.

Another useful result would be to associate the individuals who work for or own such companies with those companies.

They are certainly free to generate domain names and snap them up by the thousands, while junking up search results for all the rest of us.

But, then we are also free to choose who we will associate with.

Topic maps can help us bring honor and shame to the WWW. Has worked for centuries, no reason it should not work now.

*****
PS: Maybe we could have contests, Find that Domainer, how many minutes, seconds will it take you to identify a domainer from a domain name? Or to locate their photo? Or place of business/residence on Google maps?

January 26, 2011

Palestine Papers

Filed under: Authoring Topic Maps,Examples,Topic Maps — Patrick Durusau @ 1:24 pm

Palestine Papers

Quite helpfully, Aljazeera has published a glossary for the Palestine Papers.

The Palestine Papers were intended as internal notes, and so they make heavy use of jargon, acronyms and abbreviations. We’ve compiled a list of the most frequently-used terms.

Acronym Definition
AMA Agreement on Movement and Access
API Arab Peace Initiative
BATNA Best alternative to a negotiated agreement
CBM Confidence-building measure
CEC Central Elections Committee
GOI Government of Israel
KSCP Kerem Shalom crossing point
LO Liaison office
MB Muslim Brotherhood
MF Multi-national force
MFA Israeli ministry of foreign affairs
NAD Negotiations affairs department
NSU Negotiation support unit
NUG National unity government
PA Palestinian Authority
PG Presidential Guard
PLC Palestinian Leadership Council
PS Permanent status
PSN Permanent status negotiations
RCP Rafah crossing point
RM Road Map
SPB State with provisional borders
SSR Security sector reform
SWG Security working group
TOR Terms of reference
WG Working group

People

Different documents use different abbreviations for key negotiators: Tzipi Livni, for example, is referred to as both TL and TZ. This list covers the most commonly-used abbreviations.

Acronym Person
AA Abu Ala’ (Ahmed Qureia)
AB Azem Bishara
AG Amos Gilad
AM Abu Mazen (Mahmoud Abbas)
ARY Gen. Abdel Razzaq Yahia
BM Ban Ki-moon
BO Barack Obama
CR Condoleezza Rice
DW David Welch
ES Ephraim Sneh
GS Gilad Shed
JS Javier Solana
KD Gen. Keith Gayton
KE Khaled el-Gindy
MD Mohammad Dahlan
MO Marc Otte
PP Lt. Gen. Pietro Pistolese
PR Col. Paul Rupp
PS Pablo Serrano
RD Rami Dajani
RN Gen. Raji Najami
SA Samih al-Abed
SE Saeb Erekat
SF Salam Fayyad
ST Shalom Tourgeman
TB Tal Becker
TL Tzipi Livni
UD Udi Dekel
YAR Yasser Abed Rabbo
YG Yossi Gal

I say helpfully but a printed glossary isn’t as helpful as it could be.

For example, what if instead of a static glossary, additional information could be added for each person or organization?

That was mappable to either additional public or private data.

Watch this space for first steps on making the glossary more than just a glossary.

Afghan War Diary – 2004 – Maiana – Puzzlers

Filed under: Authoring Topic Maps,Examples,Topic Maps — Patrick Durusau @ 10:35 am

I was looking at the Afghan War Diary – 2004 at Maiana yesterday.

A couple of things puzzled me so I though I would mention them here.

Take a short look at the ontology for the diary.

I’ wait.

OK, now follow the link for Index of Individuals.

Wait! Err, there wasn’t any category that I saw in the ontology for individuals.

Did you see one?

BTW, scroll down, way down, the listing of individuals. I am assuming that cities and diary entries are both individuals?

I suppose but it looks like an odd modeling choice.

When I think of individuals I think of, you know, people.

I haven’t looked closely but do the reports include the name of persons? That is what I would consider an individual.

Ah, you know what? Individuals = Topics. Someone renamed it.

But how useful is that?

Having every subject represented by a topic in a single index?

That is as unhelpful as a Google search result.

Particularly if your topic map is of any size.

Have indexes of commonly looked for things like geographic locations by name or organizations, etc.

BTW, I don’t think that USMC is of type Host Nation.

If USMC expands to United States Marine Corps then I suspect a type of military organization is probably more accurate.

I stopped looking at this point.

Please forward suggestions/corrections to the project.

I’m just a bill…

Filed under: Examples,Marketing,Topic Maps — Patrick Durusau @ 5:20 am

Remember the Schoolhouse Rock song about how a bill becomes a law in the US?

If you don’t, see: Schoolhouse Rock- How a Bill Becomes a Law.

That level of understanding the legislative process is found in: Stream Congress: A real-time data stream for Congress

From the website:

Once Congress gets back to work, Stream Congress will serve as a good example of what the Real Time Congress API provides: floor updates, bill status, floor votes, committee hearing notices, and much more.

Don’t get me wrong, I like Sunlight Labs.

They have the potential to alter the political landscape.

But not with this understanding of how laws are made in the US.

Members of Congress write bills? Really? You really think that?

Have you ever met a member of Congress? Either house?

Let’s start by naming when a bill is proposed, the staffers, lobbyists, administration representatives, who wrote the bill.

The actual bill authors.

They have goals, friends, etc., that are being furthered by the bills they write (which are passed unread by most members of Congress).

Include who is paying the actual bill authors as well and their sources of funding.

Run that backwards into other legislative sessions. So we can follow patterns of money and ideology that shapes legislation before it ever gets proposed.

Then match up people interested in the bill with financial contributions to members of Congress. And the financial or other interest they have in the bill’s outcome.

We have the capacity to name names and make government truly transparent.

But only if we shine light on the actual process.

Topic maps can help with that.

*****
PS: Transparency would require far more than these off-hand suggestions and would not be cheap. Inquiries welcome.

January 25, 2011

Topic Maps – Human-oriented Semantics? – Slides

Filed under: Examples,TMDM,Topic Maps — Patrick Durusau @ 5:55 am

Topic Maps – Human-oriented Semantics? – Slides

The slides from Lars Marius Garshol’s topic map presentation tomorrow in Sogndal are now online.

Recommended for use with civilians. (Currently non-topic map advocates.)

See The Tin Man for my take away from the presentation.

January 24, 2011

Gprof2Dot

Filed under: Authoring Topic Maps,Examples,Graphs — Patrick Durusau @ 5:34 pm

Gprof2Dot

Convert profiling output to a dot graph.

This is very cool.

The resulting graph would make an excellent interface into further documentation or analysis powered by a topic map.

Such as other implementations of the same routine? (or improvements thereof?)

Sounds like same subject talk to me.

January 21, 2011

Hey Jude Flowchart – Post – Topic Map Challenge

Filed under: Examples,Exercises,Topic Maps — Patrick Durusau @ 11:38 am

Hey Jude Flowchart from Flowingdata.com.

An amusing visualization of a popular song from my youth.

As well as an opportunity for a topic map challenge!

Create a topic map of Hey Jude, using this flowchart as your starting point.

You can include other subjects but points are awarded for subjects derived from the lyrics as represented in this flowchart.

Feel free to suggest more contemporary songs if you like, but be prepared to lead the effort topic map them!

January 15, 2011

Regret The Error

Filed under: Authoring Topic Maps,Examples — Patrick Durusau @ 7:18 am

Regret the Error is both a website and book by Craig Silvermar.

From the website:

Regret the Error reports on media corrections, retractions, apologies, clarifications and trends regarding accuracy and honesty in the press. It was launched in October 2004 by Craig Silverman, a freelance journalist and author based in Montreal.

Silvermar’s free accuracy checklist is one that reporters (dare I say bloggers?) would do well to follow.

Silvermar recommends printing and laminating the checklist so you can use it with a dry erase pen to check items off.

Better than not having a checklist at all but that seems suboptimal to me.

For example, in a news operation with multiple reporters:

  • How would an editor discover that multiple reporters were relying on the same sources?
  • Or the same sources across multiple stories?
  • How would reporters avoid having to duplicate the effort of other reporters in verifying basic facts such as names, titles, urls, etc?
  • How would reporters build on the experts, resources, sources already located by other reporters?

Questions:

How would you:

  1. Convert Silvermar’s checklist into a topic map?
  2. How would you associate a particular set of items with a story and their being checked off by a reporter?
  3. What extensions or specifics would you add to the checklist?
  4. What other mechanisms would you want in place for such a topic map? (Anonymity for sources comes to mind.)

January 13, 2011

Infosomics

Filed under: Examples,Marketing,Topic Maps — Patrick Durusau @ 7:21 pm

Reading The Newsonomics of 2011 news metrics to watch I was reminded that topic maps lack a notion of infosomics.

That is a metric, any metric, to measure the benefit that a user derives from the use of a topic map.

I have heard lots of anecdotal stories but no hard numbers.

Consider the listing of search engines you will find at: Choose the Best Search for Your Information Need.

A useful listing and no doubt similar advice exists for search appliances, but none of which results in any hard numbers.

For example, say I am responsible for tech support for a particular software package. There is a collection of prior tech support requests with answers, manuals and other materials. Not to mention tech support staff who have general support training and training on this product in particular.

What I want to know is what measurable metrics, reduced length of support calls, lack of repeated calls from the same customer (same issue), higher customer satisfaction, I can expect from using a topic map?

The same sort of metrics that I haven’t seen (overlooked?) for any of the search appliances.

The best case scenario would be to have a vendor with multiple help desk operations that were basically equivalent and to set up one office with a topic map solution and the other office uses its current solution. Use automated monitoring to derive the metrics.

I prefer that sort of metric to “…someday we will all be one giant linked graph/topic map/insert your solution” type claims.

The latter being hard to evaluate in any meaningful way.

Visualize This: Where the public gets its news – Post

Filed under: Examples,Topic Maps,Visualization — Patrick Durusau @ 5:29 pm

Visualize This: Where the public gets its news

Flowing Data posted a rather poor graph of a survey on where people get their national and international news.

The data was also posted so readers could create their own visualizations.

I rather like the idea of the challenge to improve the work posted.

I wonder what it would take for that to work for topic maps?

That is how could data be presented so that it would not be too burdensome to create different topic map representations of the data?

Thinking such an exercise could serve both as a demonstration of the diversity of interests in the topic maps community as well as an example of merging the resulting topic maps together.

To make the parts into a whole.

Suggestions?

Older Posts »

Powered by WordPress