Another Word For It Patrick Durusau on Topic Maps and Semantic Diversity

March 6, 2015

Linear SVM Classifier on Twitter User Recognition

Filed under: Classification,Machine Learning,Python,Support Vector Machines — Patrick Durusau @ 6:52 pm

Linear SVM Classifier on Twitter User Recognition by Leon van Bokhorst.

From the post:

Support Vector Machines (SVM) are very useful and popular in data classification, regression and outlier detection. This advanced supervised machine learning algorithm can quickly become very complex and hard to understand, but can lead to great results. In the example we train a linear SVM to detect and predict who’s the writer of a tweet.

Nice weekend type project, Python, iPython notebook, 400 tweets (I think Leon is right, the sample is too small), but an opportunity to “arm up the switches and dial in the mils.”

Enjoy!

While you are there, you should look around Leon’s blog. A number of interesting posts on statistics using Python.

March 3, 2015

Reddit Terminal Viewer

Filed under: Python — Patrick Durusau @ 4:42 pm

Reddit Terminal Viewer by Michael Lazar.

From the webpage:

Reddit Terminal Viewer (RTV) is a lightweight browser for Reddit (www.reddit.com) built into a terminal window. RTV is built in Python and utilizes the curses library. It is compatible with a large range of terminal emulators on Linux and OSX systems.

Sometimes, text is all you need for fast browsing/searching.

The more graphical the Web becomes the more useful text interfaces become. Is text the answer to graphic spam?

I first saw this in a tweet by Randy Olson.

March 1, 2015

Let Me Get That Data For You (LMGTDFY)

Filed under: Bing,Open Data,Python — Patrick Durusau @ 8:22 pm

Let Me Get That Data For You (LMGTDFY) by U.S. Open Data.

From the post:

LMGTDFY is a web-based utility to catalog all open data file formats found on a given domain name. It finds CSV, XML, JSON, XLS, XLSX, XML, and Shapefiles, and makes the resulting inventory available for download as a CSV file. It does this using Bing’s API.

This is intended for people who need to inventory all data files on a given domain name—these are generally employees of state and municipal government, who are creating an open data repository, and performing the initial step of figuring out what data is already being emitted by their government.

LMGTDFY powers U.S. Open Data’s LMGTDFY site, but anybody can install the software and use it to create their own inventory. You might want to do this if you have more than 300 data files on your site. U.S. Open Data’s LMGTDFY site caps the number of results at 300, in order to avoid winding up with an untenably large invoice for using Bing’s API. (Microsoft allows 5,000 searches/month for free.)

Now there’s a useful utility!

Enjoy!

I first saw this in a tweet by Pycoders Weekly.

February 24, 2015

TextBlob: Simplified Text Processing

Filed under: Natural Language Processing,Python,Text Analytics — Patrick Durusau @ 2:51 pm

TextBlob: Simplified Text Processing

From the webpage:

TextBlob is a Python (2 and 3) library for processing textual data. It provides a simple API for diving into common natural language processing (NLP) tasks such as part-of-speech tagging, noun phrase extraction, sentiment analysis, classification, translation, and more.

TextBlob stands on the giant shoulders of NLTK and pattern, and plays nicely with both.

Features

  • Noun phrase extraction
  • Part-of-speech tagging
  • Sentiment analysis
  • Classification (Naive Bayes, Decision Tree)
  • Language translation and detection powered by Google Translate
  • Tokenization (splitting text into words and sentences)
  • Word and phrase frequencies
  • Parsing
  • n-grams
  • Word inflection (pluralization and singularization) and lemmatization
  • Spelling correction
  • Add new models or languages through extensions
  • WordNet integration

Has anyone compared this head to head with NLTK?

February 15, 2015

50 Shades Sex Scene detector

Filed under: Natural Language Processing,Python — Patrick Durusau @ 4:55 pm

NLP-in-Python by Lynn Cherny.

No, the title is not “click-bait” because section 4 of Lynn’s tutorial is titled:

4. Naive Bayes Classification – the infamous 50 Shades Sex Scene Detection because spam is boring

Titles can be accurate and NLP can be interesting.

Imagine an ebook reader that accepts 3rd party navigation for ebooks. Running NLP on novels could provide navigation that isolates the sex or other scenes for rapid access.

An electronic abridging of the original. Not unlike CliffsNotes.

I suspect that could be a marketable information product separate from the original ebook.

As would the ability to overlay 3rd party content on original ebook publications.

Are any of the open source ebook readers working on such a feature? Easier to develop demand for that feature on open source ebook readers and then tackle the DRM/proprietary format stuff.

February 7, 2015

Pick up Python

Filed under: Communities of Practice,Programming,Python,R — Patrick Durusau @ 2:45 pm

Pick up Python by Jeffrey M. Perkel. (Nature 518, 125–126 (05 February 2015) doi:10.1038/518125a)

From the post:

Last month, Adina Howe took up a post at Iowa State University in Ames. Officially, she is an assistant professor of agricultural and biosystems engineering. But she works not in the greenhouse, but in front of a keyboard. Howe is a programmer, and a key part of her job is as a ‘data professor’ — developing curricula to teach the next generation of graduates about the mechanics and importance of scientific programming.

Howe does not have a degree in computer science, nor does she have years of formal training. She had a PhD in environmental engineering and expertise in running enzyme assays when she joined the laboratory of Titus Brown at Michigan State University in East Lansing. Brown specializes in bioinformatics and uses computation to extract meaning from genomic data sets, and Howe had to get up to speed on the computational side. Brown’s recommendation: learn Python.

Among the host of computer-programming languages that scientists might choose to pick up, Python, first released in 1991 by Dutch programmer Guido van Rossum, is an increasingly popular (and free) recommendation. It combines simple syntax, abundant online resources and a rich ecosystem of scientifically focused toolkits with a heavy emphasis on community.

The community aspect is particularly important to Python’s growing adoption. Programming languages are popular only if new people are learning them and using them in diverse contexts, says Jessica McKellar, a software-engineering manager at the file-storage service Dropbox and a director of the Python Software Foundation, the non-profit organization that promotes and advances the language. That kind of use sets up a “virtuous cycle”, McKellar says: new users extend the language into new areas, which in turn attracts still more users.

Curious what topic mappers make of the description of the community aspects of Python?

I ask because more sematically opaque Big Data comes online everyday and there have been rumblings about needing a solution. A solution that I think topic maps are well suited to provide.

BTW, R folks should not feel slighted: Adventures with R by Sylvia Tippmann. (Nature 517, 109–110 (01 January 2015) doi:10.1038/517109a)

February 4, 2015

Creating Excel files with Python and XlsxWriter

Filed under: Excel,Microsoft,Python,Spreadsheets — Patrick Durusau @ 4:53 pm

Creating Excel files with Python and XlsxWriter

From the post:

XlsxWriter is a Python module for creating Excel XLSX files.

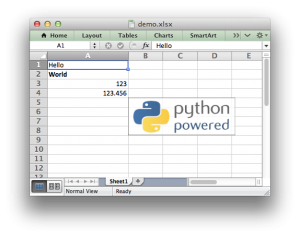
demo-xlsxwriter

(Sample code to create the above spreadsheet.)

XlsxWriter

XlsxWriter is a Python module that can be used to write text, numbers, formulas and hyperlinks to multiple worksheets in an Excel 2007+ XLSX file. It supports features such as formatting and many more, including:

  • 100% compatible Excel XLSX files.
  • Full formatting.
  • Merged cells.
  • Defined names.
  • Charts.
  • Autofilters.
  • Data validation and drop down lists.
  • Conditional formatting.
  • Worksheet PNG/JPEG images.
  • Rich multi-format strings.
  • Cell comments.
  • Memory optimisation mode for writing large files.

I know what you are thinking. If you are processing the data with Python, why the hell would you want to write data to XSL or XLSX?

Good question! But it also has an equally good answer.

Attend a workshop for mid-level managers and introduce one of the speakers saying:

We are going to give away copies of the data used in this presentation. By show of hands, how many people want it in R format? Now, how many people want it in Excel format?

Or you can reverse the questions so the glazed look from the audience on the R question doesn’t blind you. 😉

If your data need to transition to management, at least most management, spreadsheet formats are your friend.

If you don’t believe me, see any number of remarkable presentation by Felienne Hermans on the use of spreadsheets or check out my spreadsheets category.

Don’t get me wrong, I prefer being closer to the metal but on the other hand, delivering data that users can use is more profitable than the alternatives.

I first saw this in a tweet by Scientific Python.

February 2, 2015

Configuring IPython Notebook Support for PySpark

Filed under: Python,Spark — Patrick Durusau @ 4:50 pm

Configuring IPython Notebook Support for PySpark by John Ramey.

From the post:

Apache Spark is a great way for performing large-scale data processing. Lately, I have begun working with PySpark, a way of interfacing with Spark through Python. After a discussion with a coworker, we were curious whether PySpark could run from within an IPython Notebook. It turns out that this is fairly straightforward by setting up an IPython profile.

A quick setup note for a useful configuration of PySpark, IPython Notebook.

Good example of it being unnecessary to solve every problem to make a useful contribution.

Enjoy!

January 30, 2015

So You’d Like To Make a Map Using Python

Filed under: Mapping,Maps,Python — Patrick Durusau @ 8:25 pm

So You’d Like To Make a Map Using Python by Stephan Hügel.

From the post:

Making thematic maps has traditionally been the preserve of a ‘proper’ GIS, such as ArcGIS or QGIS. While these tools make it easy to work with shapefiles, and expose a range of common everyday GIS operations, they aren’t particularly well-suited to exploratory data analysis. In short, if you need to obtain, reshape, and otherwise wrangle data before you use it to make a map, it’s easier to use a data analysis tool (such as Pandas), and couple it to a plotting library. This tutorial will be demonstrating the use of:

  • Pandas
  • Matplotlib
  • The matplotlib Basemap toolkit, for plotting 2D data on maps
  • Fiona, a Python interface to OGR
  • Shapely, for analyzing and manipulating planar geometric objects
  • Descartes, which turns said geometric objects into matplotlib “patches”
  • PySAL, a spatial analysis library

The approach I’m using here uses an interactive REPL (IPython Notebook) for data exploration and analysis, and the Descartes package to render individual polygons (in this case, wards in London) as matplotlib patches, before adding them to a matplotlib axes instance. I should stress that many of the plotting operations could be more quickly accomplished, but my aim here is to demonstrate how to precisely control certain operations, in order to achieve e.g. the precise line width, colour, alpha value or label position you want.

I didn’t catch this when it was originally published (2013) so you will probably have to update some of the specific package versions.

Still, this looks like an incredibly useful exercise.

Not just for learning Python and map creation but deeper knowledge about particular cities as well. On a good day I can find my way around the older parts of Rome from the Trevi Fountain but my knowledge fades pretty rapidly.

Creating a map using Python could help flesh out your knowledge of cities that are otherwise just names on the news. Isn’t that one of those quadruple learning environments? Geography + Cartography + Programming + Demographics? That’s how I would pitch it in any event.

I first saw this in a tweet by YHat, Inc.

Data Science in Python

Filed under: Data Science,Python — Patrick Durusau @ 8:04 pm

Data Science in Python by Greg.

From the webpage:

Last September we gave a tutorial on Data Science with Python at DataGotham right here in NYC. The conference was great and I highly suggest it! The “data prom” event the night before the main conference was particularly fun!

… (image omitted)

We’ve published the entire tutorial as a collection of IPython Notebooks. You can find the entire presentation on github or checkout the links to nbviewer below.

…(image omitted)

Table of Contents

A nice surprise for the weekend!

Curious, out of the government data that is online, local, state, federal, what data would you like most to see for holding government accountable?

Data science is a lot of fun in and of itself but results that afflict the comfortable are amusing as well.

I first saw this in a tweet by YHat, Inc.

January 25, 2015

A practical introduction to functional programming

Filed under: Functional Programming,Python — Patrick Durusau @ 5:12 pm

A practical introduction to functional programming by Mary Rose Cook.

From the post:

Many functional programming articles teach abstract functional techniques. That is, composition, pipelining, higher order functions. This one is different. It shows examples of imperative, unfunctional code that people write every day and translates these examples to a functional style.

The first section of the article takes short, data transforming loops and translates them into functional maps and reduces. The second section takes longer loops, breaks them up into units and makes each unit functional. The third section takes a loop that is a long series of successive data transformations and decomposes it into a functional pipeline.

The examples are in Python, because many people find Python easy to read. A number of the examples eschew pythonicity in order to demonstrate functional techniques common to many languages: map, reduce, pipeline.

After spending most of the day with poor documentation, this sort of post is a real delight. It took more effort than the stuff I was reading today but it saves every reader time, rather than making them lose time.

Perhaps I should create an icon to mark documentation that will cost you more time than searching a discussion list for the answer.

Yes?

I first saw this in a tweet by Gianluca Fiore.

January 20, 2015

Flask and Neo4j

Filed under: Blogs,Graphs,Neo4j,Python — Patrick Durusau @ 5:03 pm

Flask and Neo4j – An example blogging application powered by Flask and Neo4j. by Nicole White.

From the post:

I recommend that you read through Flask’s quickstart guide before reading this tutorial. The following is drawn from Flask’s tutorial on building a microblog application. This tutorial expands the microblog example to include social features, such as tagging posts and recommending similar users, by using Neo4j instead of SQLite as the backend database.
(14 parts follow here)

The fourteen parts take you all the way through deployment on Heroku.

I don’t think you will abandon your current blogging platform but you will gain insight into Neo4j and Flask. A non-trivial outcome.

January 14, 2015

Data Analysis with Python, Pandas, and Bokeh

Filed under: Python,Visualization — Patrick Durusau @ 7:32 pm

Data Analysis with Python, Pandas, and Bokeh by Chris Metcalf.

From the post:

A number of questions have come up recently about how to use the Socrata API with Python, an awesome programming language frequently used for data analysis. It also is the language of choice for a couple of libraries I’ve been meaning to check out – Pandas and Bokeh.

No, not the endangered species that has bamboo-munched its way into our hearts and the Japanese lens blur that makes portraits so beautiful, the Python Data Analysis Library and the Bokeh visualization tool. Together, they represent an powerful set of tools that make it easy to retrieve, analyze, and visualize open data.

If you have ever wondered what days have the most “party” disturbance calls to the LA police department, your years of wondering are about to end. 😉

Seriously, just in this short post Chris makes a case for learning more about Python Data Analysis Library and the Bokeh visualization tool.

Becoming skilled with either package will take time but there is a nearly endless stream of data to practice upon.

I first saw this in a tweet by Christophe Lalanne.

Manipulate PDFs with Python

Filed under: Ferguson,PDF,Python — Patrick Durusau @ 5:16 pm

Manipulate PDFs with Python by Tim Arnold.

From the overview:

PDF documents are beautiful things, but that beauty is often only skin deep. Inside, they might have any number of structures that are difficult to understand and exasperating to get at. The PDF reference specification (ISO 32000-1) provides rules, but it is programmers who follow them, and they, like all programmers, are a creative bunch.

That means that in the end, a beautiful PDF document is really meant to be read and its internals are not to be messed with. Well, we are programmers too, and we are a creative bunch, so we will see how we can get at those internals.

Still, the best advice if you have to extract or add information to a PDF is: don’t do it. Well, don’t do it if there is any way you can get access to the information further upstream. If you want to scrape that spreadsheet data in a PDF, see if you can get access to it before it became part of the PDF. Chances are, now that is is inside the PDF, it is just a bunch of lines and numbers with no connection to its former structure of cells, formats, and headings.

If you cannot get access to the information further upstream, this tutorial will show you some of the ways you can get inside the PDF using Python. (emphasis in the original)

Definitely a collect the software and experiment type post!

Is there a collection of “nasty” PDFs on the web? Thinking that would be a useful think to have for testing tools such as the ones listed in this post. Not to mention getting experience with extracting information from them. Suggestions?

I first saw this in a tweet by Christophe Lalanne.

January 8, 2015

Wikipedia in Python, Gephi, and Neo4j

Filed under: Gephi,Giraph,Neo4j,NetworkX,Python,Wikipedia — Patrick Durusau @ 3:22 pm

Wikipedia in Python, Gephi, and Neo4j: Vizualizing relationships in Wikipedia by Matt Krzus.

From the introduction:

g3

We have had a bit of a stretch here where we used Wikipedia for a good number of things. From Doc2Vec to experimenting with word2vec layers in deep RNNs, here are a few of those cool visualization tools we’ve used along the way.

Cool things you will find in this post:

  • Building relationship links between Categories and Subcategories
  • Visualization with Networkx (think Betweenness Centrality and PageRank)
  • Neo4j and Cypher (the author thinks avoiding the Giraph learning curve is a plus, I leave that for you to decide)
  • Visualization with Gephi

Enjoy!

January 4, 2015

AdversariaLib

Filed under: Algorithms,Machine Learning,Python — Patrick Durusau @ 5:35 pm

AdversariaLib

Speaking of combat machine learning environments:

AdversariaLib is an open-source python library for the security evaluation of machine learning (ML)-based classifiers under adversarial attacks. It comes with a set of powerful features:

  • Easy-to-use. Running sophisticated experiments is as easy as launching a single script. Experimental settings can be defined through a single setup file.
  • Wide range of supported ML algorithms. All supervised learning algorithms supported by scikit-learn are available, as well as Neural Networks (NNs), by means of our scikit-learn wrapper for FANN. In the current implementation, the library allows for the security evaluation of SVMs with linear, rbf, and polynomial kernels, and NNs with one hidden layer, against evasion attacks.
  • Fast Learning and Evaluation. Thanks to scikit-learn and FANN, all supported ML algorithms are optimized and written in C/C++ language.
  • Built-in attack algorithms. Evasion attacks based on gradient-descent optimization.
  • Extensible. Other attack algorithms can be easily added to the library.
  • Multi-processing. Do you want to further save time? The built-in attack algorithms can run concurrently on multiple processors.

Last, but not least, AdversariaLib is free software, released under the GNU General Public License version 3!

The “full documentation” link on the homepage returns a “no page.” I puzzled over it until I realized that the failing link reads:

http://comsec.diee.unica.it/adversarialib/

and the successful link reads:

https://comsec.diee.unica.it/adversarialib/advlib.html

I have pinged the site owners.

The sourceforge link for the code: http://sourceforge.net/projects/adversarialib/ still works.

The full documentation page notes:

However, learning algorithms typically assume data stationarity: that is, both the data used to train the classifier and the operational data it classifies are sampled from the same (though possibly unknown) distribution. Meanwhile, in adversarial settings such as the above mentioned ones, intelligent and adaptive adversaries may purposely manipulate data (violating stationarity) to exploit existing vulnerabilities of learning algorithms, and to impair the entire system.

Not quite the case of reactive data that changes representations depending upon the source of a query but certainly a move in that direction.

Do you have a data stability assumption?

December 20, 2014

Creating Tor Hidden Services With Python

Filed under: Python,Security,Tor — Patrick Durusau @ 8:28 pm

Creating Tor Hidden Services With Python by Jordan Wright.

From the post:

Tor is often used to protect the anonymity of someone who is trying to connect to a service. However, it is also possible to use Tor to protect the anonymity of a service provider via hidden services. These services, operating under the .onion TLD, allow publishers to anonymously create and host content viewable only by other Tor users.

The Tor project has instructions on how to create hidden services, but this can be a manual and arduous process if you want to setup multiple services. This post will show how we can use the fantastic stem Python library to automatically create and host a Tor hidden service.

If you are interested in the Tor network, this is a handy post to bookmark.

I was thinking about exploring the Tor network in the new year but you should be aware of a more recent post by Jordan:

What Happens if Tor Directory Authorities Are Seized?

From the post:

The Tor Project has announced that they have received threats about possible upcoming attempts to disable the Tor network through the seizure of Directory Authority (DA) servers. While we don’t know the legitimacy behind these threats, it’s worth looking at the role DA’s play in the Tor network, showing what effects their seizure could have on the Tor network.*

Nothing to panic about, yet, but if you know anyone you can urge to protect Tor, do so.

December 11, 2014

2014 Data Science Salary Survey [R + Python?]

Filed under: Data Science,Python,R — Patrick Durusau @ 7:27 am

2014 Data Science Salary Survey: Tools, Trends, What Pays (and What Doesn’t) for Data Professionals by John King and Roger Magoulas.

From the webpage:

For the second year, O’Reilly Media conducted an anonymous survey to expose the tools successful data analysts and engineers use, and how those tool choices might relate to their salary. We heard from over 800 respondents who work in and around the data space, and from a variety of industries across 53 countries and 41 U.S. states.

Findings from the survey include:

  • Average number of tools and median income for all respondents
  • Distribution of responses by a variety of factors, including age, location, industry, position, and cloud computing
  • Detailed analysis of tool use, including tool clusters
  • Correlation of tool usage and salary

Gain insight from these potentially career-changing findings—download this free report to learn the details, and plug your own variables into the regression model to find out where you fit into the data space.

The best take on this publication can be found in O’Reilly Data Scientist Salary and Tools Survey, November 2014 by David Smith where he notes:

The big surprise for me was the low ranking of NumPy and SciPy, two toolkits that are essential for doing statistical analysis with Python. In this survey and others, Python and R are often similarly ranked for data science applications, but this result suggests that Python is used about 90% for data science tasks other than statistical analysis and predictive analytics (my guess: mainly data munging). From these survey results, it seems that much of the “deep data science” is done by R.

My initial observation is that “more than 800 respondents” is too small of a data sample to draw any useful conclusions about tools used by data scientists. Especially when the #1 tool listed in that survey was Windows.

Why a majority of “data scientists” confuse an OS with data processing tools like SQL or Excel, both of which ranked higher than Python or R, is unknown but casts further doubt on the data sample.

My suggestion would be to have a primary tool or language (other than an OS) whether it is R or Python but to be familiar with the strengths of other approaches. Religious bigotry about approaches is a poor substitute for useful results.

December 9, 2014

Data Science with Hadoop: Predicting Airline Delays – Part 2

Filed under: Hadoop,Hortonworks,Machine Learning,Python,R,Spark — Patrick Durusau @ 5:25 pm

Using machine learning algorithms, Spark and Scala – Part 2 by Ofer Mendelevitch and Beau Plath.

From the post:

In this 2nd part of the blog post and its accompanying IPython Notebook in our series on Data Science and Apache Hadoop, we continue to demonstrate how to build a predictive model with Apache Hadoop, using existing modeling tools. And this time we’ll use Apache Spark and ML-Lib.

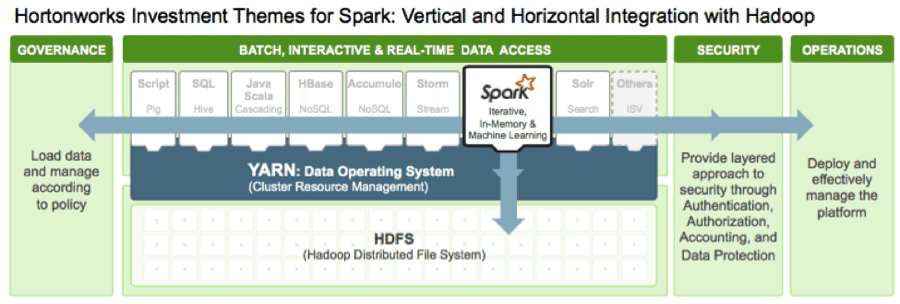
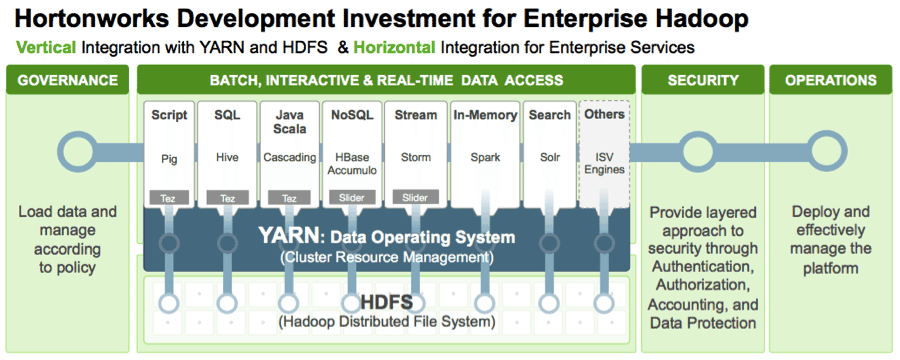
Apache Spark is a relatively new entrant to the Hadoop ecosystem. Now running natively on Apache Hadoop YARN, the architectural center of Hadoop, Apache Spark is an in-memory data processing API and execution engine that is effective for machine learning and data science use cases. And with Spark on YARN, data workers can simultaneously use Spark for data science workloads alongside other data access engines–all accessing the same shared dataset on the same cluster.

ds_2_1

The next installment in this series continues the analysis with the same dataset but then with R!

The bar for user introductions to technology is getting higher even as we speak!

Data Science with Apache Hadoop: Predicting Airline Delays (Part 1)

Filed under: Hadoop,Hortonworks,Machine Learning,Python,R,Spark — Patrick Durusau @ 5:06 pm

Using machine learning algorithms, Pig and Python – Part 1 by Ofer Mendelevitch.

From the post:

With the rapid adoption of Apache Hadoop, enterprises use machine learning as a key technology to extract tangible business value from their massive data assets. This derivation of business value is possible because Apache Hadoop YARN as the architectural center of Modern Data Architecture (MDA) allows purpose-built data engines such as Apache Tez and Apache Spark to process and iterate over multiple datasets for data science techniques within the same cluster.

ds_1

It is a common misconception that the way data scientists apply predictive learning algorithms like Linear Regression, Random Forest or Neural Networks to large datasets requires a dramatic change in approach, in tooling, or in usage of siloed clusters. Not so: no dramatic change; no dedicated clusters; using existing modeling tools will suffice.

In fact, the big change is in what is known as “feature engineering”—the process by which very large raw data is transformed into a “feature matrix.” Enabled by Apache Hadoop with YARN as an ideal platform, this transformation of large raw datasets (terabytes or petabytes) into a feature matrix is now scalable and not limited by RAM or compute power of a single node.

Since the output of the feature engineering step (the “feature matrix”) tends to be relatively small in size (typically in the MB or GB scale), a common choice is to run the learning algorithm on a single machine (often with multiple cores and high amount of RAM), allowing us to utilize a plethora of existing robust tools and algorithms from R packages, Python’s Scikit-learn, or SAS.

In this multi-part blog post and its accompanying IPython Notebook, we will demonstrate an example step-by-step solution to a supervised learning problem. We will show how to solve this problem with various tools and libraries and how they integrate with Hadoop. In part I we focus on Apache PIG, Python, and Scikit-learn, while in subsequent parts, we will explore and examine other alternatives such as R or Spark/ML-Lib

With the IPython notebook, this becomes a great example of how to provide potential users hands-on experience with a technology.

An example that Solr, for example, might well want to imitate.

PS: When I was traveling, a simpler way to predict flight delays was to just ping me for my travels plans. 😉 You?

December 6, 2014

Introduction to statistical data analysis in Python.. (ATTN: Activists)

Filed under: Python,Statistics — Patrick Durusau @ 4:34 pm

Introduction to statistical data analysis in Python – frequentist and Bayesian methods by Cyrille Rossant.

Activists: I know, it really sounds more exciting than a hit from a crack pipe. Right? 😉

Seriously, consider this in light of: Activists Wield Search Data to Challenge and Change Police Policy. To cut to the chase, statistics proved that DWB stops (driving while black) resulted in searches of black men more than twice as often as white men but produced no more weapons/drugs. City of Durham changed its traffic stop policy. (I don’t know if DWB is now legal in Durham or not.)

But the point is that raw data and statistics can have an impact on a brighter than average city council. Doesn’t work every time but another tool to have at your disposal.

From the webpage:

In Chapter 7, Statistical Data Analysis, we introduce statistical methods for data analysis. In addition to covering statistical packages such as pandas, statsmodels, and PyMC, we explain the basics of the underlying mathematical principles. Therefore, this chapter will be most profitable if you have basic experience with probability theory and calculus.

The next chapter, Chapter 8, Machine Learning, is closely related; the underlying mathematics is very similar, but the goals are slightly different. While in the present chapter, we show how to gain insight into real-world data and how to make informed decisions in the presence of uncertainty, in the next chapter the goal is to learn from data, that is, to generalize and to predict outcomes from partial observations.

I first saw the Durham story in a tweet by Tim O’Reilly. The Python book was mentioned in a tweet by Scientific Python.

November 28, 2014

Python 3 Text Processing with NLTK 3 Cookbook

Filed under: NLTK,Python — Patrick Durusau @ 7:48 pm

Python 3 Text Processing with NLTK 3 Cookbook by Jacobs Perkins.

From the post:

After many weekend writing sessions, the 2nd edition of the NLTK Cookbook, updated for NLTK 3 and Python 3, is available at Amazon and Packt. Code for the book is on github at nltk3-cookbook. Here’s some details on the changes & updates in the 2nd edition:

First off, all the code in the book is for Python 3 and NLTK 3. Most of it should work for Python 2, but not all of it. And NLTK 3 has made many backwards incompatible changes since version 2.0.4. One of the nice things about Python 3 is that it’s unicode all the way. No more issues with ASCII versus unicode strings. However, you do have to deal with byte strings in a few cases. Another interesting change is that hash randomization is on by default, which means that if you don’t set the PYTHONHASHSEED environment variable, training accuracy can change slightly on each run, because the iteration order of dictionaries is no longer consistent by default.

It’s never too late to update your wish list! 😉

Enjoy!

November 22, 2014

A modern guide to getting started with Data Science and Python

Filed under: Data Science,Python — Patrick Durusau @ 12:02 pm

A modern guide to getting started with Data Science and Python by Thomas Wiecki.

From the post:

Python has an extremely rich and healthy ecosystem of data science tools. Unfortunately, to outsiders this ecosystem can look like a jungle (cue snake joke). In this blog post I will provide a step-by-step guide to venturing into this PyData jungle.

What’s wrong with the many lists of PyData packages out there already you might ask? I think that providing too many options can easily overwhelm someone who is just getting started. So instead, I will keep a very narrow scope and focus on the 10% of tools that allow you to do 90% of the work. After you mastered these essentials you can browse the long lists of PyData packages to decide which to try next.

The upside is that the few tools I will introduce already allow you to do most things a data scientist does in his day-to-day (i.e. data i/o, data munging, and data analysis).

A great “start small” post on Python.

Very appropriate considering that over sixty percent (60%) of software skill job postings mention Python. Popular Software Skills in Data Science Job postings. If you have a good set of basic tools, you can add specialized ones later.

November 20, 2014

Python Multi-armed Bandits (and Beer!)

Filed under: Python,Recommendation — Patrick Durusau @ 3:44 pm

Python Multi-armed Bandits (and Beer!) by Eric Chiang.

From the post:

There are many ways to evaluate different strategies for solving different prediction tasks. In our last post, for example, we discussed calibration and descrimination, two measurements which assess the strength of a probabilistic prediciton. Measurements like accuracy, error, and recall among others are useful when considering whether random forest “works better” than support vector machines on a problem set. Common sense tells us that knowing which analytical strategy “does the best” is important, as it will impact the quality of our decisions downstream. The trick, therefore, is in selecting the right measurement, a task which isn’t always obvious.

There are many prediction problems where choosing the right accuracy measurement is particularly difficult. For example, what’s the best way to know whether this version of your recommendation system is better than the prior version? You could – as was the case with the Netflix Prize – try to predict the number of stars a user gave to a movie and measure your accuracy. Another (simpler) way to vet your recommender strategy would be to roll I out to users and watch before and after behaviors.

So by the end of this blog post, you (the reader) will hopefully be helping me improve our beer recommender through your clicks and interactions.

The final application which this blog will explain can be found at bandit.yhathq.com. The original post explaining beer recommenders can be found here.

I have friend who programs in Python (as well as other languages) and they are or are on their way to becoming a professional beer taster.

Given a choice, I think I would prefer to become a professional beer drinker but each to their own. 😉

The discussion of measures of distances between beers in this post is quite good. When reading it, think about beers (or other beverages) you have had and try to pick between Euclidean distance, distance correlation, and cosine similarity in discussing how you evaluate those beverages to each other.

What? That isn’t how you evaluate your choices between beverages?

Yet, those “measures” have proven to be effective (effective != 100%) at providing distances between individual choices.

The “mapping” between the unknown internal scale of users and the metric measures used in recommendation systems is derived from a population of users. The resulting scale may or may not be an exact fit for any user in the tested group.

The usefulness of any such scale depends on the similarity of the population over which it was derived and the population where you want to use it. Not to mention how you validated the answers. (Users are reported to give the “expected” response as opposed to their actual choices in some scenarios.)
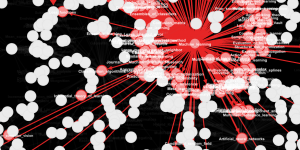
Geospatial Data in Python

Filed under: Geographic Data,Geospatial Data,Python — Patrick Durusau @ 2:31 pm

Geospatial Data in Python by Carson Farmer.

Materials for the tutorial: Geospatial Data in Python: Database, Desktop, and the Web by Carson Farmer (Associate Director of CARSI lab).

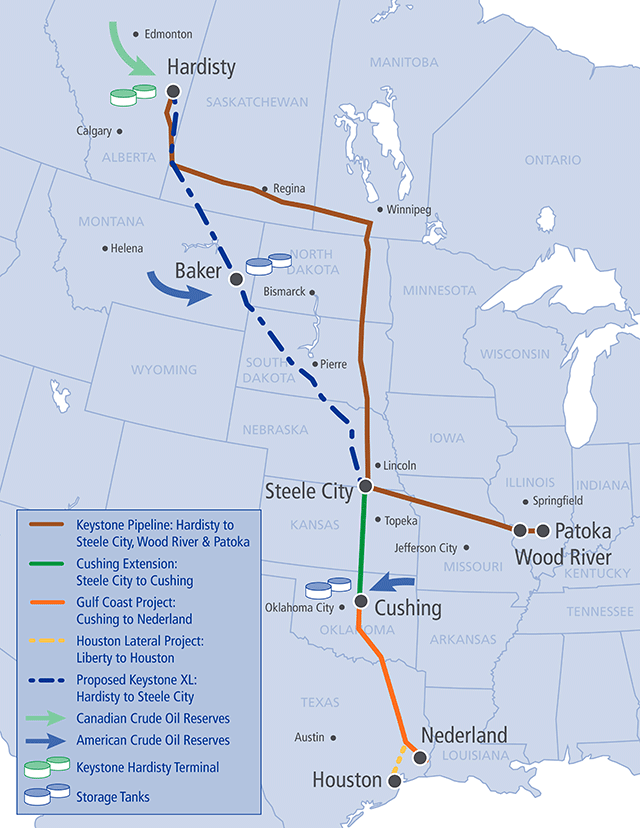
Important skills if you are concerned about projects such as the Keystone XL Pipeline:

keystone pipeline route

This is an instance where having the skills to combine geospatial, archaeological, and other data together will empower local communities to minimize the damage they will suffer from this project.

Having a background in the processing geophysical data is the first step in that process.

November 15, 2014

Py2neo 2.0

Filed under: Graphs,Neo4j,py2neo,Python — Patrick Durusau @ 7:30 pm

Py2neo 2.0 by Nigel Small.

From the webpage:

Py2neo is a client library and comprehensive toolkit for working with Neo4j from within Python applications and from the command line. The core library has no external dependencies and has been carefully designed to be easy and intuitive to use.

If you are using Neo4j or Python or both, you need to be aware of Py2Neo 2.0.

Impressive documentation!

I haven’t gone through all of it but contributed examples would be helpful.

For example:

API: Cypher

exception py2neo.cypher.ClientError(message, **kwargs)

The Client sent a bad request – changing the request might yield a successful outcome.

exception py2neo.cypher.error.request.Invalid(message, **kwargs)[source]

The client provided an invalid request.

Without an example the difference between a “bad” versus an “invalid” request isn’t clear.

Writing examples would not be a bad way to work through the Py2neo 2.0 documentation.

Enjoy!

I first saw this in a tweet by Nigel Small.

November 8, 2014

Transducers – java, js, python, ruby

Filed under: Clojure,Functional Programming,Java,Javascript,Python,Ruby — Patrick Durusau @ 10:59 am

Transducers – java, js, python, ruby

Struggling with transducers?

Learn better by example?

Cognitect Labs has released transducers for Java, JavaScript, Ruby, and Python.

Clojure recently added support for transducers – composable algorithmic transformations. These projects bring the benefits of transducers to other languages:

BTW, take a look at Rich Hickey’s latest (as of Nov. 2014) video on Transducers.

Please forward to language specific forums.

November 7, 2014

Information Extraction framework in Python

Filed under: Associations,Entity Resolution,Python — Patrick Durusau @ 3:28 pm

Information Extraction framework in Python

From the post:

IEPY is an open source tool for Information Extractionfocused on Relation Extraction.

To give an example of Relation Extraction, if we are trying to find a birth date in:

“John von Neumann (December 28, 1903 – February 8, 1957) was a Hungarian and American pure and applied mathematician, physicist, inventor and polymath.”

then IEPY’s task is to identify “John von Neumann” and “December 28, 1903” as the subject and object entities of the “was born in” relation.

It’s aimed at:
  • users needing to perform Information Extraction on a large dataset.
  • scientists wanting to experiment with new IE algorithms.

Your success with recognizing relationships will vary but every one successfully recognized is one less that must be coded by hand.

Speaking of relationships, I would prefer to also have the relationships between John von Neumann and “Hungarian and American pure and applied mathematician, physicist, inventor and polymath” recognized as well.

I first saw this in a tweet by Scientific Python.

November 1, 2014

Dive Into NLTK

Filed under: NLTK,Python — Patrick Durusau @ 7:17 pm

Dive Into NLTK Part I: Getting Started with NLTK

From the post:

NLTK is the most famous Python Natural Language Processing Toolkit, here I will give a detail tutorial about NLTK. This is the first article in a series where I will write everything about NLTK with Python, especially about text mining and text analysis online.

This is the first article in the series “Dive Into NLTK”, here is an index of all the articles in the series that have been published to date:

Part I: Getting Started with NLTK (this article)
Part II: Sentence Tokenize and Word Tokenize
Part III: Part-Of-Speech Tagging and POS Tagger
Part IV: Stemming and Lemmatization
Part V: Using Stanford Text Analysis Tools in Python
Part VI: Add Stanford Word Segmenter Interface for Python NLTK
Part VII: A Preliminary Study on Text Classification

Kudos for the refreshed index at the start of each post. Ease of navigation is a plus!

Have you considered subjecting your “usual” reading to NLTK? That is rather than analyzing a large corpus, what about the next CS article you are meaning to read?

The most I have done so far is to build concordances for standard drafts, mostly to catch bad keyword usage and misspelling. There is a lot more that could be done. Suggestions?

Enjoy this series!

October 18, 2014

Introducing Pyleus: An Open-source Framework for Building Storm Topologies in Pure Python

Filed under: Python,Storm — Patrick Durusau @ 10:42 am

Introducing Pyleus: An Open-source Framework for Building Storm Topologies in Pure Python by Patrick L.

From the post:

Yelp loves Python, and we use it at scale to power our websites and process the huge amount of data we produce.

Pyleus is a new open-source framework that aims to do for Storm what mrjob, another open-source Yelp project, does for Hadoop: let developers process large amounts of data in pure Python and iterate quickly, spending more time solving business-related problems and less time concerned with the underlying platform.

First, a brief introduction to Storm. From the project’s website, “Apache Storm is a free and open source distributed realtime computation system. Storm makes it easy to reliably process unbounded streams of data, doing for realtime processing what Hadoop did for batch processing.”

A Pyleus topology consists of, at minimum, a YAML file describing the structure of the topology, declaring each component and how tuples flow between them. The pyleus command-line tool builds a self-contained Storm JAR which can be submitted to any Storm cluster.

Since the U.S. baseball league championships are over, something to occupy you over the weekend. 😉

« Newer PostsOlder Posts »

Powered by WordPress